
Table 1
Estimated 1RM of four grip variations during the IPR
| Variation | Mean value ± SD* |
|---|---|
| CP | 60.9 ± 19.4 |
| CS | 62.9 ± 20.7 |
| WP | 57.4 ± 18.6 |
| WS | 57.4 ± 19.7 |
Source: Authors’ contribution.
Table 2
2 × 2 factorial repeated measures Anova – Trunk muscles sEMG amplitude
| Muscle | Effect | DF | F value | p value | Partial Eta Squared |
|---|---|---|---|---|---|
| UT | Width | 1.15 | 0.218 | 0.287 | 0.075 |
| UT | Orientation | 1.15 | 0.875 | 0.365 | 0.055 |
| UT | Width:Orientation | 1.15 | 3.487 | 0.082 | 0.189 |
| MT | Width | 1.17 | 4.738 | 0.044 | 0.218 |
| MT | Orientation | 1.17 | 13.863 | 0.002 | 0.449 |
| MT | Width:Orientation | 1.17 | 2.233 | 0.153 | 0.116 |
| LT | Width | 1.15 | 0.822 | 0.379 | 0.052 |
| LT | Orientation | 1.15 | 3.921 | 0.066 | 0.207 |
| LT | Width:Orientation | 1.15 | 2.321 | 0.148 | 0.134 |
| LD | Width | 1.16 | 0.896 | 0.358 | 0.053 |
| LD | Orientation | 1.16 | 4.986 | 0.040 | 0.238 |
| Ld | Width:Orientation | 1.16 | 0.865 | 0.366 | 0.051 |
UT = Upper Trapezius, MT = Middle Trapezius, LT = Lower Trapezius, LD = Latissimus Dorsi. N = 16(UT), 18(MT), 16(LT), 17(LD).
Source: Authors’ contribution.
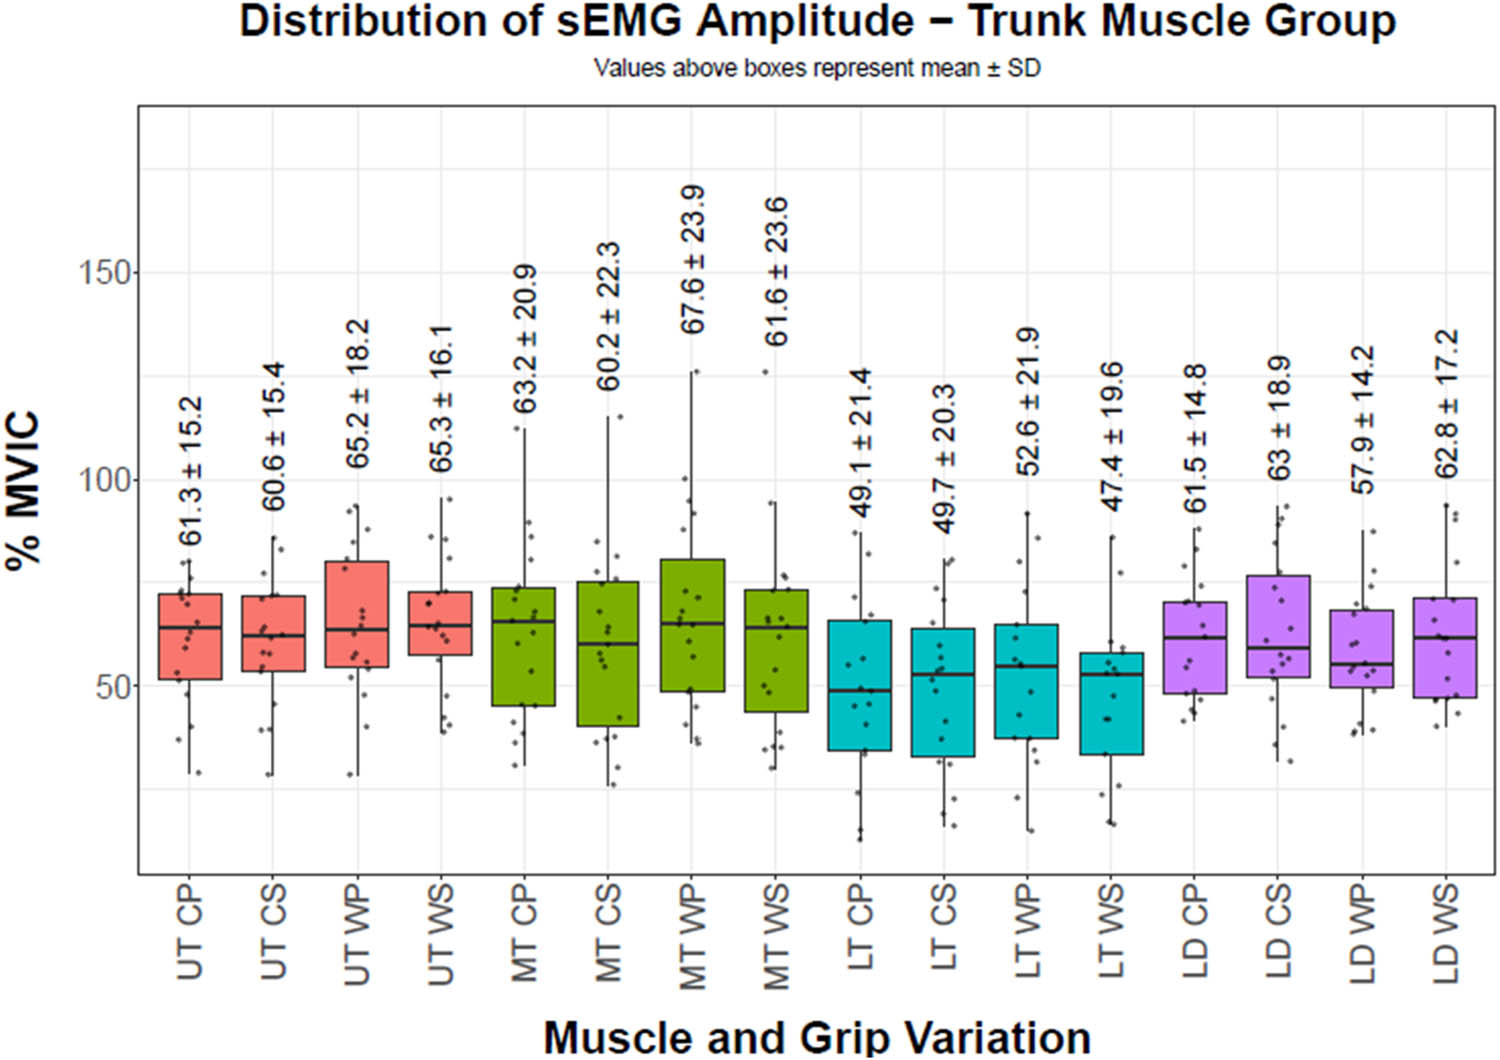
Figure 1
sEMG amplitudes of trunk muscles. Boxes represent the interquartile range; center line indicates the median; whiskers represent the range; points represent individual participants. Values above each box indicate mean value ± SD. The vertical axis reports the percentage of MVIC, while the horizontal axis reports the must group (UT = Upper Trapezius, MT = Middle Trapezius, LT = Lower Trapezius, LD = Latissimus Dorsi) along with grip position (CP = Close pronated, CS = Close supinated, WP = Wide pronated, WS = Wide supinated)
Source: Authors’ contribution.
Table 3
2 × 2 factorial repeated measures ANOVA – shoulder muscles sEMG amplitude
| Muscle | Effect | DF | F value | p value | Partial Eta Squared |
|---|---|---|---|---|---|
| MD | Width | 1.15 | 0.541 | 0.474 | 0.035 |
| MD | Orientation | 1.15 | 6.049 | 0.027 | 0.287 |
| MD | Width:Orientation | 1.15 | 3.357 | 0.087 | 0.183 |
| PD | Width | 1.18 | 1.893 | 0.186 | 0.095 |
| PD | Orientation | 1.18 | 4.436 | 0.049 | 0.198 |
| PD | Width:Orientation | 1.18 | 1.420 | 0.249 | 0.073 |
| PM | Width | 1.13 | 0.230 | 0.640 | 0.017 |
| PM | Orientation | 1.13 | 4.321 | 0.058 | 0.249 |
| PM | Width:Orientation | 1.13 | 0.057 | 0.815 | 0.004 |
MD = Middle Deltoid, PD = Posterior Deltoid, PM = Pectoralis Major. N = 16 (MD), 19 (PD), 14 (PM).
Source: Authors’ contribution.
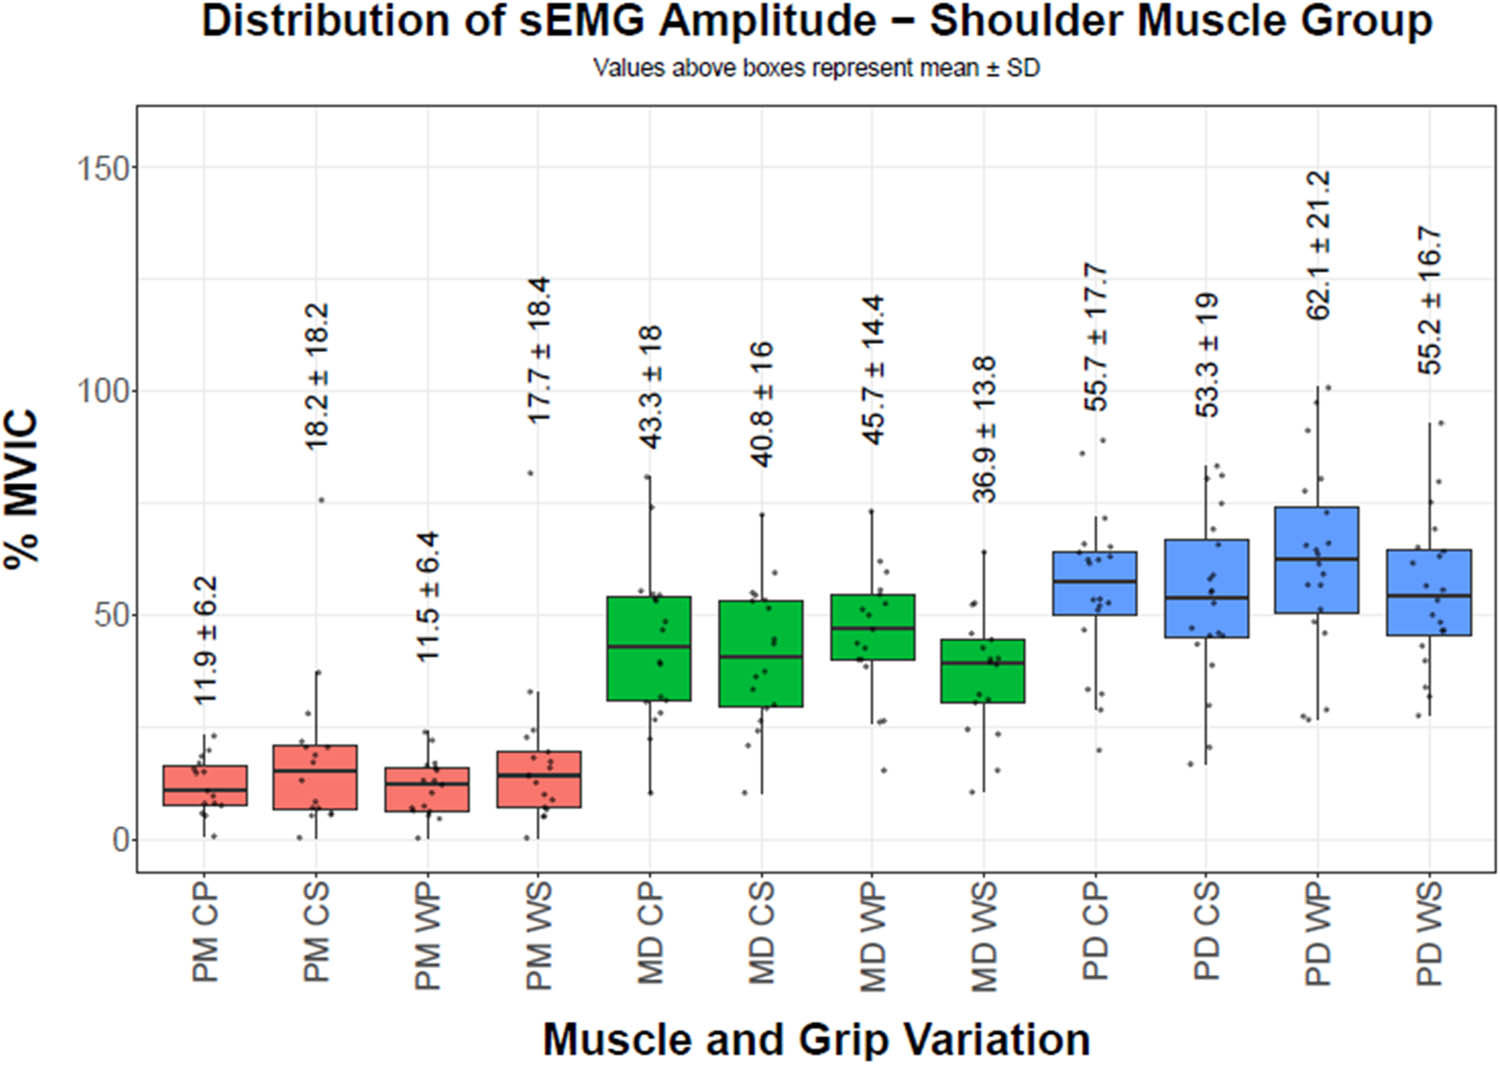
Figure 2
sEMG amplitudes of shoulder muscles. Boxes represent the interquartile range; center line indicates the median; whiskers represent the range; points represent individual participants. Values above each box indicate mean value ± SD. The vertical axis reports the percentage of MVIC, while the horizontal axis reports the muscle group (MD = Middle Deltoid, PD = Posterior Deltoid, PM = Pectoralis Major) along with grip position (CP = Close pronated, CS = Close supinated, WP = Wide pronated, WS = Wide supinated)
Source: Authors’ contribution.
Table 4
2 × 2 factorial repeated measures ANOVA – elbow muscles sEMG amplitude
| Muscle | Effect | DF | F value | p value | Partial Eta Squared |
|---|---|---|---|---|---|
| BB | Width | 1.16 | 15.217 | 0.001 | 0.487 |
| BB | Orientation | 1.16 | 10.057 | 0.006 | 0.386 |
| BB | Width:Orientation | 1.16 | 0.646 | 0.433 | 0.039 |
| BR | Width | 1.16 | 3.326 | 0.087 | 0.172 |
| BR | Orientation | 1.16 | 4.970 | 0.040 | 0.237 |
| BR | Width:Orientation | 1.16 | 2.161 | 0.161 | 0.119 |
| TB | Width | 1.15 | 0.004 | 0.952 | 0.000 |
| TB | Orientation | 1.15 | 6.265 | 0.024 | 0.295 |
| TB | Width:Orientation | 1.15 | 1.506 | 0.239 | 0.091 |
BB = Biceps Brachii, BR = Brachioradialis, TB = Triceps Brachii, N = 17 (BB), 17 (BR), 16 (TB).
Source: Authors’ contribution.
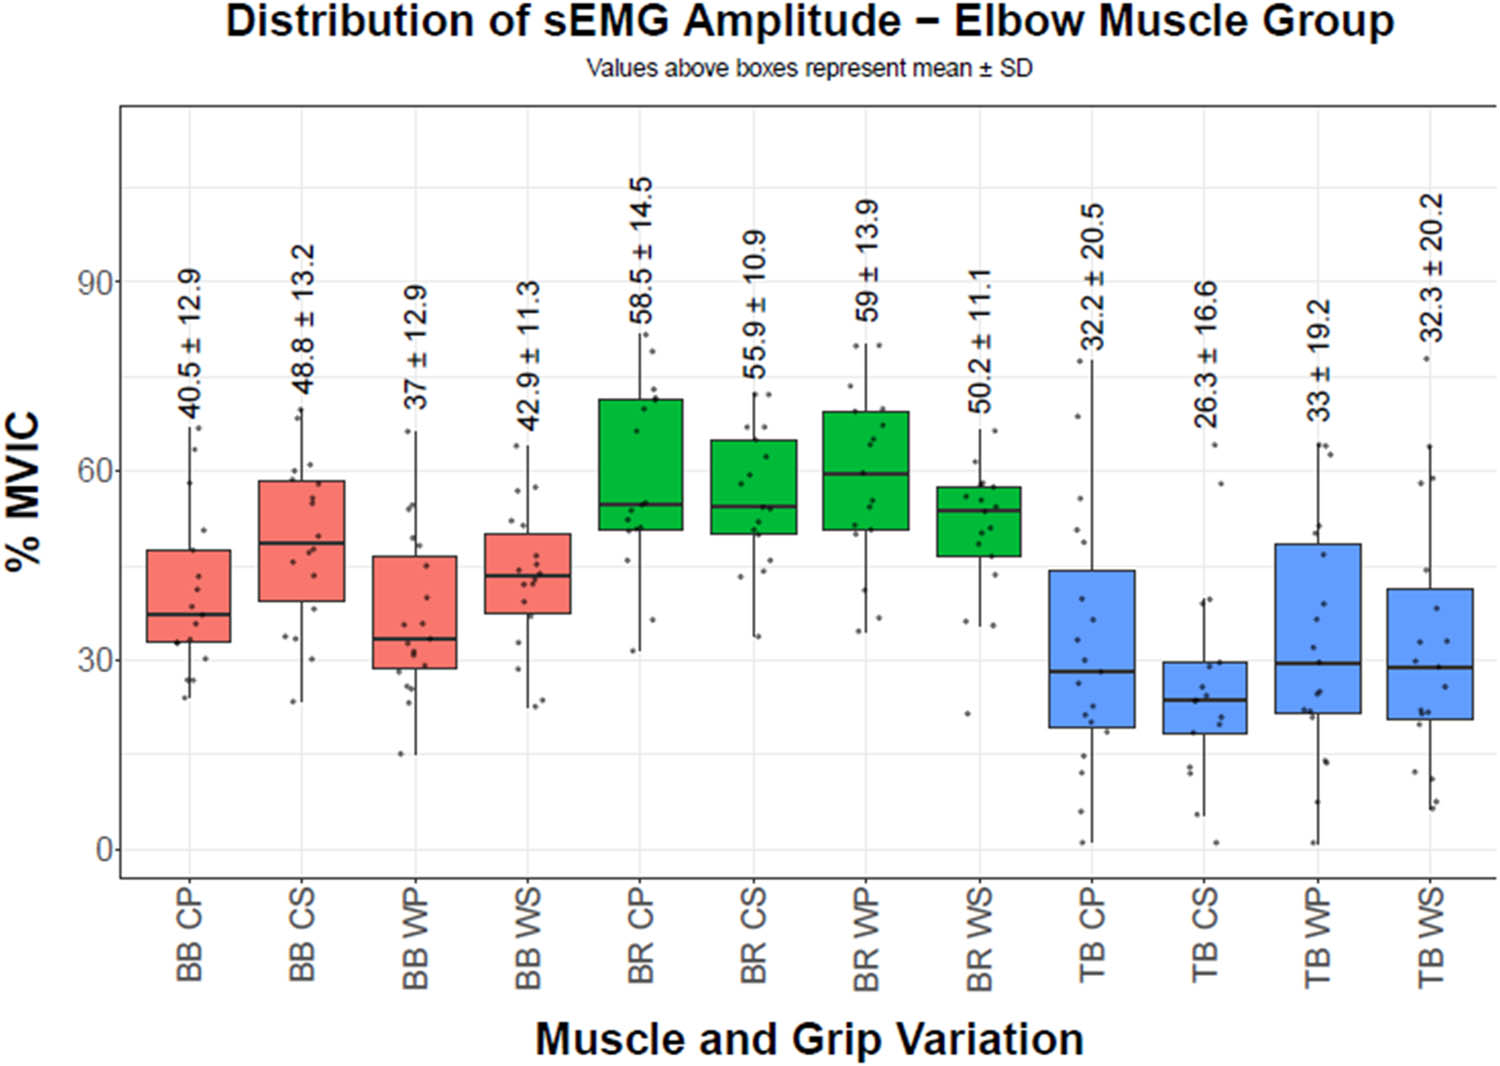
Figure 3
sEMG amplitudes of elbow muscles. Boxes represent the interquartile range; center line indicates the median; whiskers represent the range; points represent individual participants. Values above each box indicate mean value ± SD. The vertical axis reports the percentage of MVIC, while the horizontal axis reports the muscle group (BB = Biceps Brachii, BR = Brachioradialis, TB = Triceps Brachii) along with grip position (CP = Close pronated, CS = Close supinated, WP = Wide pronated, WS = Wide supinated)
Source: Authors’ contribution.