
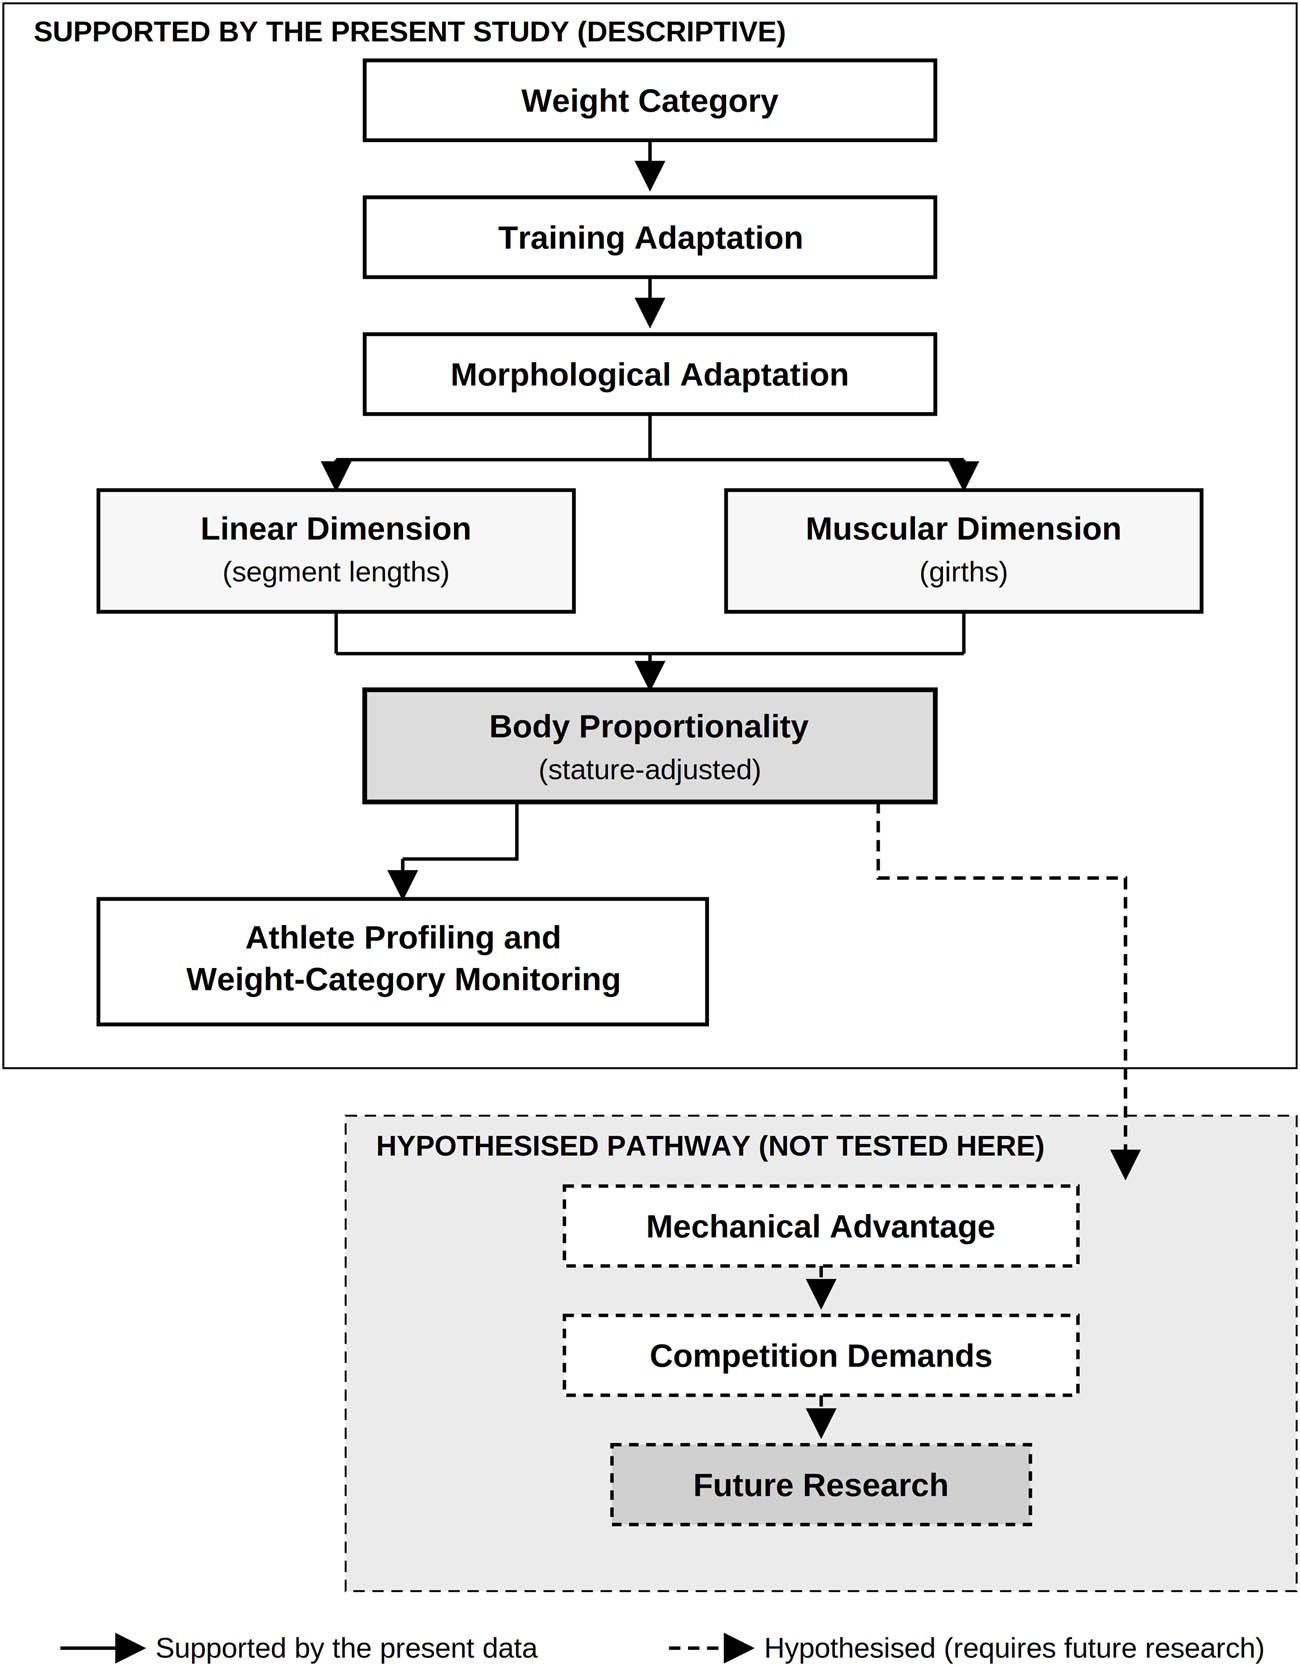
Figure 1
Conceptual framework of morphological differentiation across judo weight categories. Solid arrows denote the descriptive relationships characterised by the present study (weight category, training and morphological adaptation, the linear and muscular dimensions, body proportionality, and its use for athlete profiling and category monitoring). Dashed arrows denote a hypothesised pathway from body proportionality to mechanical advantage and competitive performance that was not tested in this study and is proposed as a direction for future research
Source: Author’s contribution.
Table 1
Descriptive characteristics (mean ± SD) of the judo athletes by weight category
| Variable | ≤60 (n = 54) | −66 (n = 27) | −73 (n = 32) | −81 (n = 37) | −90 (n = 27) | −100 (n = 18) | + 100 (n = 19) | Total (N = 214) |
|---|---|---|---|---|---|---|---|---|
| Stature (cm) | 164.17 ± 5.49 | 168.50 ± 4.36 | 170.14 ± 4.81 | 173.45 ± 4.81 | 177.12 ± 4.38 | 177.92 ± 5.17 | 178.31 ± 4.87 | 171.26 ± 7.13 |
| Body mass (kg) | 55.54 ± 3.17 | 63.98 ± 1.75 | 70.13 ± 2.02 | 76.57 ± 2.19 | 85.34 ± 2.12 | 94.97 ± 2.37 | 107.71 ± 6.31 | 74.13 ± 16.31 |
| BMI (kg m⁻²) | 20.66 ± 1.61 | 22.58 ± 1.35 | 24.27 ± 1.37 | 25.51 ± 1.63 | 27.25 ± 1.58 | 30.06 ± 1.82 | 33.95 ± 2.73 | 25.08 ± 4.29 |
| Ponderal index | 43.05 ± 1.53 | 42.14 ± 1.17 | 41.26 ± 1.13 | 40.85 ± 1.19 | 40.24 ± 1.08 | 39.00 ± 1.11 | 37.50 ± 1.27 | 41.10 ± 2.07 |
| Sitting height (cm) | 85.89 ± 2.57 | 87.32 ± 2.70 | 88.52 ± 2.94 | 89.85 ± 2.99 | 91.53 ± 2.81 | 91.90 ± 2.66 | 91.72 ± 2.54 | 88.88 ± 3.54 |
| Trunk height (cm) | 58.06 ± 2.39 | 60.18 ± 2.52 | 61.47 ± 2.54 | 64.55 ± 3.68 | 64.91 ± 2.36 | 65.67 ± 1.77 | 64.94 ± 2.27 | 62.08 ± 3.91 |
| Arm length (cm) | 71.02 ± 2.99 | 73.20 ± 2.95 | 74.98 ± 3.09 | 77.05 ± 3.09 | 79.16 ± 3.45 | 78.73 ± 4.37 | 79.44 ± 3.59 | 75.35 ± 4.53 |
| Leg length (cm) | 86.79 ± 4.18 | 87.56 ± 4.41 | 90.55 ± 4.79 | 93.94 ± 4.93 | 95.02 ± 4.75 | 94.84 ± 4.12 | 96.83 ± 6.32 | 91.29 ± 5.95 |
| Hand length (cm) | 17.86 ± 0.89 | 18.46 ± 0.74 | 18.67 ± 0.81 | 18.76 ± 0.71 | 19.36 ± 0.76 | 19.41 ± 0.89 | 19.35 ± 0.97 | 18.66 ± 0.99 |
| Palm circumference (cm) | 20.20 ± 0.88 | 21.20 ± 0.74 | 21.30 ± 1.10 | 21.89 ± 0.82 | 22.78 ± 0.85 | 22.86 ± 0.97 | 23.25 ± 1.33 | 21.60 ± 1.40 |
| Chest circumference (cm) | 85.71 ± 4.38 | 88.79 ± 3.32 | 92.92 ± 4.50 | 98.04 ± 4.22 | 102.47 ± 4.35 | 107.62 ± 4.68 | 115.19 ± 7.01 | 95.88 ± 10.27 |
| Abdominal circumference (cm) | 71.11 ± 3.12 | 75.96 ± 3.24 | 80.25 ± 4.70 | 84.22 ± 4.47 | 90.13 ± 3.96 | 95.11 ± 3.52 | 104.70 ± 6.30 | 82.76 ± 10.99 |
| Calf circumference (cm) | 32.03 ± 2.14 | 33.82 ± 1.50 | 34.99 ± 1.66 | 36.18 ± 1.65 | 37.49 ± 1.27 | 39.71 ± 1.70 | 40.94 ± 1.93 | 35.54 ± 3.35 |
Note: Values are mean ± standard deviation. BMI and ponderal index are derived indices and were not entered into the principal component analysis.
Source: Author’s contribution.
Table 2
Rotated component matrix and variance explained (PCA, Varimax rotation)
| Variable | Component 1 (Length) | Component 2 (Mass/Girth) | Communality |
|---|---|---|---|
| Stature (cm) | 0.847 | 0.836 | |
| Hand length | 0.810 | 0.688 | |
| Arm length | 0.787 | 0.735 | |
| Leg length | 0.733 | 0.623 | |
| Trunk height | 0.708 | 0.419 | 0.677 |
| Sitting height | 0.664 | 0.564 | |
| Palm circumference | 0.611 | 0.562 | 0.690 |
| Abdominal circumference | 0.892 | 0.908 | |
| Chest circumference | 0.881 | 0.900 | |
| Calf circumference | 0.880 | 0.844 | |
| Body mass (kg) | 0.451 | 0.870 | 0.960 |
| Eigenvalue | 7.24 | 1.19 | |
| % variance (rotated) | 39.60 | 37.00 | |
| Cumulative % | 76.60 |
Note: KMO = 0.908; Bartlett’s χ²(55) = 2487.07, p < 0.001. Loadings <0.40 are suppressed. Extraction: principal components; rotation: Varimax with Kaiser normalisation. A robustness check using an oblique (Promax) rotation reproduced the same two-component solution (component correlation r = 0.681).
Source: Author’s contribution.
Table 3
Stature-adjusted (estimated marginal) means with 95% confidence intervals by weight category, and ANCOVA test statistics
| Variable | ≤60 | −66 | −73 | −81 | −90 | −100 | + 100 | F(6,206) | p | η 2_p |
|---|---|---|---|---|---|---|---|---|---|---|
| Calf circumference | 31.6 [31.0, 32.1] | 33.6 [33.0, 34.3] | 34.9 [34.3, 35.5] | 36.3 [35.8, 36.9] | 37.9 [37.2, 38.6] | 40.2 [39.3, 41.0] | 41.4 [40.5, 42.3] | 58.89 | <0.001 | 0.632 |
| Palm circumference | 20.5 [20.2, 20.8] | 21.3 [21.0, 21.7] | 21.3 [21.0, 21.7] | 21.8 [21.5, 22.1] | 22.5 [22.2, 22.9] | 22.6 [22.1, 23.0] | 23.0 [22.5, 23.4] | 13.75 | <0.001 | 0.286 |
| Trunk height | 59.8 [59.0, 60.5] | 60.8 [59.9, 61.8] | 61.7 [60.9, 62.6] | 64.0 [63.2, 64.8] | 63.5 [62.5, 64.5] | 64.1 [62.9, 65.3] | 63.3 [62.1, 64.4] | 10.03 | <0.001 | 0.226 |
| Arm length | 73.5 [72.6, 74.4] | 74.2 [73.1, 75.2] | 75.4 [74.4, 76.3] | 76.3 [75.4, 77.2] | 77.1 [76.0, 78.2] | 76.4 [75.0, 77.8] | 77.0 [75.6, 78.3] | 4.33 | <0.001 | 0.112 |
| Leg length | 89.7 [88.3, 91.1] | 88.7 [87.1, 90.4] | 91.0 [89.5, 92.5] | 93.0 [91.6, 94.4] | 92.6 [90.8, 94.4] | 92.1 [89.9, 94.2] | 93.9 [91.8, 96.0] | 3.48 | 0.003 | 0.092 |
| Hand length | 18.4 [18.1, 18.6] | 18.7 [18.4, 18.9] | 18.7 [18.5, 19.0] | 18.6 [18.4, 18.9] | 19.0 [18.6, 19.3] | 18.9 [18.6, 19.3] | 18.9 [18.5, 19.2] | 1.65 | 0.135 | 0.046 |
| Sitting height | 88.0 [87.2, 88.7] | 88.1 [87.2, 89.0] | 88.8 [88.0, 89.7] | 89.2 [88.4, 90.0] | 89.8 [88.8, 90.8] | 90.0 [88.8, 91.1] | 89.7 [88.5, 90.8] | 1.79 | 0.103 | 0.049 |
Values are stature-adjusted means [95% confidence interval], in cm, evaluated at stature = 171.26 cm.
Note. η 2_p = partial eta squared. Covariate = stature. Family-wise threshold Bonferroni-adjusted to α ≈ 0.0071 across the seven ANCOVA models; the category effect remained significant for the top five variables and non-significant (n.s.) for hand length and sitting height. Stature was a significant covariate in all models (p ≤ 0.008). Pairwise (Bonferroni-corrected) comparisons among categories are summarised in the text and the full set is available from the corresponding author on request. Chest and abdominal circumference are reported as absolute size differences (Table 1; see text) and are not included here. Effect-size benchmarks (Cohen): η 2_p ≈ 0.01 small, 0.06 medium, 0.14 large.
Source: Author’s contribution.