
1. Introduction
Judo is an Olympic combat sport in which athletes compete in defined body-mass categories. Performance depends on technical skill, tactical judgement, and physical capacities such as strength, power, and grip endurance (Callister et al., 1991; Franchini et al., 2011; Krstulović et al., 2006). Because competition is organised by body mass, the athlete’s physical structure is of particular interest. Body size and proportion influence leverage, reach, and grip, and shape the mechanical context in which throwing and grappling techniques are performed. Anthropometric characterisation therefore has a long-standing place in the applied science of judo and of combat sports more broadly.
From a biomechanical standpoint, several features of body structure are theoretically relevant to the performance of judo athletes. Segment lengths determine the moment arms through which muscular and external forces act, so that differences in relative arm and leg length may alter the leverage available for executing throws (nage-waza) and for the off-balancing of the opponent (kuzushi) that precedes them (Murray et al., 2002; Zatsiorsky, 2002). Reach and hand dimensions bear directly on the grip contest (kumi-kata) that governs the start of most attacks (Sacripanti, 2010). Trunk proportions and the distribution of body mass influence balance and resistance to being thrown, and the transmission of force from the lower limbs through the trunk to the opponent also depends on segmental configuration. Because these demands are expressed within body-mass categories, the morphology that is mechanically advantageous may differ across the weight spectrum. Anthropometric characteristics have also been shown to distinguish judo athletes of different competitive levels (Teixeira et al., 2022). Together, these points provide a rationale for examining body proportion rather than body size alone. The present study is anthropometric; however, it does not test these mechanical relationships.
Kinanthropometric profiling is widely used to describe athletic populations, to generate sport-specific reference data, and to support athlete monitoring (Cullen et al., 2022). Because anthropometric variables are numerous and strongly intercorrelated, multivariate techniques such as principal component analysis (PCA) are valuable for reducing a battery of measurements to a smaller number of interpretable dimensions and for revealing the structure that underlies an athlete’s physique (Burdukiewicz et al., 2018). Such data-reduction approaches complement univariate description by clarifying whether linear and mass-related characteristics vary together or independently within a population.
In judo, anthropometric and body composition characteristics vary systematically across weight categories. Comparative studies of judoka spanning all official categories report that heavier categories are taller and heavier and tend toward proportionally greater adiposity and lower relative muscle mass, whereas lighter categories present leaner, more linear profiles (Claessens et al., 1987; Franchini et al., 2014), and somatotype analyses describe corresponding shifts in physique across the mass spectrum (Hamzaoui et al., 2022; Roklicer et al., 2020). Differences between lighter and heavier judoka extend to performance-related characteristics as well (Engwerda et al., 2020). Much of this evidence derives from South American and European cohorts, with fewer profiles reported from other national contexts (e.g., Ceylan et al., 2018); comparatively little anthropometric reference data exist for Indian judoka, and existing work has been largely univariate (Katralli & Goudar, 2012; Pérez Armendáriz et al., 2023), leaving the multivariate anthropometric structure across weight categories in competitive Indian male judoka largely undescribed.
Two considerations motivate this present analysis. First, population-specific reference data are needed to contextualise the profiles of Indian judoka against category peers since anthropometric norms derived from one population may not transfer to another. Second, comparisons of raw anthropometric measurements across weight categories are of limited inferential value because the categories are themselves defined by body mass: heavier categories are, by construction, larger on virtually every mass-related dimension. The more informative question is whether judoka in different categories differ in their stature-adjusted anthropometric measurements, that is, in measurements not explained by overall size. Addressing this question requires that overall size be statistically controlled or otherwise standardised, an approach recently emphasised in judo anthropometry (Lopes et al., 2025), which distinguishes genuine morphological differences from those that follow trivially from the categorisation.
These strands can be combined into a simple conceptual framework (Figure 1). Within a given weight category, the demands of training drive sport-specific morphological adaptation, which can be resolved into two components, a linear (skeletal-length) dimension and a muscular (girth) dimension, that jointly define an athlete’s body proportionality. Body proportionality is, in principle, the morphological basis for the mechanical demands of the sport described earlier and, in turn, for athlete profiling and category monitoring in the sport. Only the descriptive portion of this framework is examined here: the present study characterises the dimensional structure and the stature-adjusted differences across categories, whereas the onward links from proportionality to mechanical advantage and competitive performance are hypothesised and remain to be tested.
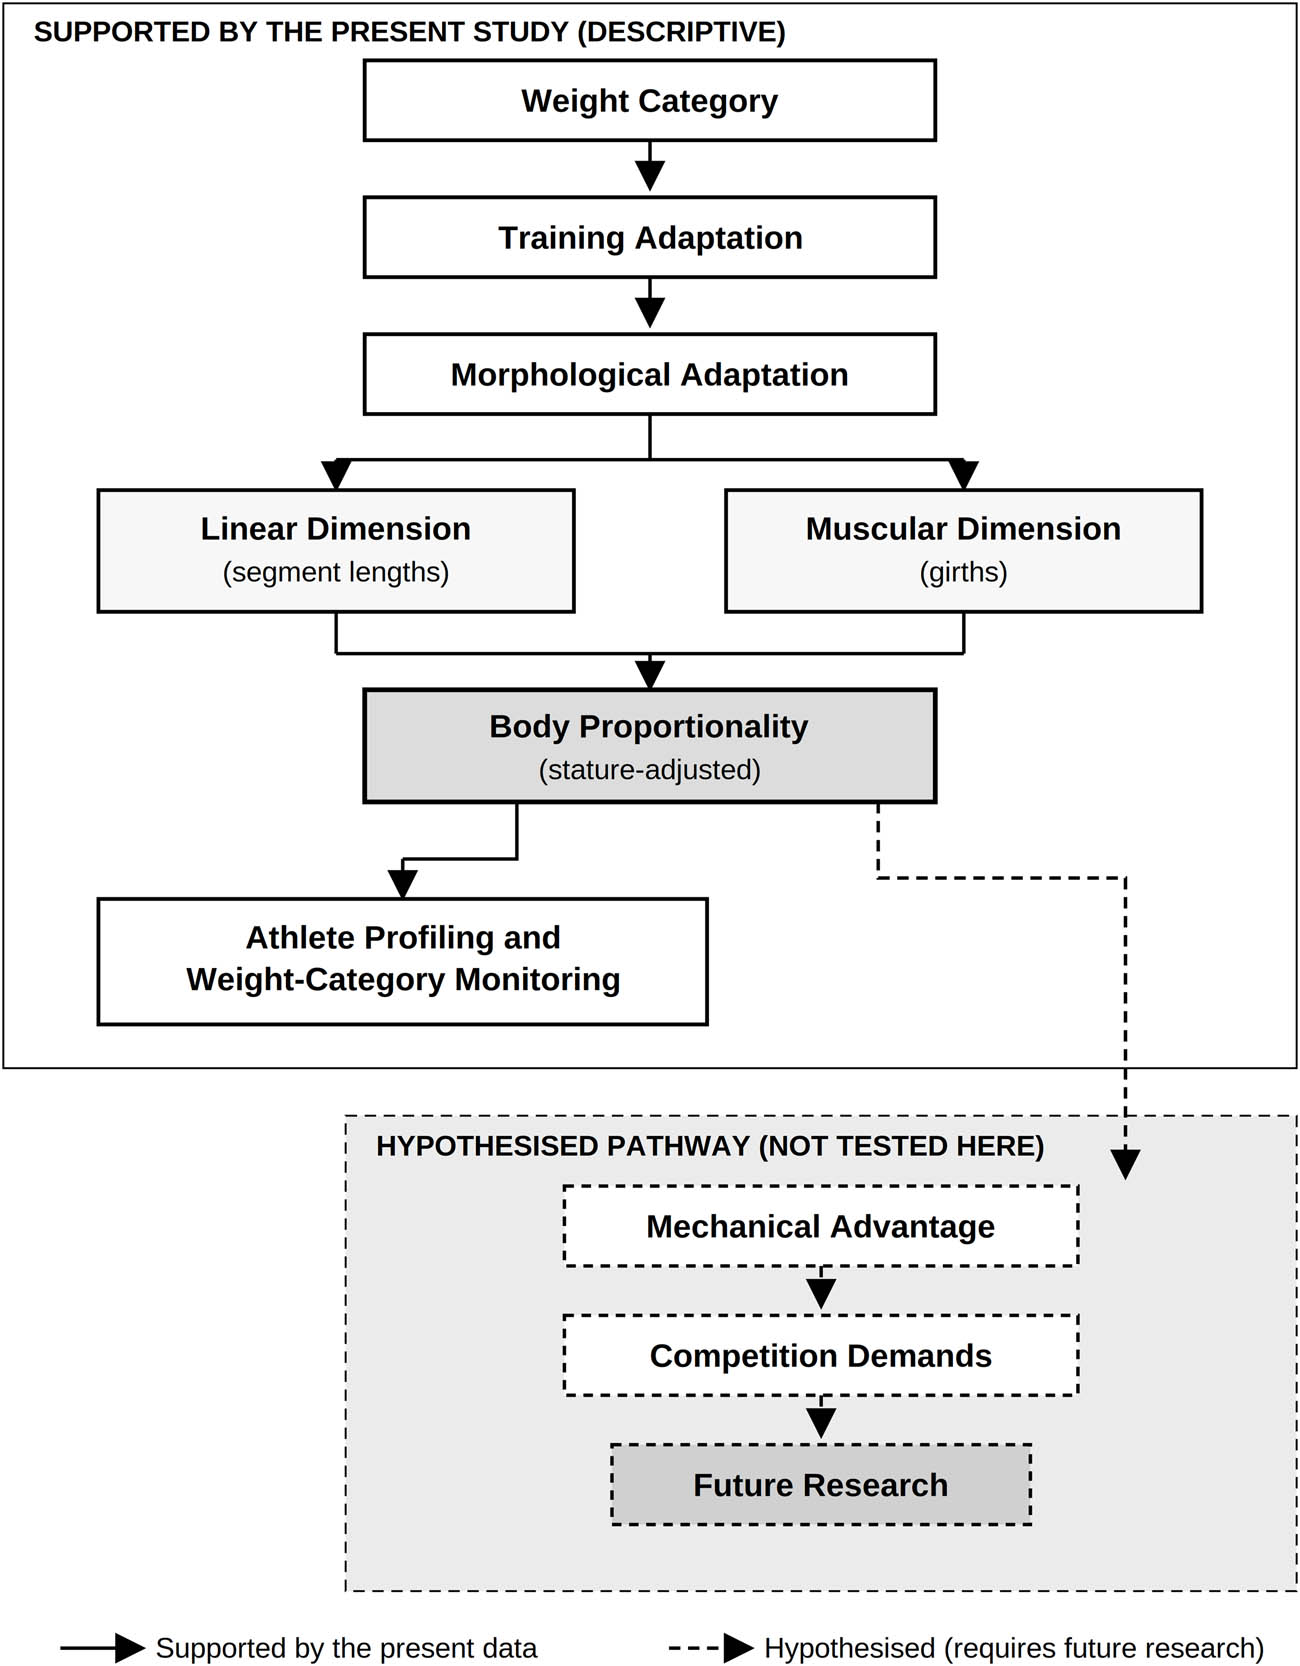
Figure 1
Conceptual framework of morphological differentiation across judo weight categories. Solid arrows denote the descriptive relationships characterised by the present study (weight category, training and morphological adaptation, the linear and muscular dimensions, body proportionality, and its use for athlete profiling and category monitoring). Dashed arrows denote a hypothesised pathway from body proportionality to mechanical advantage and competitive performance that was not tested in this study and is proposed as a direction for future research
Source: Author’s contribution.
Accordingly, the aims of the present study were threefold: (a) to describe the anthropometric profile of competitive Indian male judo athletes across the seven senior weight categories; (b) to identify the dimensional structure underlying their anthropometric characteristics using PCA; and (c) to determine whether, and in which measures, anthropometric measurements differ across weight categories once stature is statistically controlled. The study is descriptive and exploratory; it does not include performance measures and is not intended to support inferences about performance determinants or talent identification.
2. Materials and methods
2.1. Participants
A total of 214 male judo athletes were recruited and classified, according to their competition body mass, into the seven senior weight categories of the International Judo Federation: ≤60 kg (n = 54), −66 kg (n = 27), −73 kg (n = 32), −81 kg (n = 37), −90 kg (n = 27), −100 kg (n = 18), and +100 kg (n = 19). Participants ranged in age from 18 to 35 years (mean 23.2 ± 4.3 years), and all were adults.
Athletes were recruited from national training camps, All-India Inter-University Championships, and national tournaments, settings deliberately selected because they concentrate on judoka with an established training background and a defined competitive standard. Two inclusion criteria were applied to ensure a homogeneous competitive caliber: (a) a minimum of 3 years of systematic judo training experience and (b) at least one documented competitive achievement, operationally defined as a state-level medal, participation in national-level competition, or participation in the All-India Inter-University championships. Applying these eligibility criteria to the recruited pool yielded the 214 athletes analysed here. The average training experience was 7.2 ± 4.2 years (range: 3 years 4 months to 18 years 7 months). The aforementioned criteria represent the minimum standard for inclusion; the sample also included 16 athletes who had represented India in international competition. According to the Participant Classification Framework of McKay et al. (2022), the sample spanned Tier 2 to Tier 4 (Trained/Developmental to Elite/International), with the majority at the national level.
No exclusion criteria were applied beyond the inclusion criteria. Data were collected in-season, during regular training sessions in the period leading up to competition. The study was conducted in accordance with the Declaration of Helsinki and approved by the Ethics Committee of Shaheed Bhagat Singh Evening College, New Delhi, India. Informed consent was obtained from all participants prior to data collection.
2.2. Anthropometric measurements
Thirteen anthropometric variables were assessed for each athlete: stature, body mass, sitting height, trunk height, arm length, leg length, hand length, palm circumference, chest circumference, abdominal circumference, and calf circumference, along with two derived indices, body mass index (BMI), and the ponderal index. Measurements followed the International Society for the Advancement of Kinanthropometry (ISAK) guidelines (Stewart et al., 2011) and were taken by a trained anthropometrist.
Stature and sitting height were measured with a stadiometer to the nearest 0.1 cm, and segmental lengths with a segmometer (or anthropometer) to the nearest 0.1 cm. Body mass was recorded using a calibrated electronic scale to the nearest 0.1 kg. Circumferences were measured using a flexible, non-elastic anthropometric tape to the nearest 0.1 cm. In accordance with ISAK guidelines, all measurements were taken on the right side of the body at the prescribed anatomical landmarks (Stewart et al., 2011). Hand length, which is not part of the standard ISAK profile, was measured as the distance from the stylion (midpoint of the distal wrist crease) to the dactylion (tip of the middle finger) with the hand fully extended. Palm circumference was measured around the metacarpal heads (excluding the thumb) with the hand relaxed and the fingers together.
BMI is calculated as body mass divided by stature squared (kg m⁻²), and the ponderal index as stature (in cm) divided by the cube root of body mass (kg).
Inter-rater reliability was assessed in a subsample of 20 participants, who were measured independently by the primary anthropometrist and by a second ISAK Level 2-accredited assessor. Each assessor recorded three measurements per site, and the mean of the three was used. Agreement between assessors was quantified using the intraclass correlation coefficient (ICC) based on a two-way mixed-effects model with absolute agreement (average-measures form, ICC[3,3]). Reliability was excellent, with ICC values exceeding 0.97 for all variables.
2.3. Statistical analysis
All analyses were performed using IBM SPSS Statistics version 27, with the significance level set at p < 0.05 unless otherwise stated. Prior to the main analyses, the data were screened for accuracy and completeness. Univariate normality was assessed within each weight category using the Shapiro–Wilk test together with skewness and kurtosis indices. Multivariate outliers were identified using the Mahalanobis distance evaluated against a chi-square criterion (p < 0.001; Tabachnick & Fidell, 2019). Homogeneity of error variances was examined with Levene’s test, and homogeneity of covariance matrices with Box’s M test. For each univariate analysis of covariance (ANCOVA), the homogeneity-of-regression-slopes assumption was assessed by testing the stature by weight-category interaction.
The dimensional structure of the anthropometric profile was examined by PCA, conducted on the 11 directly measured anthropometric variables (excluding the derived BMI and ponderal index). PCA was used for data reduction and description of the dimensional structure rather than for latent-construct modelling. The analysis was performed on the correlation matrix (standardised variables), so that measures on different scales, including body mass, contributed on a comparable basis. Sampling adequacy was verified using the Kaiser–Meyer–Olkin (KMO) measure and Bartlett’s test of sphericity. Components were retained on the basis of the Kaiser criterion (eigenvalue > 1), corroborated by inspection of the scree plot, and a Varimax rotation was applied with rotated loadings ≥ 0.40 interpreted. As a robustness check, the analysis was repeated using an oblique (Promax) rotation to evaluate whether the component structure was sensitive to the assumption of orthogonal components.
Differences across weight categories were examined with stature as a covariate. Category effects therefore represent differences at a common stature (the estimated marginal means), not ratios or allometric indices. A one-way multivariate analysis of covariance (MANCOVA) was conducted with weight category as the fixed factor, stature as the covariate, and seven limb and segmental variables (arm length, trunk height, leg length, hand length, sitting height, palm circumference, and calf circumference) as dependent variables. The two trunk girths (chest and abdominal circumference), which scale with body mass rather than stature and violated the homogeneity-of-variance assumption, were summarised descriptively instead (Section 3.5), whereas the appendicular and hand girths (calf and palm) were retained as informative shape measures. Because Box’s M indicated heterogeneity of covariance matrices and group sizes were unequal, Pillai’s trace was used as the primary multivariate criterion.
Following a significant multivariate effect, univariate ANCOVAs were computed for the same seven variables. A Bonferroni-adjusted threshold of α = 0.05/7 ≈ 0.0071 was applied to the weight-category effect, and pairwise comparisons of estimated marginal means used Bonferroni correction. Effect sizes are reported as partial eta squared (η 2), interpreted using Cohen’s (1988) benchmarks (≈ 0.01 small, 0.06 medium, 0.14 large). The robustness of the findings to the two multivariate outliers was verified by re-running the analyses with these cases excluded.
3. Results
3.1. Preliminary analyses
Data from 214 male judo athletes distributed across the seven senior weight categories were analysed. Descriptive statistics for all anthropometric variables by weight category are presented in Table 1.
Table 1
Descriptive characteristics (mean ± SD) of the judo athletes by weight category
| Variable | ≤60 (n = 54) | −66 (n = 27) | −73 (n = 32) | −81 (n = 37) | −90 (n = 27) | −100 (n = 18) | + 100 (n = 19) | Total (N = 214) |
|---|---|---|---|---|---|---|---|---|
| Stature (cm) | 164.17 ± 5.49 | 168.50 ± 4.36 | 170.14 ± 4.81 | 173.45 ± 4.81 | 177.12 ± 4.38 | 177.92 ± 5.17 | 178.31 ± 4.87 | 171.26 ± 7.13 |
| Body mass (kg) | 55.54 ± 3.17 | 63.98 ± 1.75 | 70.13 ± 2.02 | 76.57 ± 2.19 | 85.34 ± 2.12 | 94.97 ± 2.37 | 107.71 ± 6.31 | 74.13 ± 16.31 |
| BMI (kg m⁻²) | 20.66 ± 1.61 | 22.58 ± 1.35 | 24.27 ± 1.37 | 25.51 ± 1.63 | 27.25 ± 1.58 | 30.06 ± 1.82 | 33.95 ± 2.73 | 25.08 ± 4.29 |
| Ponderal index | 43.05 ± 1.53 | 42.14 ± 1.17 | 41.26 ± 1.13 | 40.85 ± 1.19 | 40.24 ± 1.08 | 39.00 ± 1.11 | 37.50 ± 1.27 | 41.10 ± 2.07 |
| Sitting height (cm) | 85.89 ± 2.57 | 87.32 ± 2.70 | 88.52 ± 2.94 | 89.85 ± 2.99 | 91.53 ± 2.81 | 91.90 ± 2.66 | 91.72 ± 2.54 | 88.88 ± 3.54 |
| Trunk height (cm) | 58.06 ± 2.39 | 60.18 ± 2.52 | 61.47 ± 2.54 | 64.55 ± 3.68 | 64.91 ± 2.36 | 65.67 ± 1.77 | 64.94 ± 2.27 | 62.08 ± 3.91 |
| Arm length (cm) | 71.02 ± 2.99 | 73.20 ± 2.95 | 74.98 ± 3.09 | 77.05 ± 3.09 | 79.16 ± 3.45 | 78.73 ± 4.37 | 79.44 ± 3.59 | 75.35 ± 4.53 |
| Leg length (cm) | 86.79 ± 4.18 | 87.56 ± 4.41 | 90.55 ± 4.79 | 93.94 ± 4.93 | 95.02 ± 4.75 | 94.84 ± 4.12 | 96.83 ± 6.32 | 91.29 ± 5.95 |
| Hand length (cm) | 17.86 ± 0.89 | 18.46 ± 0.74 | 18.67 ± 0.81 | 18.76 ± 0.71 | 19.36 ± 0.76 | 19.41 ± 0.89 | 19.35 ± 0.97 | 18.66 ± 0.99 |
| Palm circumference (cm) | 20.20 ± 0.88 | 21.20 ± 0.74 | 21.30 ± 1.10 | 21.89 ± 0.82 | 22.78 ± 0.85 | 22.86 ± 0.97 | 23.25 ± 1.33 | 21.60 ± 1.40 |
| Chest circumference (cm) | 85.71 ± 4.38 | 88.79 ± 3.32 | 92.92 ± 4.50 | 98.04 ± 4.22 | 102.47 ± 4.35 | 107.62 ± 4.68 | 115.19 ± 7.01 | 95.88 ± 10.27 |
| Abdominal circumference (cm) | 71.11 ± 3.12 | 75.96 ± 3.24 | 80.25 ± 4.70 | 84.22 ± 4.47 | 90.13 ± 3.96 | 95.11 ± 3.52 | 104.70 ± 6.30 | 82.76 ± 10.99 |
| Calf circumference (cm) | 32.03 ± 2.14 | 33.82 ± 1.50 | 34.99 ± 1.66 | 36.18 ± 1.65 | 37.49 ± 1.27 | 39.71 ± 1.70 | 40.94 ± 1.93 | 35.54 ± 3.35 |
Note: Values are mean ± standard deviation. BMI and ponderal index are derived indices and were not entered into the principal component analysis.
Source: Author’s contribution.
Distributional characteristics were examined for all variables. Skewness ranged from −0.13 to 0.68 and kurtosis from −0.68 to −0.01, with all values well within the conventional limits for approximate normality (|skewness| <2, |kurtosis| <7). The largest positive skewness values were observed for body mass (0.65), abdominal circumference (0.68), and chest circumference (0.63), consistent with the mass-driven distribution of these measures.
Multivariate outliers were screened using the Mahalanobis distance against a χ² criterion (p < 0.001; critical value = 31.26, df = 11). Two cases (0.9%) exceeded the threshold; both were retained, as they reflected genuine anthropometric variation at the extremes of the weight range (their influence on the results is examined in Section 3.6). Homogeneity of error variances was assessed with Levene’s test for each dependent variable, and homogeneity of covariance matrices with Box’s M; the homogeneity-of-regression-slope assumption was assessed for each variable by testing the stature by weight-category interaction (reported in Section 3.6). These are reported alongside the relevant analyses.
3.2. Anthropometric dimensions (principal component analysis)
The 11 primary anthropometric measurements were subjected to a PCA with Varimax rotation. Sampling adequacy was excellent (Kaiser–Meyer–Olkin = 0.908; all individual measures of sampling adequacy ≥ 0.855), and Bartlett’s test of sphericity was significant, χ²(55) = 2487.07, p < 0.001, confirming the suitability of the data for factor extraction.
Two components with eigenvalues exceeding 1.0 were retained (7.24 and 1.19), a solution corroborated by the scree plot, and together they accounted for 76.60% of the total variance. After rotation, the two components explained a comparable share of variance (39.60 and 37.00%). Communalities were satisfactory for all variables (range = 0.564–0.960). As shown in Table 2, the first component was defined by longitudinal skeletal dimensions, stature, hand length, arm length, leg length, trunk height, and sitting height, and was interpreted as a linear/skeletal-length dimension. The second component was defined by circumferential and mass-related measures, abdominal, chest, and calf circumference, and body mass, and was interpreted as a mass/girth dimension. Palm circumference loaded on both components, and body mass, while loading primarily on the mass/girth component, showed a secondary loading on the length component; these cross-loadings are consistent with measures that carry both length-related and bulk-related information. The anthropometric profile of the sample therefore reduced to two interpretable dimensions: how long the athlete is built, and how broad and heavy the athlete is built.
Table 2
Rotated component matrix and variance explained (PCA, Varimax rotation)
| Variable | Component 1 (Length) | Component 2 (Mass/Girth) | Communality |
|---|---|---|---|
| Stature (cm) | 0.847 | 0.836 | |
| Hand length | 0.810 | 0.688 | |
| Arm length | 0.787 | 0.735 | |
| Leg length | 0.733 | 0.623 | |
| Trunk height | 0.708 | 0.419 | 0.677 |
| Sitting height | 0.664 | 0.564 | |
| Palm circumference | 0.611 | 0.562 | 0.690 |
| Abdominal circumference | 0.892 | 0.908 | |
| Chest circumference | 0.881 | 0.900 | |
| Calf circumference | 0.880 | 0.844 | |
| Body mass (kg) | 0.451 | 0.870 | 0.960 |
| Eigenvalue | 7.24 | 1.19 | |
| % variance (rotated) | 39.60 | 37.00 | |
| Cumulative % | 76.60 |
Note: KMO = 0.908; Bartlett’s χ²(55) = 2487.07, p < 0.001. Loadings <0.40 are suppressed. Extraction: principal components; rotation: Varimax with Kaiser normalisation. A robustness check using an oblique (Promax) rotation reproduced the same two-component solution (component correlation r = 0.681).
Source: Author’s contribution.
To assess the robustness of this structure, the PCA was repeated with an oblique (Promax) rotation. The same two-component solution emerged, with nearly identical loading patterns: the first component remained defined by the linear skeletal measures and the second by body mass and the circumferential measures, and palm circumference again cross-loaded. The two components were moderately correlated (r = 0.681), indicating that the linear and mass/girth dimensions, although interpretable as distinct, are related rather than strictly independent. The interpretation was therefore not an artefact of the orthogonal (Varimax) rotation.
3.3. Multivariate differences across weight categories
A one-way MANCOVA was conducted with weight category as the fixed factor, stature as a covariate, and the seven limb and segmental variables (arm length, trunk height, leg length, hand length, sitting height, palm circumference, and calf circumference) as dependent variables. Because Box’s M test indicated heterogeneity of covariance matrices (M = 246.82, F(168, 30073.26) = 1.30, p = 0.005) and group sizes were unequal, Pillai’s trace was used as the primary multivariate criterion, given its robustness under these conditions.
After adjusting for stature, weight category exerted a significant multivariate effect on the combined set of anthropometric variables, Pillai’s trace = 0.942, F(42, 1230) = 5.45, p < 0.001, partial η 2 = 0.157. The covariate, stature, was also a significant multivariate predictor, Pillai’s trace = 0.580, F(7, 200) = 39.40, p < 0.001, partial η 2 = 0.580. These results show that judo athletes in different weight categories differ in their anthropometric measurements beyond what stature alone explains. Univariate follow-up analyses were therefore conducted.
3.4. Stature-adjusted differences (ANCOVA)
Separate ANCOVAs (weight category as factor, stature as covariate) were conducted for each variable, with a Bonferroni-adjusted family-wise threshold of α = 0.05/7 ≈ 0.0071 applied across the seven tests; pairwise comparisons of estimated marginal means used Bonferroni correction. Levene’s test was non-significant for all seven variables entered into this analysis (all p ≥ 0.061), supporting the homogeneity assumption. Results are summarised in Table 3.
Table 3
Stature-adjusted (estimated marginal) means with 95% confidence intervals by weight category, and ANCOVA test statistics
| Variable | ≤60 | −66 | −73 | −81 | −90 | −100 | + 100 | F(6,206) | p | η 2_p |
|---|---|---|---|---|---|---|---|---|---|---|
| Calf circumference | 31.6 [31.0, 32.1] | 33.6 [33.0, 34.3] | 34.9 [34.3, 35.5] | 36.3 [35.8, 36.9] | 37.9 [37.2, 38.6] | 40.2 [39.3, 41.0] | 41.4 [40.5, 42.3] | 58.89 | <0.001 | 0.632 |
| Palm circumference | 20.5 [20.2, 20.8] | 21.3 [21.0, 21.7] | 21.3 [21.0, 21.7] | 21.8 [21.5, 22.1] | 22.5 [22.2, 22.9] | 22.6 [22.1, 23.0] | 23.0 [22.5, 23.4] | 13.75 | <0.001 | 0.286 |
| Trunk height | 59.8 [59.0, 60.5] | 60.8 [59.9, 61.8] | 61.7 [60.9, 62.6] | 64.0 [63.2, 64.8] | 63.5 [62.5, 64.5] | 64.1 [62.9, 65.3] | 63.3 [62.1, 64.4] | 10.03 | <0.001 | 0.226 |
| Arm length | 73.5 [72.6, 74.4] | 74.2 [73.1, 75.2] | 75.4 [74.4, 76.3] | 76.3 [75.4, 77.2] | 77.1 [76.0, 78.2] | 76.4 [75.0, 77.8] | 77.0 [75.6, 78.3] | 4.33 | <0.001 | 0.112 |
| Leg length | 89.7 [88.3, 91.1] | 88.7 [87.1, 90.4] | 91.0 [89.5, 92.5] | 93.0 [91.6, 94.4] | 92.6 [90.8, 94.4] | 92.1 [89.9, 94.2] | 93.9 [91.8, 96.0] | 3.48 | 0.003 | 0.092 |
| Hand length | 18.4 [18.1, 18.6] | 18.7 [18.4, 18.9] | 18.7 [18.5, 19.0] | 18.6 [18.4, 18.9] | 19.0 [18.6, 19.3] | 18.9 [18.6, 19.3] | 18.9 [18.5, 19.2] | 1.65 | 0.135 | 0.046 |
| Sitting height | 88.0 [87.2, 88.7] | 88.1 [87.2, 89.0] | 88.8 [88.0, 89.7] | 89.2 [88.4, 90.0] | 89.8 [88.8, 90.8] | 90.0 [88.8, 91.1] | 89.7 [88.5, 90.8] | 1.79 | 0.103 | 0.049 |
Values are stature-adjusted means [95% confidence interval], in cm, evaluated at stature = 171.26 cm.
Note. η 2_p = partial eta squared. Covariate = stature. Family-wise threshold Bonferroni-adjusted to α ≈ 0.0071 across the seven ANCOVA models; the category effect remained significant for the top five variables and non-significant (n.s.) for hand length and sitting height. Stature was a significant covariate in all models (p ≤ 0.008). Pairwise (Bonferroni-corrected) comparisons among categories are summarised in the text and the full set is available from the corresponding author on request. Chest and abdominal circumference are reported as absolute size differences (Table 1; see text) and are not included here. Effect-size benchmarks (Cohen): η 2_p ≈ 0.01 small, 0.06 medium, 0.14 large.
Source: Author’s contribution.
Stature was a significant covariate in every model (all p ≤ 0.008). After adjustment, a significant effect of weight category remained for calf circumference (F(6, 206) = 58.89, p < 0.001, partial η 2 = 0.632), palm circumference (F = 13.75, p < 0.001, partial η 2 = 0.286), trunk height (F = 10.03, p < 0.001, partial η 2 = 0.226), arm length (F = 4.33, p < 0.001, partial η 2 = 0.112), and leg length (F = 3.48, p = 0.003, partial η 2 = 0.092). In contrast, hand length (F = 1.65, p = 0.135, partial η 2 = 0.046) and sitting height (F = 1.79, p = 0.103, partial η 2 = 0.049) did not differ across categories once stature was controlled.
Two patterns characterised the significant length variables. First, relative arm length and trunk height followed a lighter-versus-heavier gradient that plateaued in the upper categories. For arm length, the ≤60 kg group differed significantly from the four heaviest categories (−81 kg and above) and the −66 kg group from the −90 kg group, with no significant differences among the four heaviest categories. For trunk height, the length variable with the largest effect, the ≤60 kg group differed significantly from all categories from −73 kg upward, and the −66 kg group from all categories from −81 kg upward; again, none of the pairwise comparisons among the four heaviest categories was significant. Second, palm circumference and calf circumference increased progressively across the weight spectrum, calf circumference differing significantly for 19 of the 21 category pairs (the exceptions being −66 versus −73 kg and −100 versus +100 kg). These two measures, although circumferential, are appendicular (calf) and hand (palm) girths that reflect limb and hand musculature rather than trunk adiposity and so represent informative size-adjusted features.
3.5. Absolute girth differences
Chest and abdominal circumference increased monotonically across the weight categories (chest: 85.71 to 115.19 cm; abdominal: 71.11 to 104.70 cm; see Table 1). Because these trunk girths scale primarily with body mass rather than stature and because they violated the homogeneity-of-variance assumption (Levene’s p = 0.016 and p = 0.009, respectively), they were summarised descriptively rather than entered into the stature-adjusted analysis; in a mass-defined category system, differences in trunk girth across categories are expected by definition. They accompany, rather than qualify, the stature-adjusted findings above.
3.6. Sensitivity and robustness analyses
The robustness of the findings was examined in three ways. First, re-running the analyses with the two multivariate outliers excluded (N = 212) produced the same pattern of significant effects: the multivariate weight-category effect remained significant (Pillai’s trace = 0.961, F(42, 1218) = 5.53, p < 0.001, partial η 2 = 0.160), and all univariate effects were unchanged in significance (calf, palm, trunk, arm, and leg length significant; hand length and sitting height non-significant). Second, repeating the PCA with an oblique (Promax) rotation reproduced the two-component solution, with the two components moderately correlated (r = 0.681; Section 3.2). Third, the homogeneity-of-regression-slopes assumption (a non-significant stature by weight-category interaction) held for six of the seven variables (arm length p = 0.215, leg length p = 0.128, hand length p = 0.064, sitting height p = 0.497, palm circumference p = 0.134, calf circumference p = 0.880); for trunk height, the interaction was significant (p = 0.020), so the trunk-height result is interpreted with corresponding caution, noting that this single interaction would not survive Bonferroni correction for the seven tests (α ≈ 0.007) and that the trunk-height effect was large (partial η 2 = 0.22) and monotonic across categories.
4. Discussion
This study described the anthropometric profile of 214 competitive male judo athletes and examined how it varies across the seven senior weight categories. Three main findings emerged. First, the 11 primary anthropometric measurements reduced to two interpretable dimensions (a linear/skeletal-length dimension and a mass/girth dimension), which together accounted for more than three-quarters of the variance. Second, after statistically controlling for stature, weight category exerted a significant multivariate effect on the stature-adjusted anthropometric measurements, indicating that judoka in different categories differ in their stature-adjusted body dimensions and not merely in overall size. Third, these stature-adjusted differences were carried principally by girth and by the trunk and upper-limb segments, and followed a distinctive pattern in which relative limb length increased from the lightest to the middle categories and then showed no further significant increase across the heaviest categories.
The two-dimensional structure recovered here is consistent with the broader kinanthropometric literature, in which human physique is commonly described along a longitudinal (length/linearity) axis and a transverse (mass/breadth) axis, and with multivariate analyses of other combat-sport athletes (Burdukiewicz et al., 2018). The length and girth variables loaded onto different components. This indicates that skeletal length and mass/girth are distinguishable axes of variation, not two facets of a single size dimension. The two axes are related, however, rather than independent: the Promax rotation showed them to be moderately correlated (r = 0.681). This is expected, since taller athletes also tend to carry greater girths. The near-equal variance carried by the two rotated components (39.6% and 37.0%) indicates that neither dimension dominates the morphological description of competitive judoka. A practical corollary is that size-only indices body mass index (BMI), which conflates stature and mass and is a recognised blunt instrument in muscular populations; Nuttall, 2015) would discard a substantial and partly distinct source of variation captured by the length dimension.
The category differences must be interpreted with care. Weight categories are defined by body mass, so differences in mass-dependent measures are expected by construction. The value of the stature-adjusted analysis is that it isolates differences that do not follow trivially from the categorisation. The clearest such difference was for relative trunk height and arm length, which increased from the lightest categories through the middleweight range and then stabilised, with no significant differences among the four heaviest categories. This apparent plateau is consistent with a morphological ceiling, whereby the additional mass distinguishing the heaviest categories is accrued through greater breadth and girth rather than proportionally longer limbs or trunk: heavier judoka in this sample were not longer limbed than middleweights, but broader and heavier.
This interpretation aligns with, and extends, previous descriptions of judo morphology. Franchini and colleagues (2014), comparing all 7 official categories in 104 Brazilian national- and international-level judoka, reported that the heaviest categories are characterised by greater adiposity (sum of skinfolds rising from 44.8 mm at −60 kg to 194.0 mm at +100 kg; endomorphy from 2.3 to 7.2) and a less linear physique (ectomorphy falling from 2.2 to 0.1). Direct numerical comparison indicates both convergence and divergence with that cohort: chest circumference in the present sample increased from 85.7 cm (≤60 kg) to 115.2 cm (+100 kg), closely paralleling the 83.3–117.3 cm range reported by Franchini and colleagues, whereas calf circumference spanned a narrower range here (32.0–40.9 cm) than in the Brazilian sample (33.5–48.5 cm), with the difference concentrated in the heaviest categories. The present data are therefore consistent with the mass/girth gradient underlying those observations, and the current analysis adds a size-adjusted perspective by showing that, once stature is removed, the between-category signal is concentrated in girth and in a small number of segmental measurements rather than being distributed evenly across all linear dimensions. A recent cross-sectional profile of the Brazilian male judo team similarly reported increasing mesomorphy and endomorphy across categories and argued that meaningful cross-category comparison requires size-standardised rather than absolute measures (Lopes et al., 2025), reinforcing the analytical approach adopted here. Because the present battery did not include skinfolds, bone breadths, or somatotype variables, the girth differences cannot be partitioned into muscular and adipose components; the mass/girth dimension should therefore be understood as a gross morphological axis rather than an index of body composition, a boundary that connects this work to the somatotype- and composition-based judo literature (e.g., Claessens et al., 1987; Hamzaoui et al., 2022; Kubo et al., 2006; Roklicer et al., 2020).
From an applied standpoint, the findings are best regarded as descriptive reference data for competitive male judoka rather than as a basis for performance prediction or talent identification. The category-specific norms in Tables 1 and 3 can serve several practical purposes while remaining descriptive. They give a reference against which an individual athlete’s stature-adjusted profile can be compared with that of category peers. They may inform discussions about weight-category placement, particularly for athletes close to a category boundary. Applied over time, they also offer a framework for routine anthropometric monitoring across a training macrocycle (Issurin, 2010) and for tracking the development of younger athletes as they mature and move between categories (Giudicelli et al., 2021). Such applications constitute talent surveillance, the monitoring of athletes already within the competitive pathway, rather than talent identification or selection, a distinction that matters given the limited stand-alone predictive value of anthropometry (Prieske et al., 2020; Ribeiro et al., 2023). The progressive increase in hand and palm dimensions is of potential interest given the central role of gripping (kumi-kata) in judo (Lopes et al., 2025; Sacripanti, 2010), although the present design cannot establish any link with gripping performance and this is raised only as a direction for future work. Because the study includes no measures of technical, physiological, or competitive performance, it does not support inferences about which morphological characteristics are advantageous.
Several limitations should be considered when interpreting these findings. First, the sample comprised competitive judoka of trained-to-international (Tier 2–4) caliber, most of them at national level, recruited against explicit experience and achievement criteria. The results therefore describe this competitive stratum. The heaviest and most highly ranked sub-groups were represented by relatively few athletes. Second, measurements were obtained in-season during the period leading up to competition, so body-mass and girth values may have been influenced by pre-competition weight-management practices, which are prevalent in judo and other weight-category sports and have measurable physiological effects (Artioli et al., 2010; Khodaee et al., 2015; Milovančev et al., 2024); longitudinal or off-season measurement would clarify the stability of these profiles, which are known to change across a training season (Prieske et al., 2020). Third, the design is cross-sectional and includes no measures of body composition, somatotype, or performance, which constrains the depth of morphological interpretation and precludes performance-related conclusions. Fourth, the small heaviest-category samples reduce statistical power for those groups, although the principal effects were large and robust to outlier exclusion. Fifth, the PCA was conducted on the pooled sample and assumed a common covariance structure across categories, which was not tested. The athletes’ considerable training experience (mean 7.2 years) is consistent with sport-specific morphological adaptation, although the cross-sectional design precludes causal attribution. Finally, the sample was male only and drawn from a single national context, which bounds generalisability.
Future research incorporating a full kinanthropometric battery (including skinfolds, bone breadths, and derived body-composition and somatotype variables), together with functional measures such as handgrip strength, and ideally longitudinal and multi-national sampling, would substantially extend the profile developed here and clarify the functional significance of the stature-adjusted differences observed across categories.
5. Conclusion
Among competitive male judo athletes, anthropometric variation is organised along two distinct but related dimensions: skeletal length and mass/girth. Measurements also differ across weight categories beyond what stature alone explains. These stature-adjusted differences are concentrated in girth and in the trunk and upper-limb segments, and are marked by an increase in relative limb length from the lighter to the middle categories that appears to plateau across the heaviest categories, where additional mass is expressed as greater breadth rather than proportionally greater length. These category-specific profiles provide descriptive reference data for competitive judoka, intended to support anthropometric monitoring and contextualisation rather than performance prediction or talent identification.
Funding information
This research received no external funding.
Author contributions
Vineet Mehta led the study and manuscript preparation. Ajit Kumar contributed to manuscript writing and other aspects of the study. Tarun Routhan assisted with data collection and reviewed the manuscript. Dhananjoy Shaw and Deepika Malhotra reviewed and edited the manuscript. All authors read and approved the final manuscript.
Conflict of interest statement
The authors declare no conflict of interest.
Data availability statement
The data supporting the findings of this study are available from the corresponding author upon reasonable request.
Ethical approval
The study was approved by the Ethics Committee of Shaheed Bhagat Singh Evening College, New Delhi, India and conducted in accordance with the Declaration of Helsinki. Consent was obtained from all participants prior to data collection, in accordance with the approved study protocol.