
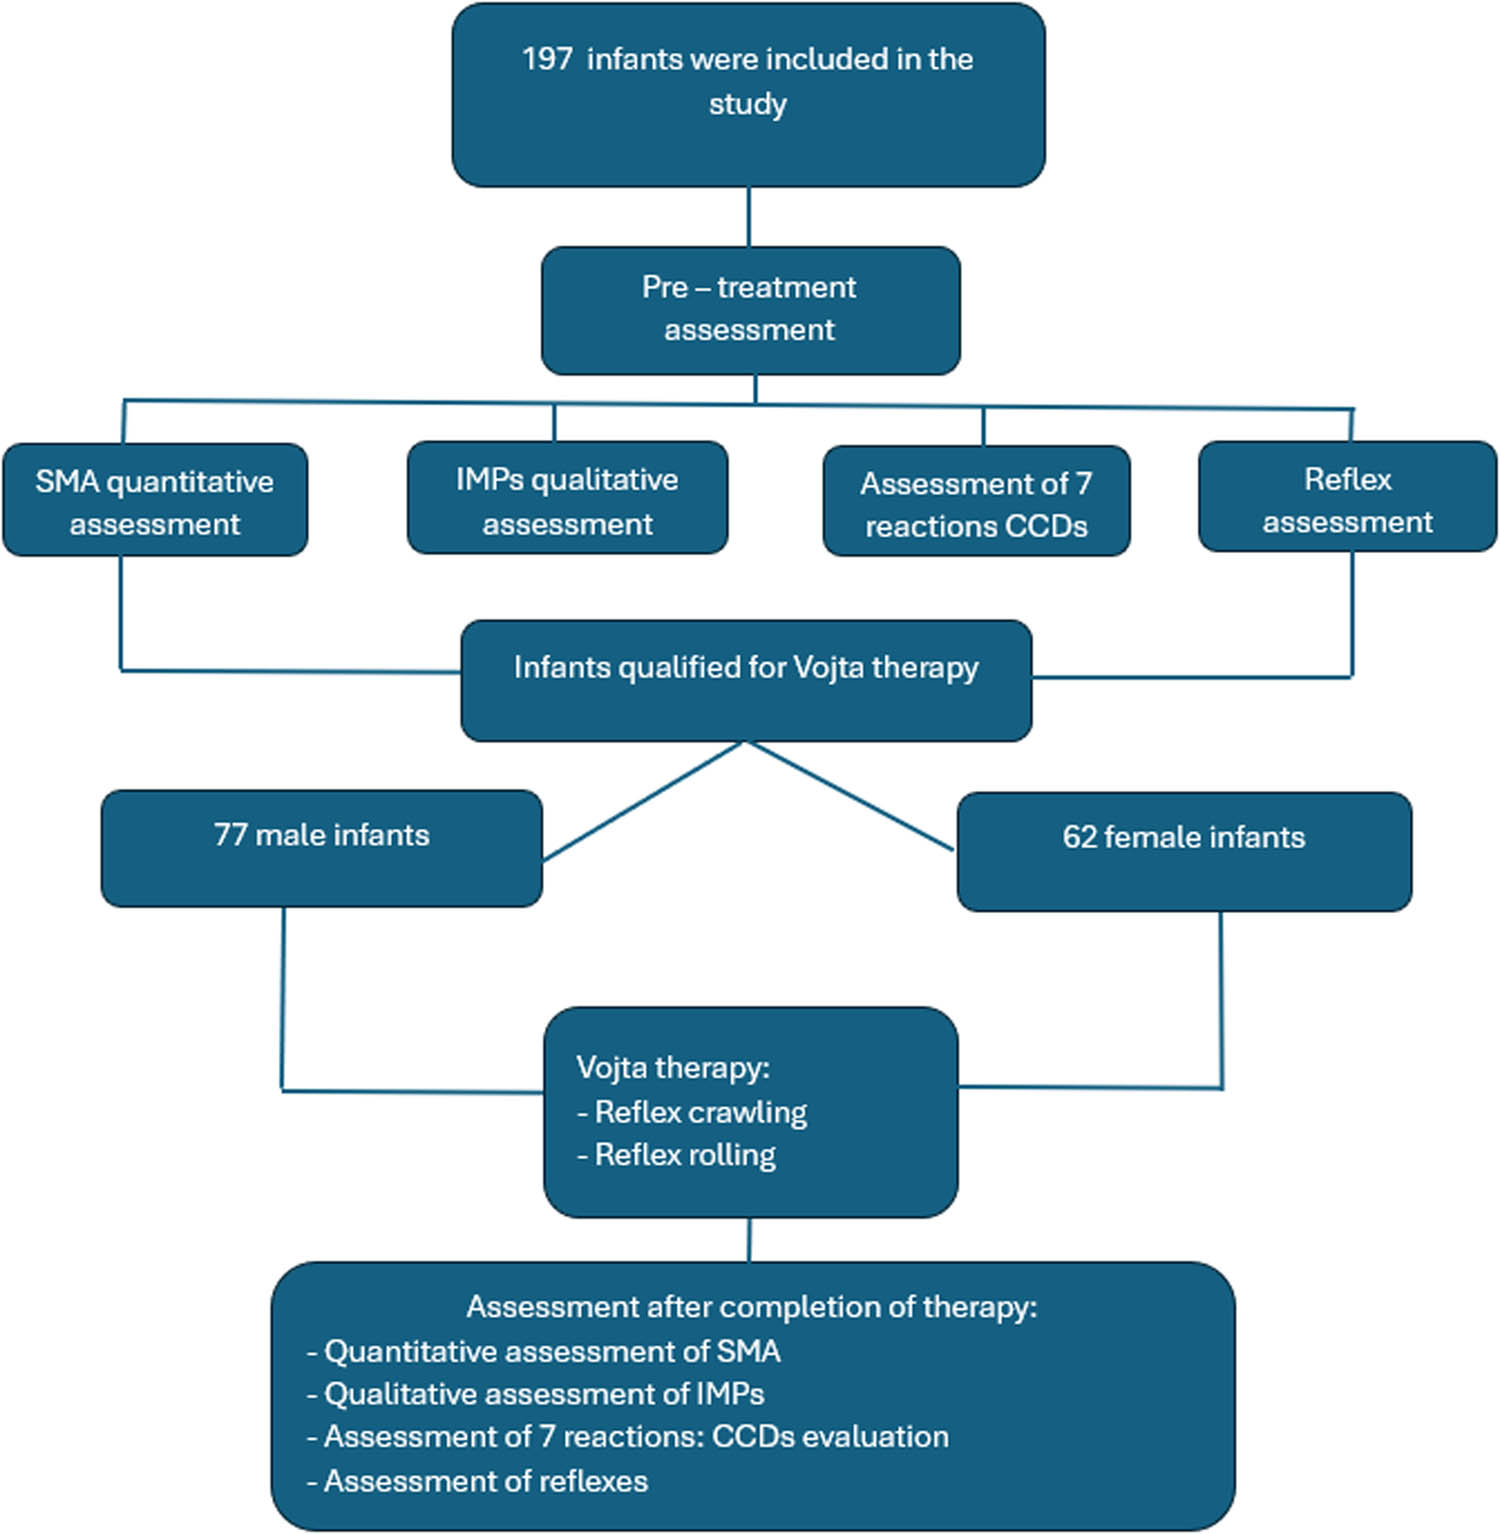
Figure 1
Flow diagram of the research protocol
Source: Authors’ contribution.
Table 1
Characteristics of the studied male and female infants
| Variable | Male N = 107 | Female N = 90 | t | p | ||||||
|---|---|---|---|---|---|---|---|---|---|---|
| Mean value | SD | Min | Max | Mean value | SD | Min | Max | |||
| Gestational age (weeks) | 37.53 | 3.5 | 24 | 42 | 38.4 | 2.7 | 26 | 42 | −1.92 | 0.055 |
| Birth weight (g) | 3118.5 | 859.2 | 666 | 4900 | 3078.4 | 783.2 | 660 | 4450 | 0.34 | 0.734 |
| Apgar score* (points) | 8.86 | 2.0 | 1 | 10 | 9.29 | 1.43 | 2 | 10 | −1.70 | 0.091 |
| Age (months) | 4.15 | 2.2 | 1 | 16 | 3.84 | 2.1 | 1 | 11 | 0.99 | 0.324 |
Notes: *- at 1 min of life.
Source: Authors’ contribution.
Table 2
Changes in CCD, SMA, and IMP scores in infants who completed Vojta therapy
| Score | Male (n = 77) | Female (n = 62) | ||||||||||
|---|---|---|---|---|---|---|---|---|---|---|---|---|
| Before | After | Difference | Before | After | Difference | |||||||
| Mean value | SD | Mean value | SD | t | p | Mean value | SD | Mean value | SD | t | p | |
| CCD (points) | 4.78 | 2.09 | 2.23 | 2.39 | 7.04 | <0.001 | 4.66 | 2.22 | 1.77 | 2.31 | 7.09 | <0.001 |
| SMA (months) | 3.16 | 1.81 | 6.55 | 2.22 | 10.40 | <0.001 | 2.60 | 2.01 | 6.48 | 1.92 | 11.01 | <0.001 |
| IMPs (months) | 1.64 | 1.93 | 5.58 | 2.56 | 10.81 | <0.001 | 1.23 | 1.89 | 5.72 | 2.27 | 11.96 | <0.001 |
Notes: CCDs - central coordination disorders; SMA - spontaneous motor activity; IMPs - ideal movement patterns.
Source: Authors’ contribution.
Table 3
Frequency of postural reactions before and after Vojta therapy in infants who completed therapy
| Test | Male (n = 77) | Female (n = 62) | Total (n = 139) | |
|---|---|---|---|---|
| Pull-to-sit (traction response) | Before | 22.1 (17) | 32.3 (20) | 26.6 (37) |
| After | 64.9 (50) | 80.6 (50) | 71.9 (100) | |
| p (difference) | <0.001 | <0.001 | <0.001 | |
| Landau reaction | Before | 24.7 (19) | 22.6 (14) | 23.7 (33) |
| After | 72.7 (56) | 79.0 (49) | 75.5 (105) | |
| p (difference) | <0.001 | <0.001 | <0.001 | |
| Axillary suspension test | Before | 29.9 (23) | 30.6 (19) | 30.2 (42) |
| After | 58.4 (45) | 61.3 (38) | 59.7 (83) | |
| p (difference) | <0.001 | 0.001 | <0.001 | |
| Vojta reaction | Before | 29.9 (23) | 38.7 (24) | 33.8 (47) |
| After | 74.0 (57) | 72.6 (45) | 73.4 (102) | |
| p (difference) | <0.001 | <0.001 | <0.001 | |
| Collis horizontal suspension test | Before | 50.6 (39) | 37.1 (23) | 44.6 (62) |
| After | 71.4 (55) | 74.2 (46) | 72.7 (101) | |
| p (difference) | 0.012 | <0.001 | <0.001 | |
| Peiper–Isbert suspension test | Before | 27.3 (21) | 35.5 (22) | 30.9 (43) |
| After | 62.3 (48) | 75.8 (47) | 68.3 (95) | |
| p (difference) | <0.001 | <0.001 | <0.001 | |
| Collis vertical suspension test | Before | 37.7 (29) | 37.1 (23) | 37.4 (52) |
| After | 72.7 (56) | 79.0 (49) | 75.5 (105) | |
| p (difference) | <0.001 | <0.001 | <0.001 | |
Notes: values are presented as percentages; numbers of infants are given in parentheses.
Source: Authors’ contribution.
Table 4
Changes in SMA and IMP scores after Vojta therapy in male infants who completed therapy, according to the type of delivery
| Score | Vaginal delivery (n = 16) | Cesarean section (n = 24) | ||||||||||
|---|---|---|---|---|---|---|---|---|---|---|---|---|
| Before | After | Difference | Before | After | Difference | |||||||
| Mean value | SD | Mean value | SD | t | p | Mean value | SD | Mean value | SD | t | p | |
| SMA (months) | 3.84 | 2.23 | 7.38 | 2.00 | 4.72 | <0.001 | 2.84 | 1.88 | 6.25 | 2.45 | 5.25 | <0.001 |
| IMPs (months) | 2.41 | 1.89 | 5.91 | 2.19 | 4.84 | <0.001 | 1.42 | 1.89 | 5.40 | 2.61 | 6.06 | <0.001 |
Notes: SMA - spontaneous motor activity; IMPs - ideal movement patterns.
Source: Authors’ contribution.
Table 5
Changes in SMA and IMP scores after Vojta therapy in female infants who completed therapy, according to the type of delivery
| Score | Vaginal delivery (n = 13) | Cesarean section (n = 17) | ||||||||||
|---|---|---|---|---|---|---|---|---|---|---|---|---|
| Before | After | Difference | Before | After | Difference | |||||||
| Mean value | SD | Mean value | SD | t | p | Mean value | SD | Mean value | SD | t | p | |
| SMA (months) | 2.73 | 2.15 | 7.15 | 2.00 | 5.44 | <0.001 | 2.65 | 2.12 | 6.06 | 2.22 | 4.58 | <0.001 |
| IMPs (months) | 1.38 | 1.89 | 6.46 | 1.98 | 6.67 | <0.001 | 1.24 | 1.95 | 4.88 | 2.69 | 4.52 | <0.001 |
Notes: SMA - spontaneous motor activity; IMPs - ideal movement patterns.
Source: Authors’ contribution.
Table 6
CCD scores in male and female infants who completed Vojta therapy, according to the type of delivery
| Type of delivery | Male | Female | Differences | |||||
|---|---|---|---|---|---|---|---|---|
| n | Mean value | SD | n | Mean value | SD | t | p | |
| Vaginal | 16 | 2.01 | 2.34 | 13 | 1.77 | 2.17 | 0.27 | ns |
| Cesarean section | 24 | 2.38 | 2.50 | 17 | 2.35 | 2.91 | 0.03 | ns |
| t (p) | ns | ns | ||||||
Source: Authors’ contribution.
Table 7
Prevalence of the palmar grasp reflex, Moro reflex, and postural asymmetry in infants before and after completion of Vojta therapy
| Feature | Male (n = 77) | Female (n = 62) | Total (n = 139) | |
|---|---|---|---|---|
| Palmar grasp reflex | Before | 46.8 (36) | 50.0 (31) | 48.2 (67) |
| After | 6.5 (5) | 1.6 (1) | 4.3 (6) | |
| p (difference) | <0.001 | <0.001 | <0.001 | |
| Moro reflex | Before | 18.2 (14) | 19.4 (12) | 18.7 (26) |
| After | 0.0 (0) | 0.0 (0) | 0.0 (0) | |
| p (difference) | <0.001 | <0.001 | <0.001 | |
| Postural asymmetry | Before | 87.0 (67) | 83.9 (52) | 85.6 (119) |
| After | 32.5 (25) | 21.0 (13) | 27.3 (38) | |
| p (difference) | <0.001 | <0.001 | <0.001 | |
Notes: values are presented as percentages; numbers of infants are given in parentheses.
Source: Authors’ contribution.