
1. Introduction
One-week training camps were simultaneously held in five locations (Gravelines, Mâcon, Léry-Poses, Mimizan, and Vaires-sur-Marne), where, in addition to French and German athletes, rowers from a third country – Serbia, the Czech Republic, Italy, the United Kingdom, and Hungary – could also participate at each venue, allowing 48 rowers per camp to train and demonstrate their abilities. The final competitions for the 240 young athletes were held in Vaires-sur-Marne, where multinational teams competed, providing participants with a unique experience and valuable insights. Besides its various benefits, the project also aligned with national selection programs, as participants’ performances were assessed through motor tests in addition to competitions. Successful selection for rowing is an exceptionally complex process, as performance is primarily influenced by the optimal use of equipment. Furthermore, unlike many other sports, rowing is performed in a seated position (Mäestu et al., 2005). As early as 1978, Žeželj emphasized the challenges of selecting talented rowers due to their continuous interaction with the boat and the difficulty of objectively tracking individual progress in a sport influenced by ever-changing environmental conditions. Despite the growing body of literature on rowing performance, the identification of talented youth rowers remains a challenging and methodologically sensitive process. This difficulty is particularly pronounced during early stages of athlete development, when biological maturation, training background, and physical characteristics interact dynamically, and when selection decisions are often based on limited or fragmented performance indicators. Consequently, there is a clear need for evidence-based approaches that better capture the multidimensional nature of rowing performance in adolescent athletes.
Specific physical attributes are required for effective equipment use, and several predictive models have estimated rowing performance based on anthropometric variables such as height, arm span, body surface area, and sitting height (r = 0.82) (Alföldi et al., 2020). Favorable anthropometric profiles, including body height (BH), sitting height, and arm span, should undoubtedly be considered essential criteria in sports selection. At the same time, the talent identification process must also account for cardiorespiratory characteristics and physiological adaptations to exertion. Previous studies have shown that maximal oxygen uptake and aerobic capacity are also strong predictors of rowing performance, even in young or developing rowers (Cerasola et al., 2020; Durkalec-Michalski et al., 2019). Although previous studies have identified several anthropometric and physiological predictors of rowing performance, findings remain inconsistent regarding their relative importance in youth populations. In particular, limited attention has been given to the combined examination of somatic characteristics and motor performance across different nations and between sexes within the same age group. As a result, it remains unclear whether commonly applied selection criteria adequately reflect the performance-relevant characteristics of developing rowers in an international youth context.
Given the extreme workload performed in a seated position, optimal performance of the cardiovascular system, particularly in terms of effective venous return, is crucial. The examination of metabolic processes, cardiorespiratory function, and force generation suggests that training should replicate on-water rowing conditions as closely as possible to ensure optimal performance (Secher, 1983). Biomechanical analyses further demonstrated that rowing performance strongly depends on the distribution of power between legs, trunk, and arms, as well as on technical factors such as stroke rate (Hofmijster et al., 2007; Kleshnev, 2002). Rather than treating these determinants as isolated contributors, contemporary talent identification increasingly emphasizes integrated performance profiles reflecting the combined influence of anthropometric characteristics, motor abilities, and physiological capacity. From this perspective, rowing performance in youth athletes should be interpreted as the outcome of interacting factors rather than the effect of any single physical or functional variable.
Although rowing is primarily considered an endurance sport, performance is not determined solely by aerobic capacity. A 2,000-m race involves a substantial anaerobic contribution (approximately 20–30%), particularly during the start and finishing phases, where rapid force production and high power output are required (De Campos Mello et al., 2009; Smith & Hopkins, 2012). Therefore, in addition to aerobic indicators, short-duration ergometer tests and measures of explosive lower-limb strength may provide relevant information on performance-related characteristics in youth rowers. These variables reflect high-intensity and start-related components of rowing performance and complement endurance-based assessments within a multidimensional performance model (Cosgrove et al., 1999).
The selection process must also consider motor skills, along with mental and psychological traits, motivation, and social competencies. Moreover, research on adolescent and junior rowers highlighted that explosive strength, jump performance, and anaerobic power contribute significantly to ergometer results, which are often used as a proxy for on-water performance (Giroux et al., 2017; Maciejewski et al., 2019). Several test batteries exist for selecting adolescent rowers, reflecting the physical characteristics of elite rowers. These anthropometric, physiological, and motor test results provide valuable feedback for coaches and athletes regarding abilities and development, aiding in performance prediction. For example, Lawton et al. (2011) emphasized the importance of systematic strength testing, while Smith & Hopkins (2012) described standardized ergometer-based assessments that remain widely used for selection and monitoring purposes.
Simple yet informative tests include the validated shuttle run test for estimating relative aerobic capacity (ErVO2max), standing triple jump (SLJ), and standing triple jump (STJ). The rowing ergometer start test determines maximum power output (W max) in watts, while the 100-meter sprint test assesses average power (W mean) in watts. Comparing these various measurements provides valuable insights into individual performance, as relative aerobic capacity (ErVO2max) has been shown to correlate significantly with rowing performance (Russell et al., 1998). Based on the existing literature and the characteristics of youth rowing, it was hypothesized that boys would outperform girls in power- and strength-related variables. It was further expected that differences between nations within the same sex would be limited. Finally, it was hypothesized that motor performance indicators reflecting explosive lower-limb strength would show stronger associations with rowing ergometer performance than estimated aerobic capacity in this age group. The aim of this study was to examine differences and associations in anthropometric characteristics and motor performance among youth rowers according to gender and nationality. The results from each country may provide insights into the key factors emphasized during the selection process, as well as shed light on gender-related differences observed within the age group. From a practical perspective, a clearer understanding of the relationships between somatic characteristics and motor performance may support coaches and sport organizations in refining youth selection processes. Identifying performance-relevant profiles rather than relying on isolated test results may contribute to more informed decision-making in talent identification and help optimize long-term athlete development strategies in competitive rowing.
2. Material and methods
2.1. Participants
The study sample consisted of rowers participating in the “Ramons vers les Jeux” project. Of the 240 young athletes attending the training camps, those with incomplete or inadequate data were excluded, resulting in a final sample of 190 athletes (N = 190), including 94 boys (Nₘ = 94) with an average age of 14.24 ± 0.38 years and 96 girls (N w = 96) with an average age of 14.47 ± 0.26 years. The sample included competitors from six nations: Germany (N G = 61), including girls (GERw = 31) and boys (GERm = 30); France (N F = 65), (FRAw = 33), (FRAm = 32); Serbia (N S = 16), (SRBw = 8), (SRBm = 8); Czech Republic (N C = 16), (CZEw = 8), (CZEm = 8); Italy (N I = 16), (ITAw = 8), (ITAm = 8); and Hungary (N H = 16), (HUNw = 8), (HUNm = 8). All participants were actively competing youth rowers involved in national or regional development programs at the time of testing. Measurements were conducted during an international training camp under standardized conditions.
Data collection was carried out in full accordance with the ethical principles of the Declaration of Helsinki. Participants and their legal guardians were fully informed about the study, and written consent was obtained for participation. The investigation was conducted on a voluntary basis, with the cooperation of the relevant sports clubs and national rowing federations. All necessary ethical and procedural requirements were fulfilled. The study was conducted in line with the guidelines and regulations of the Science Council, Scientific and Research Ethics Committee (IV/3067-3/2021/EKU), Hungary, and in accordance with the Declaration of Helsinki.
2.2. Anthropometric measurements
Anthropometric measurements included BH and body weight (BW). BH was measured to the nearest 0.1 cm using a certified Sieber-Hegner measuring instrument, and BW was recorded to the nearest 0.1 kg using certified measuring instruments, with participants wearing light sports clothing and no shoes. The methodology was based on the recommendations of the International Biological Program (Weiner & Lourie, 1969). Body mass index (BMI) was calculated using the standard Quetelet formula (kg m−2). All measurements were conducted according to standardized anthropometric procedures.
2.3. Performance-related tests
Performance outputs were measured in watts (W) using a certified Concept 2D-model rowing ergometer, a widely used and validated tool for assessing rowing performance in both research and training settings (Smith & Hopkins, 2012). Maximum power (W max) was determined during a start test based on the highest power output recorded over the first five maximal strokes, reflecting start-related peak power. Average power (W mean) was measured during a 100-m sprint test, representing short-duration high-intensity performance. Prior to testing, all participants completed a standardized warm-up consisting of a general warm-up, followed by 6 min of ergometer practice and 6 min of stretching. The tests were conducted sequentially under standardized conditions, with standardized recovery periods between trials to minimize fatigue effects (minimum 5 min). The tests were performed under standardized conditions.
2.4. Fitness assessment (ErVO2max)
Estimated relative aerobic capacity (ErVO2max) was calculated based on shuttle run test results, taking age, gender, BW, and fitness level into account using Léger and Lambert (1982) empirical formula: ErVO2max (mL/kg/min) = (5.857 × final completed running speed (km/h)) – 19.458.
2.5. Explosive strength assessment
Explosive lower-limb strength was assessed using the standing triple jump (SLJ). Participants initiated the movement from a standing position, alternating their take-off foot and landing with both feet together. After two practice attempts and a 2-min rest period, each participant performed three trials, with the longest distance recorded to the nearest centimeter.
2.6. Statistical analysis
Statistical analyses were performed using Statistica for Windows (version 13.2). The normality of data distribution was assessed using the Shapiro–Wilk test, while homogeneity of variances was evaluated with Levene’s test. The level of statistical significance was set at p < 0.05 for all analyses. Differences between national groups were examined separately for boys and girls using one-way analysis of variance (ANOVA). Separate one-way ANOVAs were applied because the primary aim of the study was to examine individual performance and anthropometric variables independently across national groups and genders. Effect sizes were calculated using partial eta squared (η 2 p). Effect sizes were reported to support the practical relevance of the findings and to provide information on the adequacy of the sample size. Differences between boys and girls within the same nationality were analyzed using independent samples t-tests. Relationships between anthropometric variables, motor performance tests, and rowing ergometer performance were examined using Pearson’s correlation analysis. Effect sizes for partial eta squared (η 2 p) were interpreted according to conventional thresholds as small (0.01), medium (0.06), and large (0.14). Correlation coefficients were interpreted as weak (<0.30), moderate (0.30–0.69), and strong (≥0.70).
3. Results
The results of the girls’ national groups are presented in Table 1. Based on the data, the mean values of anthropometric parameters (BH, BW, and BMI) do not show significant differences (p > 0.05).
Table 1
Mean values and standard deviations of anthropometric and performance results of girls by nationality
| GER | FRA | SRB | CZE | ITA | HUN | F | p | η 2 p | |
|---|---|---|---|---|---|---|---|---|---|
| BH (cm) | 167.03 ± 5.31 | 166.44 ± 5.73 | 168.50 ± 9.33 | 172.25 ± 3.06 | 165.50 ± 3.46 | 170.38 ± 5.15 | 1.05 | 0.39 | 0.055 |
| BW (kg) | 57.70 ± 6.44 | 58.57 ± 7.50 | 65.03 ± 8.04 | 61.25 ± 3.11 | 56.75 ± 3.41 | 58.38 ± 5.90 | 1.32 | 0.27 | 0.068 |
| BMI | 20.64 ± 1.62 | 21.17 ± 2.71 | 23.04 ± 3.65 | 20.65 ± 0.98 | 20.72 ± 1.13 | 20.12 ± 1.97 | 0.88 | 0.51 | 0.047 |
| SLJ (cm) | 551.19 ± 69.04 | 553.24 ± 65.88 | 541.88 ± 52.91 | 621.13 ± 43.18 | 600 ± 66.55 | 603.75 ± 68.39 | 1.71 | 0.14 | 0.087 |
| W max (W) | 351.10 ± 77.77 | 356.52 ± 46.81 | 383.13 ± 58.30 | 398.25 ± 41.14 | 398.38 ± 56.15 | 380 ± 55.86 | 1.56 | 0.18 | 0.079 |
| W mean (W) | 322.35 ± 71.46 | 308.76 ± 39.56 | 326.50 ± 50.76 | 349.88 ± 42.04 | 356.25 ± 46.41 | 333.50 ± 42.91 | 1.21 | 0.31 | 0.063 |
| ErVO2max (mL × kg−1 × min−1) | 39.25 ± 4.35 | 39.42 ± 4.99 | 38.83 ± 2.30 | 39.71 ± 4.45 | 37.13 ± 5.23 | 44.36 ± 5.60 | 0.82 | 0.54 | 0.043 |
BH = body height (cm), BW = body weight (kg), BMI = body mass index, SLJ = standing triple jump (cm), W max = maximal power (W), W mean = 100 m average power (W), ErRVO2max = estimated relative aerob capacity (mL × kg−1 × min−1).
Source: Authors’ contribution.
The average results of maximum power (W max; W) and sprint test (W mean; W) for the girls’ groups indicate that the Italian (ITAw) rowers (W max = 398.37 ± 56.15; W mean = 356.25 ± 46.41) and the Czech (CZEw) rowers (W max = 398.25 ± 41.13; W mean = 349.87 ± 42.03) achieved the highest mean values among the girls’ groups.
However, when analyzing the results of the different national girls’ groups, no significant differences were found in sprint test (W mean), maximum power (W max), standing triple jump (SLJ; cm), or estimated relative aerobic capacity (ErVO2max; mL kg−1 min−1) (p > 0.05).
The results of the boys’ national groups are presented in Table 2.
Table 2
Mean values and standard deviations of anthropometric and performance results of boys by nationality
| GER | FRA | SRB | CZE | ITA | HUN | F | p | η 2 p | |
|---|---|---|---|---|---|---|---|---|---|
| BH (cm) | 175.68 ± 8.02 | 173.75 ± 6.68 | 183.75 ± 5.11 | 172.38 ± 6.50 | 177.63 ± 4.37 | 175.63 ± 7.54 | 3.04 | 0.014 | 0.146 |
| BW (kg) | 65.88 ± 10.77 | 63.99 ± 9.25 | 69.94 ± 5.96 | 69.38 ± 5.01 | 67.25 ± 6.80 | 65.75 ± 11.94 | 1.09 | 0.41 | 0.054 |
| BMI | 21.27 ± 2.37 | 21.15 ± 2.44 | 20.71 ± 1.56 | 23.41 ± 2.23 | 21.31 ± 1.95 | 21.24 ± 3.04 | 1.12 | 0.32 | 0.064 |
| SLJ (cm) | 673.30 ± 69.51 | 718.22 ± 77.74 | 710.63 ± 80.82 | 710.25 ± 76.01 | 742,.50 ± 53.39 | 699.63 ± 89.51 | 1.88 | 0.09 | 0.097 |
| W max (W) | 531.90 ± 127.4 | 565.81 ± 108.6 | 618.38 ± 78.43 | 537.38 ± 75.85 | 560.13 ± 83.97 | 544.13 ± 118.64 | 1.27 | 0.27 | 0.069 |
| W mean (W) | 463.03 ± 104.9 | 485.69 ± 109.8 | 535.25 ± 79.85 | 488.88 ± 67.60 | 502.00 ± 81.19 | 455.63 ± 96.35 | 1.12 | 0.35 | 0.059 |
| ErVO2max (mL × kg−1 × min−1) | 45.98 ± 4.73 | 48.35 ± 5.6 | 45.13 ± 4.19 | 43.68 ± 4.35 | 46.73 ± 5.06 | 46.44 ± 6.36 | 1.39 | 0.23 | 0.074 |
BH = body height (cm), BW = body weight (kg), BMI = body mass index, SLJ = standing triple jump (cm), W max = maximal power (W), W mean = 100 m average power (W), ErRVO2max = estimated relative aerob capacity (mL × kg−1 × min−1).
Source: Authors’ contribution.
Examining BH (cm) across the boys’ groups, the Serbian rowers (SRBm) demonstrated the highest average stature (183.75 ± 5.11 cm). In line with this observation, a statistically significant difference with a large effect size was identified between national groups for BH (η 2 p = 0.146). Regarding BW and BMI, although some differences in mean values were observed between countries, these variations did not reach statistical significance.
In terms of standing triple jump performance (SLJ; cm), the Italian boys (ITAm) achieved the highest average jump distance (742.50 ± 53.39 cm), followed by the French boys (FRAm) (718.22 ± 77.74 cm). Despite these descriptive differences, no statistically significant differences were observed between national groups. Similarly, no statistically significant differences were found between boys’ national groups in maximum power output (W
max; W), sprint test performance (W
mean; W), or estimated relative aerobic capacity (ErVO2max; mL kg−1 min−1), although noticeable variation in mean values was present across countries.
The start test (W max; W) results indicate that the Italian girls (ITAw) (398.37 ± 56.15 W) and the Czech girls (CZEw) (398.25 ± 41.13 W) achieved the highest average performances, with nearly identical results (Figure 1). Across all groups, the Serbian boys (SRBm) had the highest average W max (618.38 ± 78.42 W), followed by the French boys (FRAm) (W max = 565.81 ± 108.58 W). In the maximum power test (W max), boys demonstrated significantly higher average values than girls within the same nationality across all countries, with the exception of the Czech groups, where no significant gender difference was observed (p < 0.05).
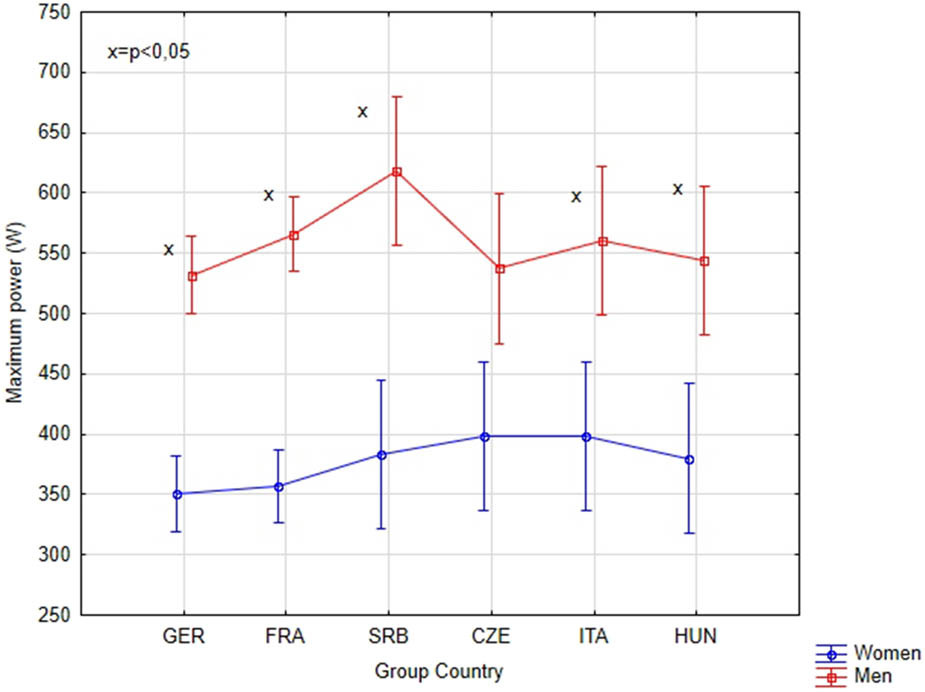
Figure 1
Maximum power (W max; W) results on the rowing ergometer by gender and nation. x = The average result of same nationality but different gender groups is significant (GER; p = 0.000, FRA; p = 0.000, SRB; p = 0.000, ITA; p = 0.013, HUN; p = 0.011); the Czech (CZE) boys’ and girls’ groups did not show a significant difference (p > 0.05)
Source: Authors’ contribution.
When examining sprint test performance (Figure 2.), expressed as average power (W mean; mean ± SD; W), the Italian (ITAw; 356.25 ± 46.41 W), and Czech girls (CZEw; 349.87 ± 42.03 W) achieved the highest mean values among the girls’ groups, similarly to the start test. Among all groups, Serbian boys (SRBm; 535.25 ± 79.84 W) demonstrated the highest average W mean, followed by Italian boys (ITAm; 502.00 ± 81.19 W).
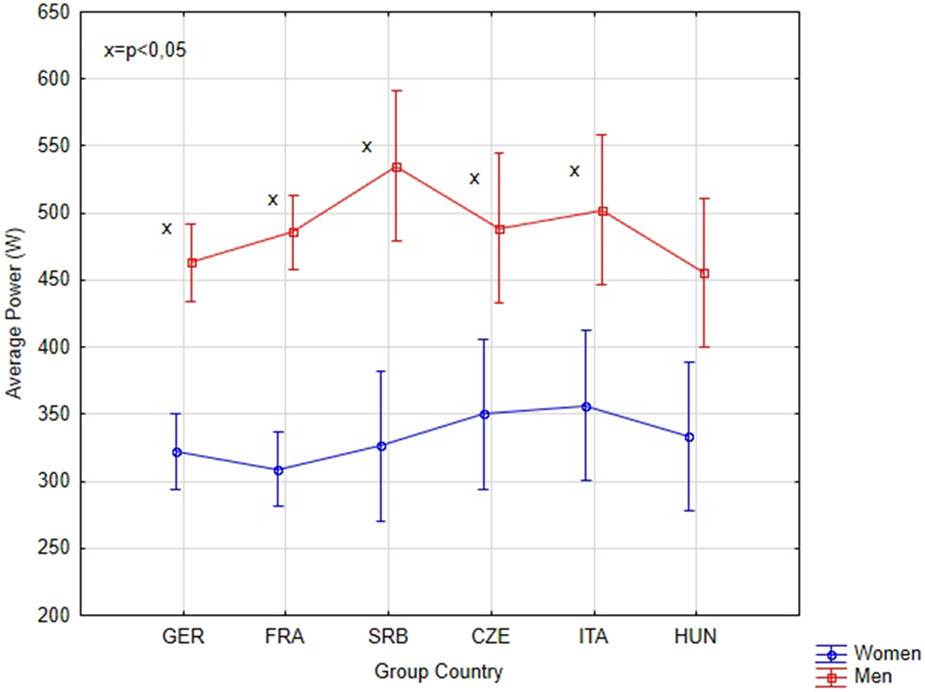
Figure 2
Average power (W mean; W) results on the rowing ergometer by gender and nation. x = The average result of same nationality but different gender groups is significant (GER; p = 0.000, FRA; p = 0.000, SRB; p = 0.000, CZE; p = 0.026, ITA; p = 0.015); the HUN boys’ and girls’ group results are not significant (p > 0.05)
Source: Authors’ contribution.
For sprint test performance (W mean), boys demonstrated significantly higher average values than girls within the same nationality across all countries, with the exception of the Hungarian groups, where no significant gender difference was observed (p < 0.05).
The relationship between standing triple jump (SLJ) and both performance tests [maximum power (W max) and sprint test (W mean)] was found to be significant (Figure 3). In contrast, the estimated relative aerobic capacity (ErVO2max) did not show a valid correlation with performance in either gender (p > 0.05).
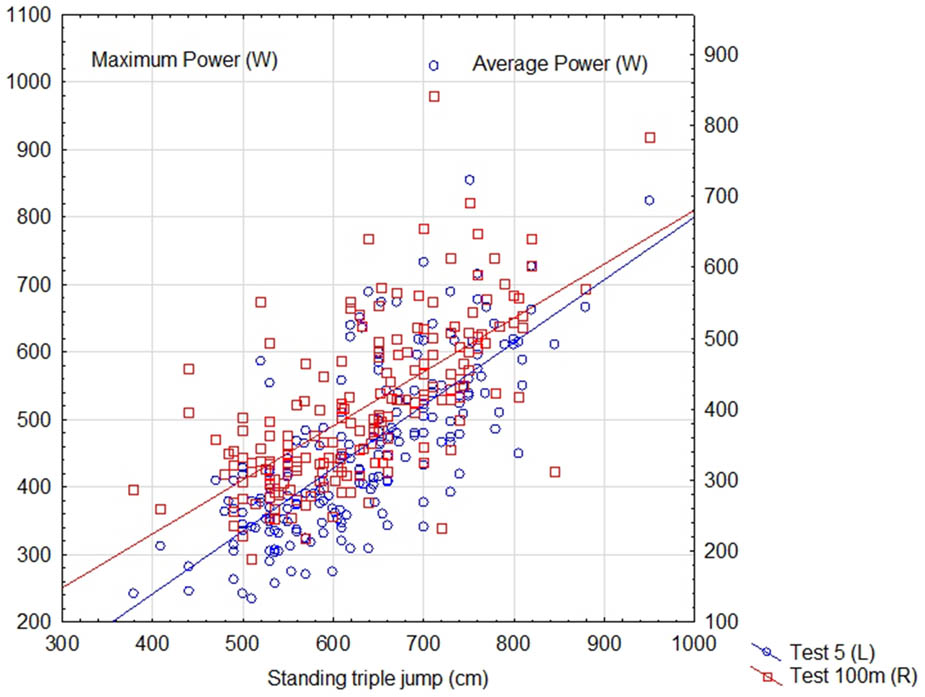
Figure 3
Relationship between standing triple jump (SLJ; cm) and performance on the rowing ergometer for maximum power (W max; W) and sprint test (W mean; W) (unisex sample). The horizontal axis (x) represents the relationship between standing triple jump (SLJ) [(300–1,000); (cm)] and performance, while the left vertical axis (y) displays maximum power (W max; W), and the right vertical axis (y) shows sprint test (W mean; W). [Standing Triple Jump (cm) vs. Maximum Power (W max; W): r = 0.5186; p = 0.000]; [Standing Triple Jump (cm) vs. Sprint Test (W mean; W): r = 0.4467; p = 0.000]
Source: Authors’ contribution.
The scatter plot displaying the results shows a considerable range of variation, with data points distributed nearly evenly above and below the two trendlines. The two performance test trendlines run almost parallel up to 650 cm, then gradually converge, with the smallest difference appearing at 950 cm. The relationship between the two performance indicators and standing triple jump is significant [(rW max = 0.5186, p = 0.000; rW mean = 0.4467, p = 0.000)]. In terms of correlation strength, it can be considered moderate, while the calculated shared variance is only 26% and 20%, which is not statistically or biomechanically significant. When analyzing the results for both genders together, it was determined that BH had a weaker correlation with performance [(rW max = 0.50638; p = 0.001); (rW mean = 0.42392; p = 0.001)] compared to the standing triple jump (SLJ). However, the relationship between BW and performance was stronger [(rW max = 0.6437; p = 0.000); (rW mean = 0.56193; p = 0.000)]. The correlation between these variables was also significant, although moderate. The strongest correlation was observed between maximum power (W max) and sprint test (W mean) [(r = 0.8523; p = 0.000)], indicating a high degree of association, with a computed shared determination coefficient approaching 75%, which is considered substantial, all of this indicates the combined reliability of the indicators.
4. Discussion
Our study established that boys performed significantly better than girls in most of the examined motor and physiological parameters, including maximum power (W max), average power (W mean), and standing triple jump (SLJ). However, no statistically significant differences were observed between same-gender groups of different nationalities in terms of SLJ, power tests (W max, W mean), or estimated relative aerobic capacity (ErVO2max). This finding may reflect similarities in performance profiles across the participating national groups; however, training methodologies and selection systems were not directly assessed in the present study.
The standing triple jump (SLJ) showed a strong relationship with performance indicators, as greater jump distances were associated with increased maximum and average power (W max, W mean). This confirms previous findings that lower limb explosive strength is a key component of rowing performance (Maciejewski et al., 2019; Majumdar et al., 2017). However, estimated relative aerobic capacity (ErVO2max) did not show a significant correlation with performance, which contradicts some earlier studies that identified maximum oxygen consumption (VO2max) as a key predictor of rowing performance (Cosgrove et al., 1999). This discrepancy may be due to the anaerobic dominance of the tested sprint and start tests, making aerobic capacity less influential on measured performance outcomes.
Across all groups, a clear trend was observed: higher standing triple jump (SLJ) values were associated with increasing maximum (W max) and average power (W mean). This relationship supports previous research, which found that a significant portion of the force exerted in rowing originates from the legs (46.4 ± 4.5%), followed by the trunk (30.9 ± 5.2%) and arms (22.7 ± 5.2%) (Kleshnev, 2002). As a result, lower limb dynamic strength and endurance are strongly linked to rowing performance (Maciejewski et al., 2019; Majumdar et al., 2017).
On the other hand, estimated relative aerobic capacity (ErVO2max) did not show a significant relationship with performance indicators, which may contradict some earlier studies that identified VO2max as the primary predictor of rowing performance (Alföldi et al., 2020; Cosgrove et al., 1999). This discrepancy may be explained by the fact that the sprint and start tests in our study were primarily anaerobic, making aerobic capacity less relevant to the observed results.
BH and weight were significantly correlated with performance, supporting previous research findings that rowers with greater body size generally achieve better results (Mikulić, 2008; Yoshiga & Higuchi, 2003). The relationship was evident in both boys’ and girls’ groups, indicating that favorable anthropometric characteristics already provide a significant advantage at a young age. These findings align with previous studies showing that the importance of favorable anthropometric traits manifests early, making them critical factors for predicting long-term performance (Durkalec-Michalski et al., 2019).
Among adult rowers, body size and proportions (Majumdar et al., 2017; Mikulić & Ružić, 2008; Penichet-Tomás et al., 2019) play a crucial role in success, a trend already evident in adolescence. Earlier studies have shown that greater BH and body surface area are strong predictors of rowing performance (Cosgrove et al., 1999; Bourgois, 2000), whereas others have identified lean body mass as the most significant anthropometric factor influencing performance (Cosgrove et al., 1999; Yoshiga et al., 2000; Mikulić, 2009).
The relationship between maximum power (W max) and sprint test (W mean) was particularly strong, indicating that both explosive strength and average power appear to be important contributors to rowing performance, particularly during high-intensity phases. The highest performances were recorded by Serbian and Italian boys, while Hungarian and Italian girls performed the best. The gender differences in performance were significant for all nations, except for the Czech rowers, where the difference did not reach statistical significance.
Our findings emphasize the importance of anthropometric and strength parameters in the selection of rowers and reinforce the crucial role of lower limb strength in the sport. Considering these results, successful rower development programs should prioritize lower limb strength and optimal body composition, in line with the technical and physiological demands of rowing.
The similarity in performance values across national teams may reflect similarities in performance profiles across the participating national groups, although training methodologies and selection systems were not directly assessed. Future studies should focus on long-term monitoring of rowers’ development and systematic comparisons of age-group performances to enhance the understanding of talent development and performance progression.
Acknowledgments
The authors would like to acknowledge the support of the Franco-German Youth Office (OFAJ) and the cooperation between the German Rowing Federation and the French Rowing Federation, which led to the implementation of the “Ramons vers les Jeux”/“Row to Olympics” project in 2022. The project provided an international framework for youth rowing development, facilitating collaboration, exchange of training methodologies, and talent development strategies across participating nations.
Funding information
This research received no external funding.
Author contributions
Z.A., F.I., and L.S. contributed to the conception and design of the study. Z.A. and F.I. contributed to data collection. L.S. contributed to data analysis and interpretation. Z.A., F.I., and L.S. contributed to drafting and critically revising the manuscript. All authors read and approved the final version of the manuscript.
Institutional review board statement
We adhered to the Declaration of Helsinki’s principles regarding voluntary participation and parental consent, and the study was also supported by the participating clubs and national rowing federations.
Conflict of interest statement
The authors declare no conflict of interest.
Data availability statement
The data presented in this study are available on request from the corresponding author without undue reservation.