
Table 1
All included sports in both groups of former elite athletes
| Groups and types of sports | Frequencies (%) of athletes |
|---|---|
| RWL group | 56 (52) |
| Box | 8 (14) |
| Jiu-Jitsu | 4 (7) |
| Judo | 14 (25) |
| Karate | 12 (21) |
| Kickboxing | 5 (9) |
| Sambo | 12 (22) |
| Taekwondo | 1 (2) |
| Control group | 52 (48) |
| Athletics | 8 (15) |
| Mountain climbing | 5 (10) |
| Rowing | 4 (8) |
| Soccer | 33 (63) |
| Swimming | 2 (4) |
Note: RWL = rapid weight loss.
Source: Authors’ contribution.
Table 2
Demographic and lifestyle parameters of the analyzed groups
| Variables | RWL group | Control group | P value |
|---|---|---|---|
| Age (years) | 51.93 ± 7.80 | 51.12 ± 7.36 | 0.504 |
| Body height (cm) | 176.77 ± 6.31 | 180.37 ± 7.14 | 0.005 |
| Body weight (kg) | 92.11 ± 15.68 | 88.66 ± 13.43 | 0.290 |
| Body mass index (kg/m²) | 29.39 ± 4.23 | 27.11 ± 3.67 | 0.001 |
| Walking (min) | 239.57 ± 315.43 | 288.92 ± 456.92 | 0.816 |
| Moderate physical activity (min) | 179.25 ± 385.83 | 215.31 ± 558.00 | 0.411 |
| Vigorous physical activity (min) | 110.25 ± 164.88 | 123.92 ± 246.29 | 0.728 |
| Sedentary behavior (min) | 1476.43 ± 950.30 | 1832.31 ± 1414.20 | 0.279 |
| Alcohol, n (%) | 23 (41%) | 31 (60%) | 0.054 |
| Smoking, n (%) | 5 (9%) | 5 (10%) | 0.902 |
Note: RWL = rapid weight loss. Bolded P value indicates statistically significant differences between groups.
Source: Authors’ contribution.
Table 3
Differences between groups regarding metabolic health outcomes
| Outcome measures | RWL group | Control group | Mean differences (95% CI) | Z values | r | P value |
|---|---|---|---|---|---|---|
| Waist circumference (cm) | 104.84± 7.96 | 103.62± 7.04 | 1.22 (−1.65, 4.10) | −0.86 | −0.08 | 0.391 |
| Fasting glucose (mg/dL) | 103.87 ± 25.19 | 95.33 ± 15.21 | 8.55 (0.67, 16.44) | −1.94 | −0.19 | 0.053 |
| Systolic blood pressure (mm/Hg) | 130.20 ± 9.98 | 124.96 ± 12.89 | 5.24 (0.81, 9.67) | −4.37 | −0.42 | <0.001 |
| Diastolic blood pressure (mm/Hg) | 84.73 ± 10.42 | 76.79 ± 7.94 | 7.94 (4.42, 11.46) | −4.38 | −0.42 | <0.001 |
| HDL cholesterol (mg/dL) | 23.12 ± 5.36 | 22.54 ± 4.31 | 0.58 (−1.28, 2.45) | −0.54 | −0.05 | 0.588 |
| Triglycerides (mg/dL) | 34.15 ± 18.77 | 25.16 ± 13.25 | 8.99 (2.75, 15.23) | −2.88 | −0.28 | 0.004 |
| LDL cholesterol (mg/dL) | 61.70 ± 16.29 | 59.34 ± 15.27 | 2.36 (−3.67, 8.40) | −1.51 | −0.15 | 0.132 |
| Total cholesterol (mg/dL) | 100.41 ± 15.67 | 93.92 ± 17.75 | 6.49 (0.11, 12.87) | −2.55 | −0.25 | 0.011 |
| Fasting insulin (μIU/mL) | 12.58 ± 10.27 | 9.43 ± 6.03 | 3.14 (−0.05, 6.34) | −1.46 | −0.14 | 0.144 |
| HOMA-IR | 3.54 ± 3.83 | 2.28 ± 1.58 | 1.26 (0.15, 2.37) | −1.75 | −0.17 | 0.081 |
Note: HDL = high-density lipoprotein; HOMA-IR = homeostatic model assessment of insulin resistance; LDL = low-density lipoprotein; RWL = rapid weight loss. Bolded P value indicates statistically significant differences between groups.
Source: Authors’ contribution.
Table 4
The levels of fasting insulin and fasting glucose before and after OGTT for both groups
| Groups | Outcome measures | |
|---|---|---|
| RWL group | Fasting insulin | Fasting glucose |
| Baseline | 12.58 ± 10.27 | 103.89 ± 25.19 |
| Final | 67.34 ± 65.58 | 120.92 ± 52.10 |
| Mean differences (95% CI) | −54.76 (−71.20, 38.33)*** | 36.54 (−26.82, −7.25)** |
| Z values | −6.49 | −3.06 |
| r | −0.61 | 0.30 |
| Control group | ||
| Baseline | 9.43 ± 6.03 | 95.33 ± 15.21 |
| Final | 43.25 ± 30.86 | 96.96 ± 30.73 |
| Mean differences (95% CI) | −33.81 (−42.12, −25.50)*** | −1.63 (−9.05, 5.79) |
| Z values | −6.19 | −0.22 |
| r | −0.61 | 0.02 |
| Between-group differences | ||
| P value | 0.026 # | 0.023 # |
Note: OGTT = oral glucose tolerance test; RWL = rapid weight loss. ***Statistically significant differences between baseline and final measurement, p < 0.001 (Wilcoxon test). **Statistically significant differences between baseline and final measurement, p < 0.01 (Wilcoxon test). #Statistically significant differences between included groups at the final measurement (Mann–Whiteny U test). Bolded P value indicates statistically significant differences between groups.
Source: Authors’ contribution.
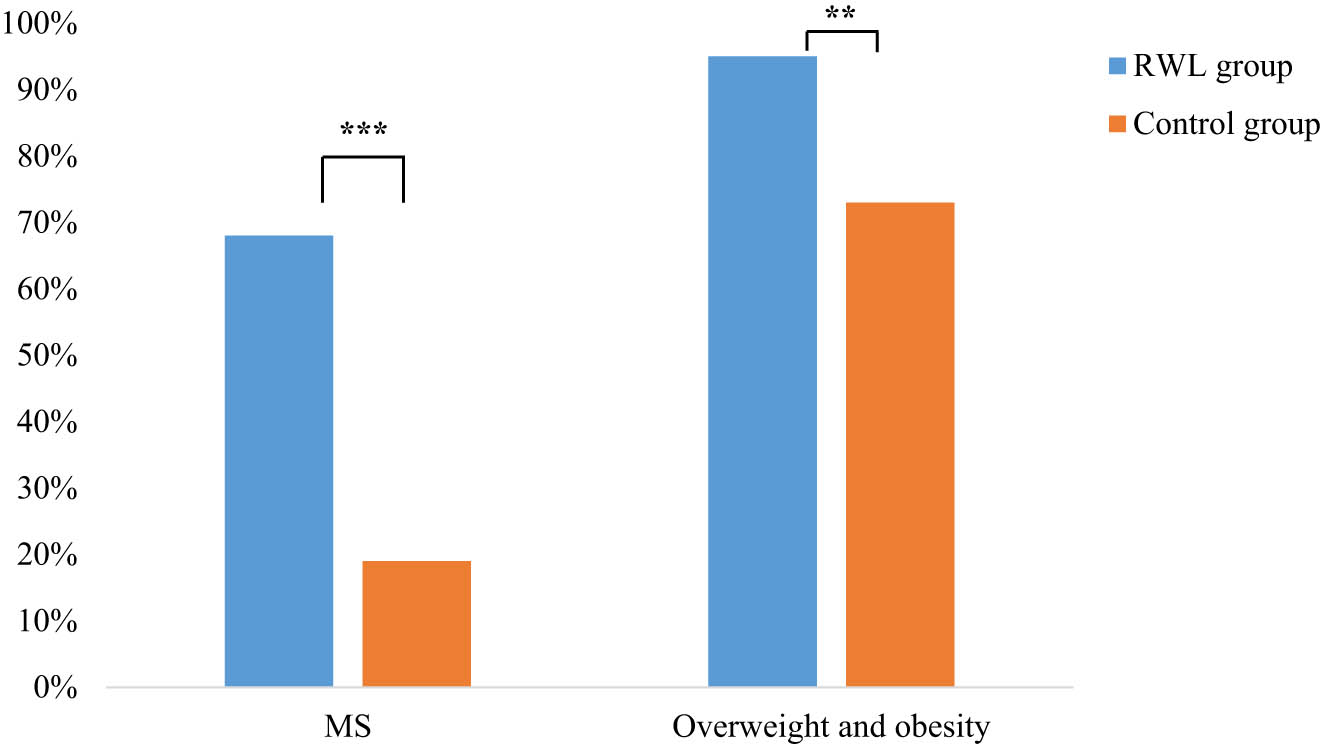
Figure 1
Prevalence of MS and overweight and obesity among athletes with a history of RWL and matched male controls. MS = metabolic syndrome; RWL = rapid weight loss. ***Statistically significant differences between groups, p < 0.001. **Statistically significant differences between groups, p < 0.01. Adjusted binary logistic regression analysis has been applied, using a variable age as a covariate
Source: Authors’ contribution.