
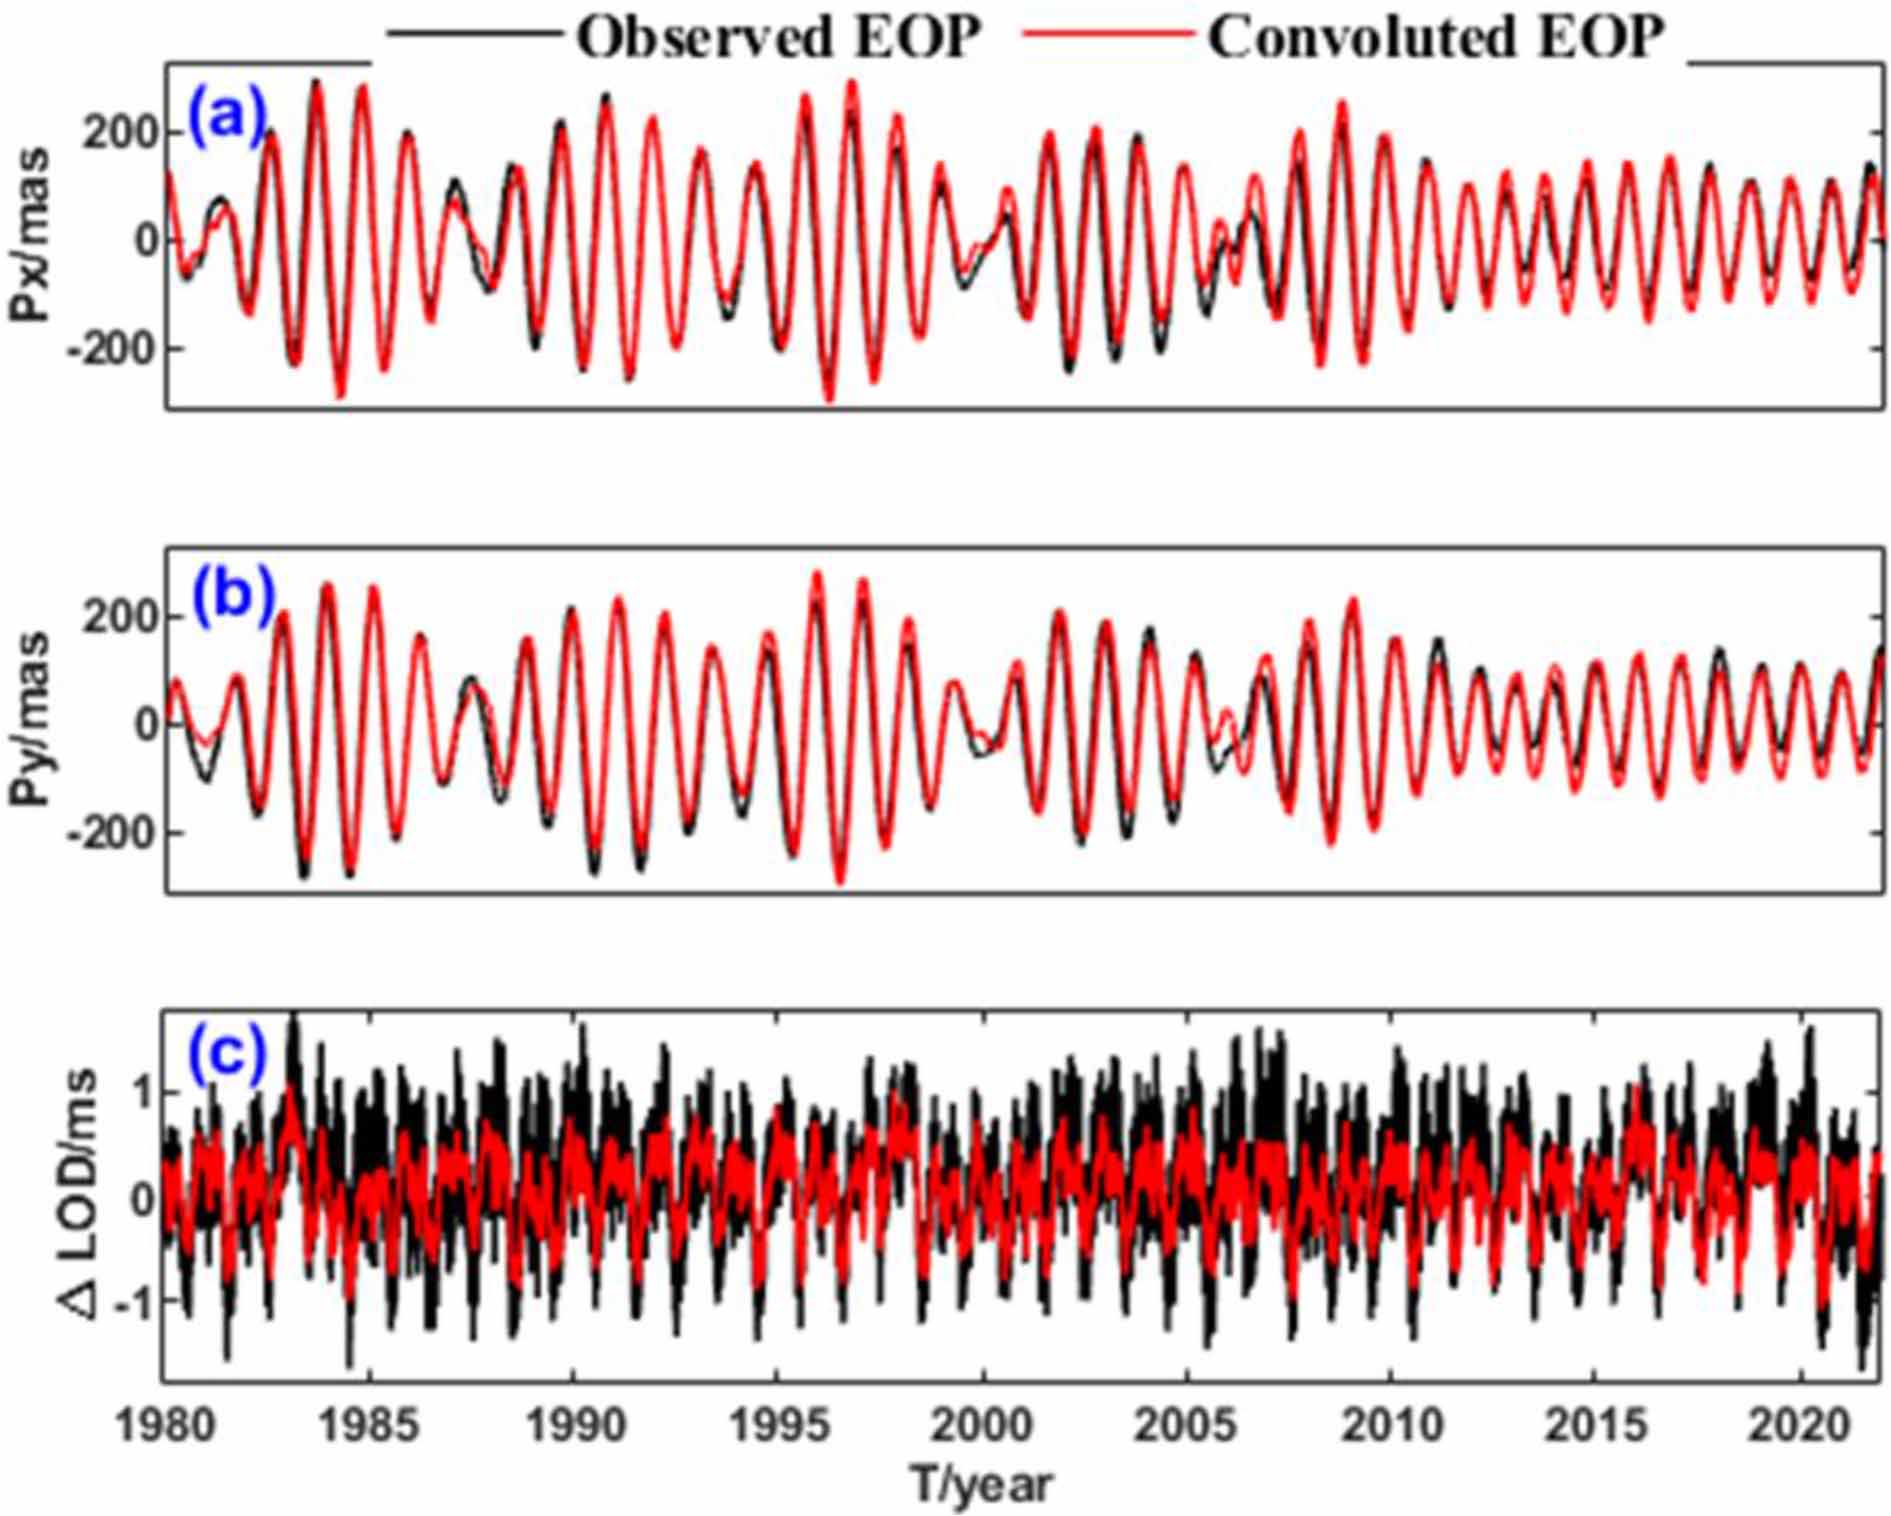
Figure 1.
EOP interannual, seasonal and sub-seasonal terms extracted from IERS C04 observations (black line) and convoluted from the EAM series (red line) during 1980-2022.
(a) Px, (b) Py and (c) ΔLOD
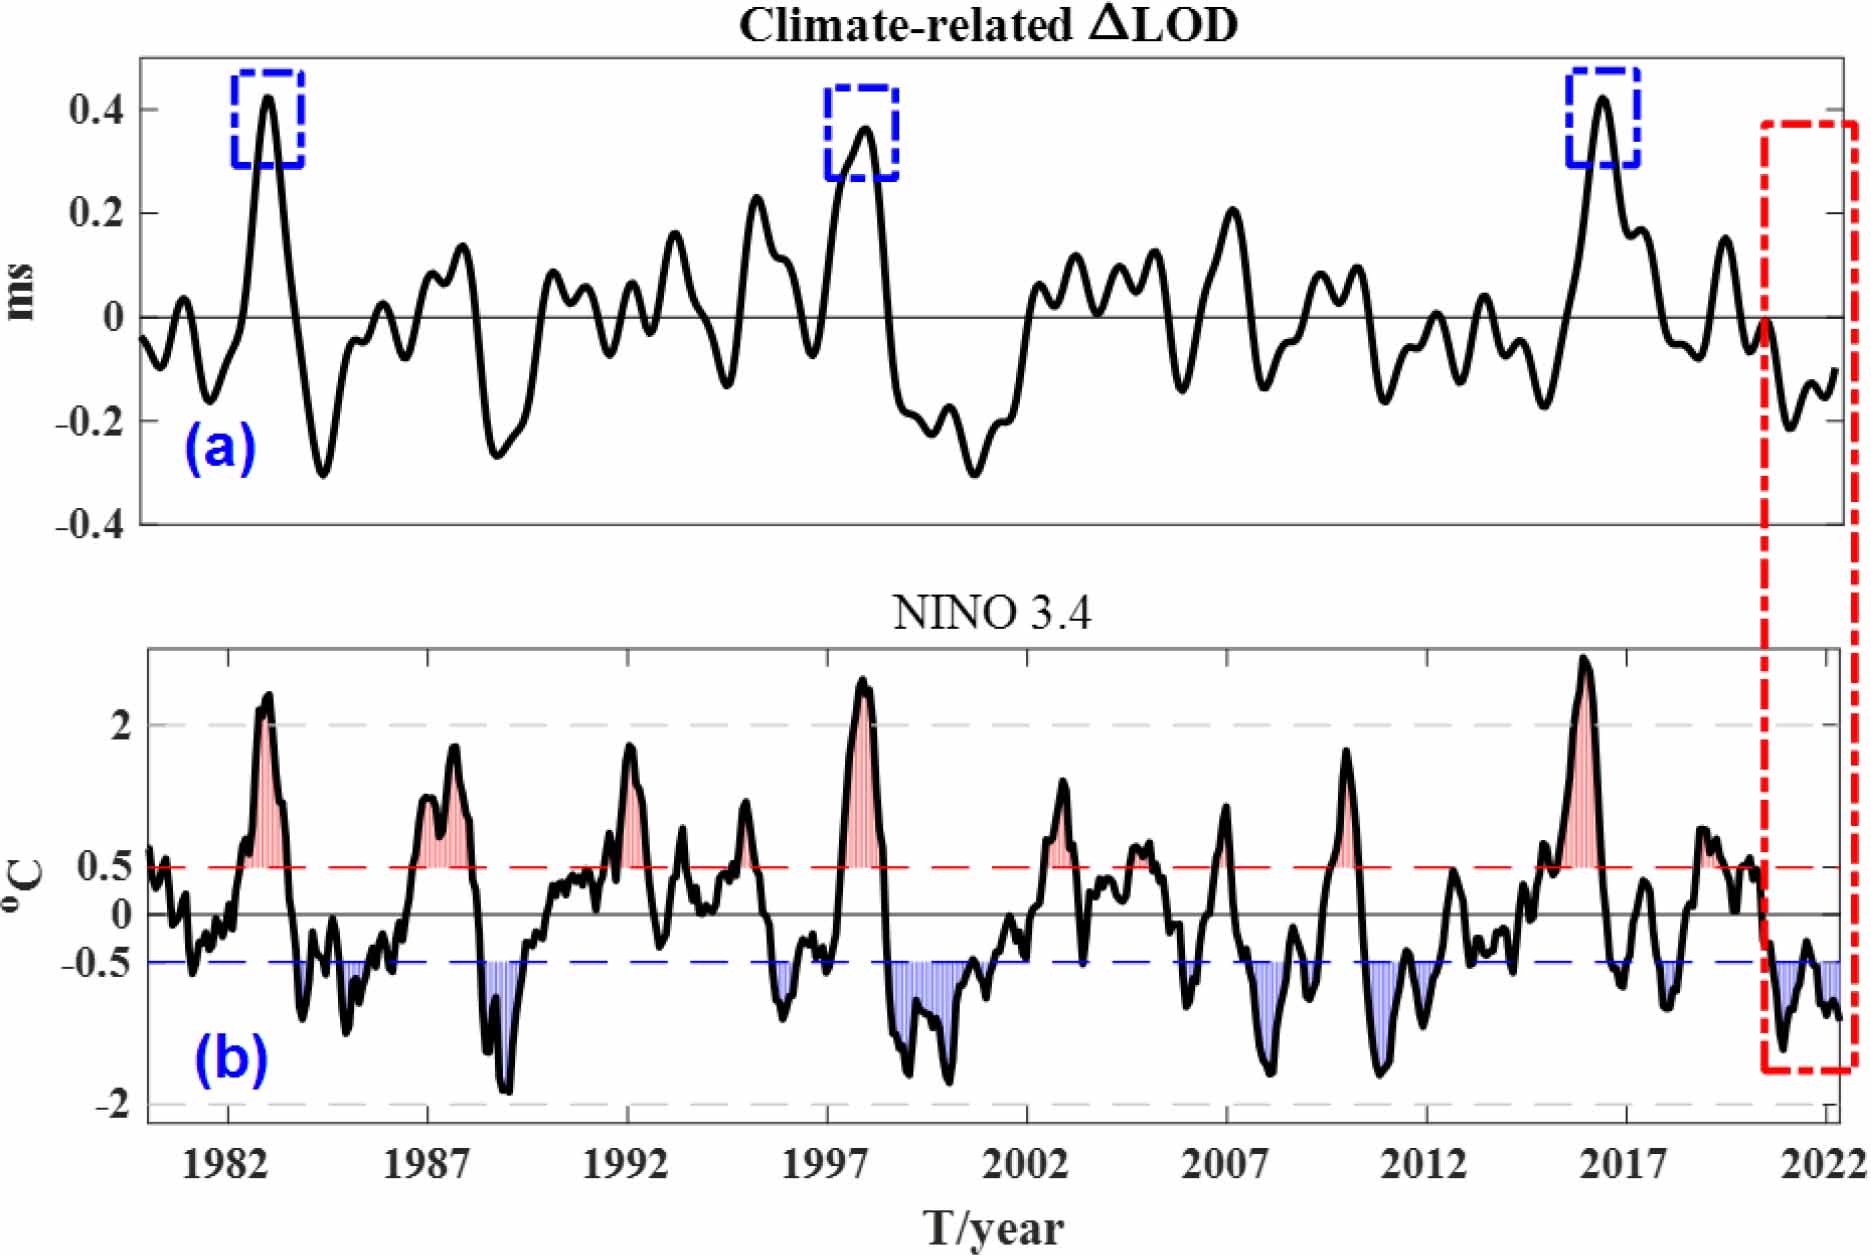
Figure 2.
Monthly mean series of the climate-related ΔLOD and Nino 3.4 from January 1980 to April 2022. The blue square frames mark the three extreme El Nino events; the red square frame marks the latest two La Nina events during 2020–2022. (a) Climate-related ΔLOD and (b) Nino 3.4
Table 1.
RMSE of different EOP forecast spans obtained by the LS + AR and LS + CV methods over 07.2021–03.2022
| Forecast span (days) | Px (mas) | Py (mas) | UT1-UTC (ms) | |||
|---|---|---|---|---|---|---|
| LS + AR | LS + CV | LS + AR | LS + CV | LS + AR | LS + CV | |
| 1 | 0.70 | 0.058 | 0.87 | 0.84 | 0.20 | 0.18 |
| 2 | 1.14 | 1.05 | 1.05 | 1.00 | 0.35 | 0.32 |
| 3 | 1.61 | 1.54 | 1.32 | 1.27 | 0.50 | 0.47 |
| 4 | 2.12 | 2.11 | 1.50 | 1.45 | 0.64 | 0.60 |
| 5 | 2.54 | 2.54 | 1.67 | 1.64 | 0.76 | 0.71 |
| 6 | 2.84 | 2.83 | 1.83 | 1.81 | 0.86 | 0.82 |
| 7 | 3.02 | 3.02 | 1.88 | 1.86 | 0.91 | 0.89 |
| 8 | 3.22 | 3.22 | 1.93 | 1.92 | 0.97 | 0.95 |
| 9 | 3.44 | 3.43 | 2.01 | 2.01 | 1.03 | 1.01 |
| 10 | 3.75 | 3.74 | 2.14 | 2.13 | 1.10 | 1.07 |
| 20 | 4.87 | 5.15 | 3.01 | 3.06 | 2.83 | 2.90 |
| 30 | 5.44 | 5.80 | 3.98 | 4.10 | 4.18 | 4.40 |
| 40 | 5.35 | 5.85 | 5.23 | 5.53 | 5.98 | 6.46 |
| 50 | 4.47 | 5.51 | 6.47 | 7.08 | 8.03 | 8.72 |
| 60 | 4.32 | 4.82 | 7.33 | 8.12 | 9.98 | 10.85 |
| 70 | 5.27 | 5.44 | 8.17 | 9.08 | 11.63 | 12.47 |
| 80 | 6.00 | 6.22 | 9.09 | 10.04 | 13.20 | 14.18 |
| 90 | 6.10 | 6.13 | 9.52 | 10.32 | 15.13 | 16.04 |
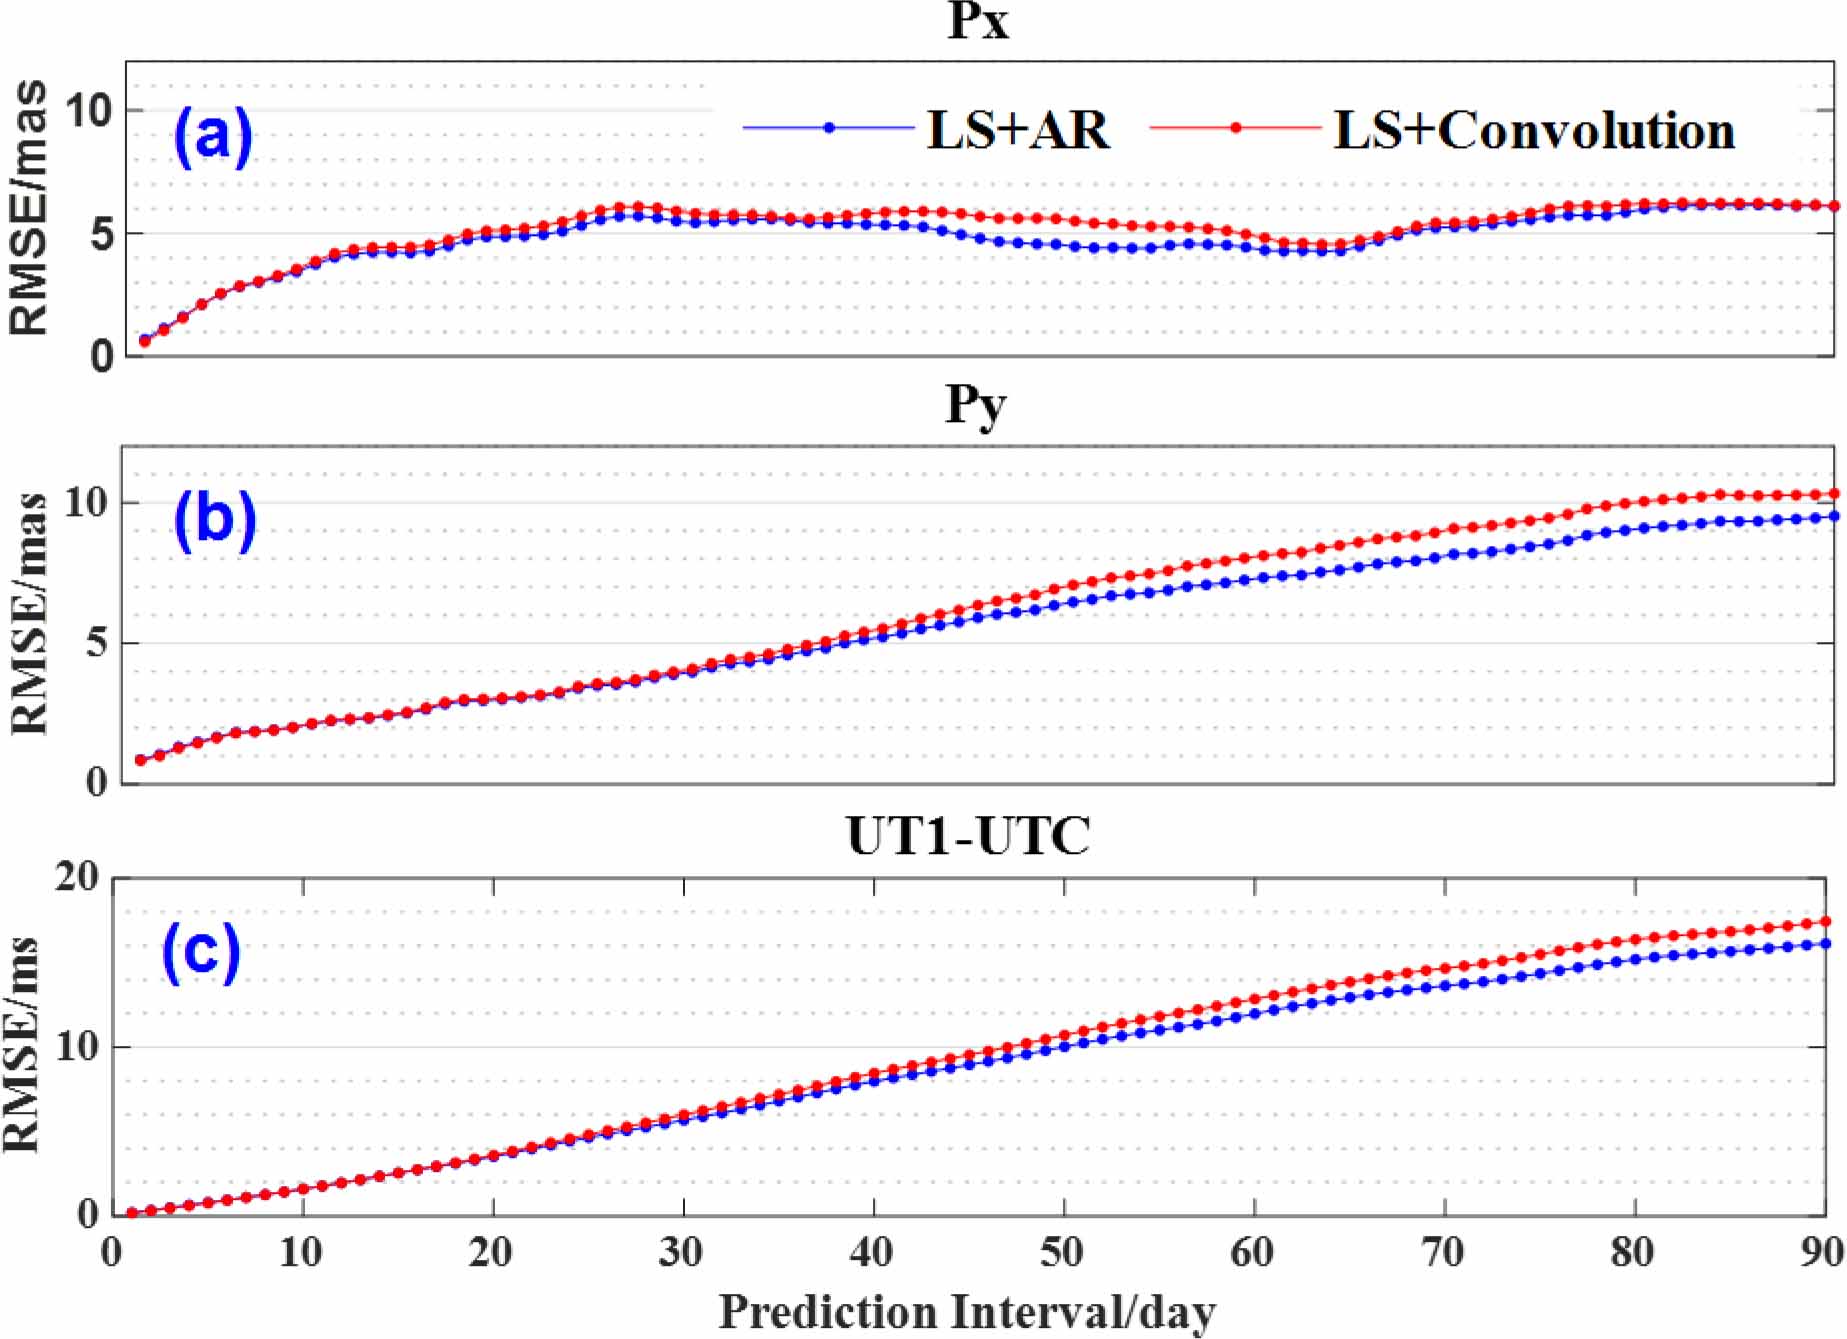
Figure 3.
The 1–90 days’ RMSE calculated from the LS + AR (blue dot line) and LS + Convolution (red dot line) model. (a) Px, (b) Py and (c) UT1-UTC
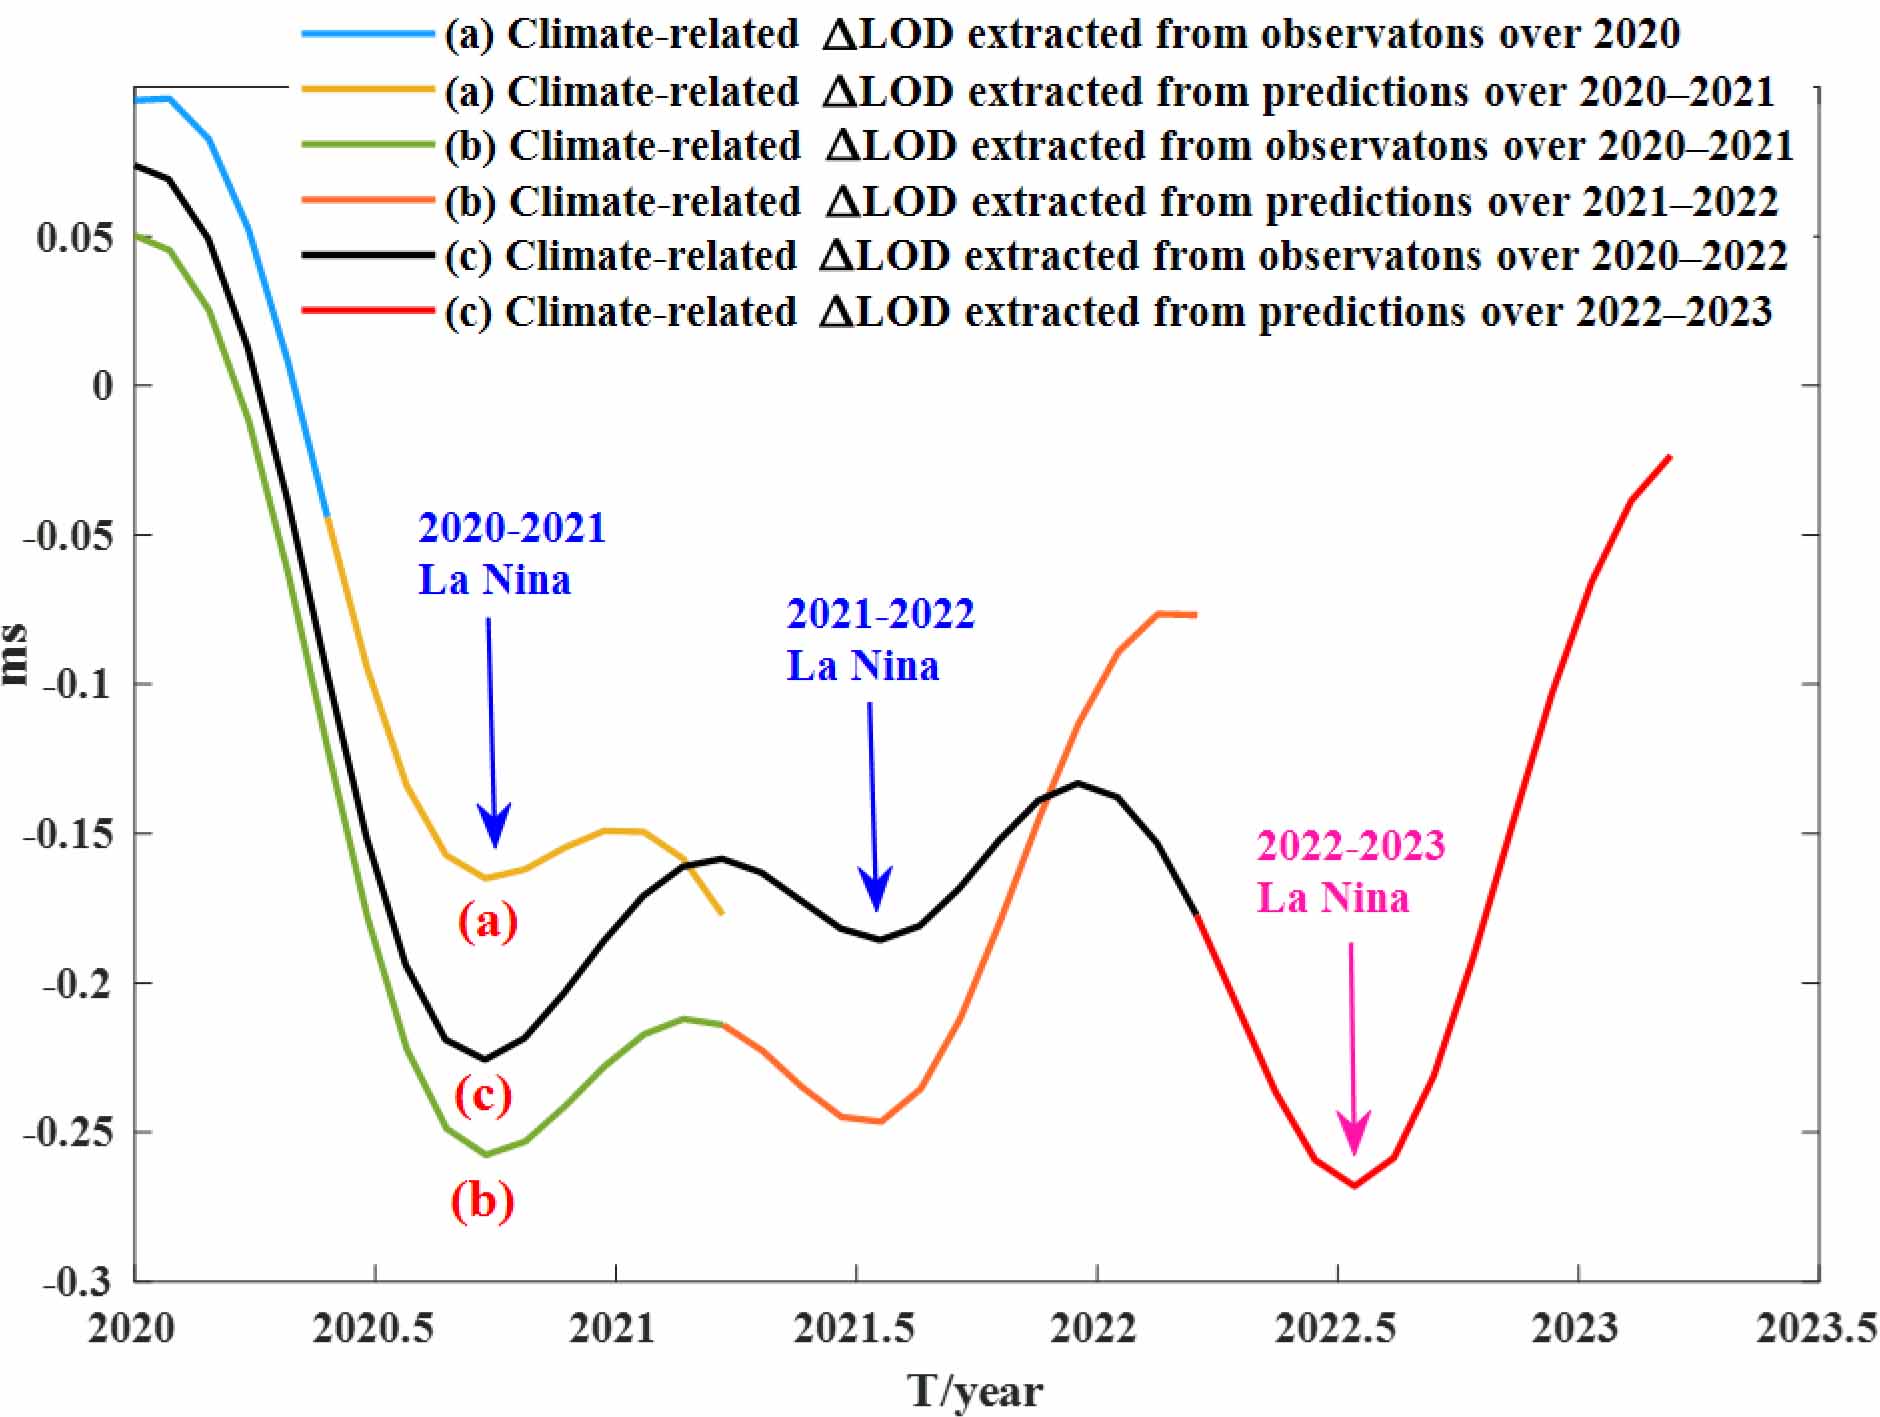
Figure 4.
Climate change information extracted from ΔLOD observations and predictions: (a) 2020–2021 time span, (b) 2020–2022 time span and (c) 2020–2023 time span