
Figure 1.
Figure 2.

Figure 3.

Figure 4.
Figure 5.

Figure 6.
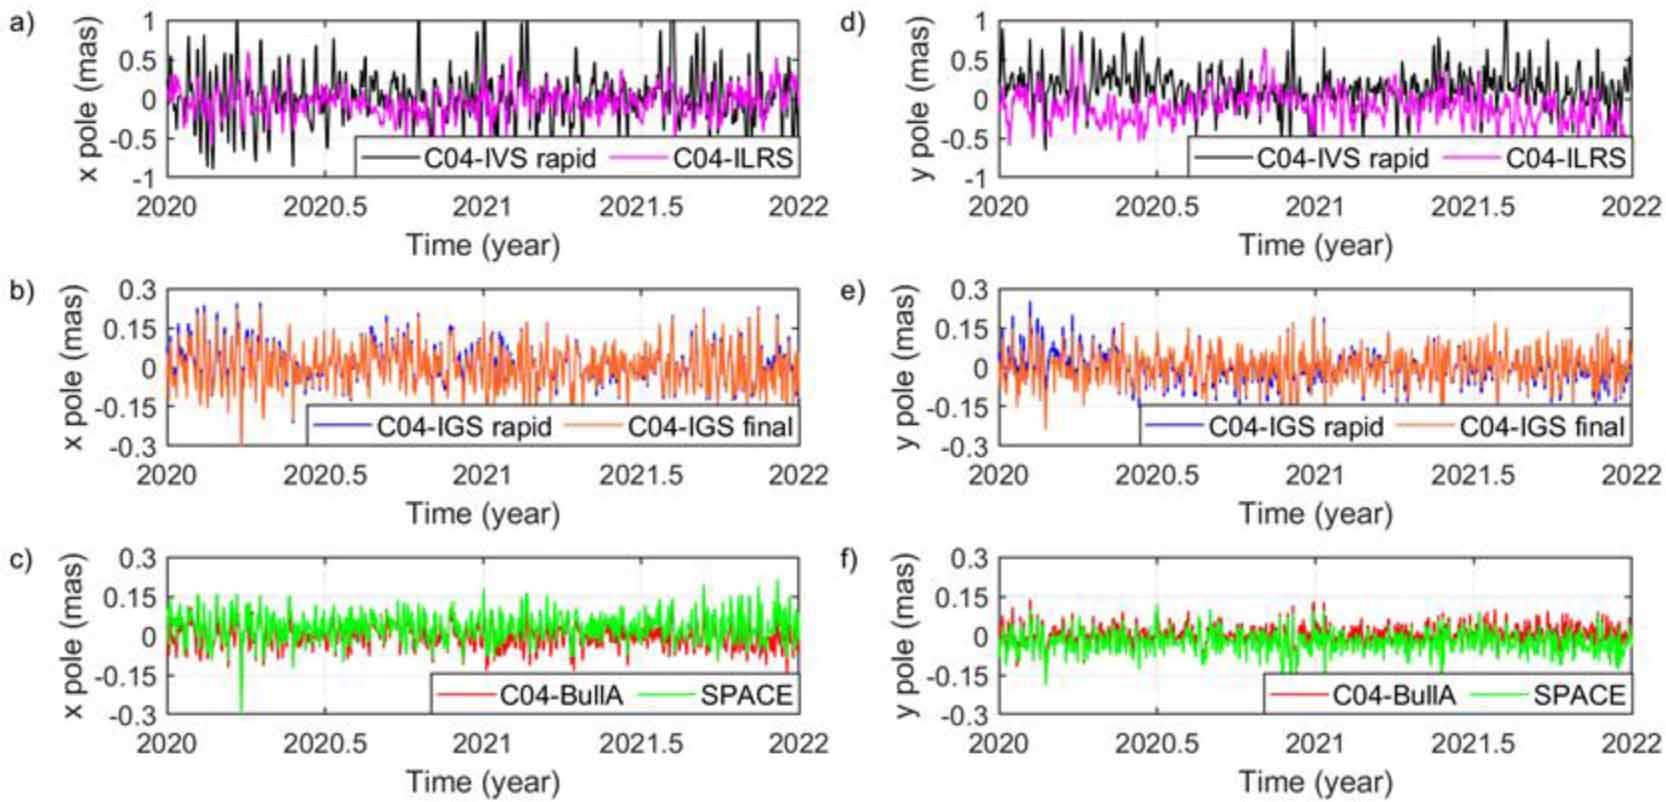
Figure 7.

Figure 8.

Figure 9.

Number of predictions submitted to the Office (as of February 9, 2022) with respect to the number of participants and the number of IDs
| x pole | y pole | UT1-UTC | LoD | dPsi | dEps | dX | dY | Total | |
|---|---|---|---|---|---|---|---|---|---|
| Total number of predictions | 497 | 497 | 442 | 348 | 41 | 41 | 142 | 142 | 2150 |
| Number of participants | 16 | 16 | 15 | 10 | 2 | 2 | 6 | 6 | 19 |
| Number of IDs | 25 | 25 | 21 | 17 | 2 | 2 | 7 | 7 | 38 |
Details on EOP reference solutions compared in this study
| Solution | Starting date | Provided EOP | Provider |
|---|---|---|---|
| C04 | 1 January 1962 | x pole, y pole, UT1-UTC, LoD, dX, dY, dPsi, dEps | The Earth Orientation Center of the IERS (Bizouard et al. 2019) |
| SPACE | 19 July 1993 | x pole, y pole, UT1-UTC | JPL (Ratcliff and Gross 2019) |
| Bulletin A | 1 September 1996 | x pole, y pole, UT1-UTC | IERS Rapid Service Prediction Centre (Wooden and Gambis 2004) |
| ILRS | 28 December 1997 | x pole, y pole, LoD | ILRS (Sciarletta et al. 2010) |
| IGS rapid | 30 June 1996 | x pole, y pole, UT1-UTC, LoD | IGS (Kouba and Mireault 1998) |
| IGS final | 30 June 1996 | x pole, y pole, UT1-UTC, LoD | IGS (Kouba and Mireault 1998) |
| IVS rapid | 4 January 2002 | x pole, y pole, UT1-UTC, LoD, dX, dY, dPsi, dEps | IVS BKG/DGFI Combination Center (Malkin 2001) |
| GSFC | 4 August 1979 | x pole, y pole, UT1-UTC, LoD, dX, dY, dPsi, dEps | NASA GSFC (Technical description of solution gsf2014a, https://hpiers.obspm.fr/eoppc/series/operational/gsfc_r.txt – accessed on 13 September 2022) |
| USNO | 4 August 1979 | x pole, y pole, UT1-UTC, LoD, dX, dY, dPsi, dEps | USNO (Technical description of solution usn2015a, https://hpiers.obspm.fr/eoppc/series/operational/usno_r.txt – accessed on 13 September 2022) |
Root mean square (RMS), mean, minimum, and maximum of differences between C04 and: USNO, GSFC, and IVS rapid solutions for dX, dY and dPsi, dEps components of precession-nutation
| Solution | RMS | Mean | Min | Max | ||||
|---|---|---|---|---|---|---|---|---|
| dX (mas) | dY (mas) | dX (mas) | dY (mas) | dX (mas) | dY (mas) | dX (mas) | dY (mas) | |
| C04 – USNO | 0.178 | 0.117 | −0.001 | 0.018 | −0.913 | −0.455 | 2.952 | 1.658 |
| C04 – GSFC | 0.114 | 0.146 | −0.034 | 0.027 | −0.885 | -1.262 | 0.946 | 2.002 |
| C04 – IVS rapid | 0.018 | 0.008 | 0.001 | 0.000 | −0.231 | −0.055 | 0.159 | 0.076 |
| Solution | dPsi (mas) | dEps (mas) | dPsi (mas) | dEps (mas) | dPsi (mas) | dEps (mas) | dPsi (mas) | dEps (mas) |
| C04 – USNO | 0.130 | 0.139 | 0.010 | −0.031 | −0.466 | −0.642 | 1.608 | 1.086 |
| C04 – GSFC | 0.135 | 0.181 | −0.019 | −0.024 | −0.878 | −1.297 | 0.954 | 1.965 |
| C04 – IVS rapid | 0.078 | 0.117 | 0.009 | −0.008 | −0.414 | −0.634 | 0.440 | 0.498 |
Root mean square (RMS), mean, minimum, and maximum of differences between C04 and ILRS, SPACE, IGS rapid, IGS final, IVS rapid, and Bulletin A solutions for LoD and UT1-UTC
| Solution | LoD | UT1-UTC | ||||||
|---|---|---|---|---|---|---|---|---|
| RMS (ms) | Mean (ms) | Min (ms) | Max (ms) | RMS (ms) | Mean (ms) | Min (ms) | Max (ms) | |
| C04 – ILRS | 0.035 | 0.000 | −0.077 | 0.290 | × | × | × | × |
| C04 – SPACE | 0.015 | −0.001 | −0.054 | 0.050 | 0.019 | −0.005 | −0.113 | 0.082 |
| C04 – IGS rapid | 0.011 | 0.000 | −0.039 | 0.034 | 0.051 | −0.008 | −0.167 | 0.153 |
| C04 – IGS final | 0.010 | −0.001 | −0.037 | 0.028 | 0.043 | −0.006 | −0.147 | 0.140 |
| C04 – IVS rapid | 0.098 | −0.005 | −0.391 | 0.502 | 0.212 | −0.001 | −1.035 | 0.744 |
| C04 – Bulletin A | × | × | × | × | 0.020 | −0.004 | −0.110 | 0.087 |
Details on the 1st and 2nd EOP PCC participants and methods
| 1st EOP PCC | 2nd EOP PCC | |
|---|---|---|
| Number of registered participants (institutes or groups of institutes) | 13 | 19 |
| Number of institutes | 10 | 24 |
| Number of countries of participants origin | 7 | 8 |
| Total number of all teams members | No data | 58 |
| Number of registered prediction methods (IDs) | 20 (+1 combined prediction series) | 38 |
| Number of active participants | 11 | 16 |
Root mean square (RMS), mean, minimum, and maximum of differences between C04 and Bulletin A, SPACE, IGS rapid, IGS final, ILRS, and IVS rapid solutions for x pole and y pole
| Solution | RMS | Mean | Min | Max | ||||
|---|---|---|---|---|---|---|---|---|
| x pole (mas) | y pole (mas) | x pole (mas) | y pole (mas) | x pole (mas) | y pole (mas) | x pole (mas) | y pole (mas) | |
| C04 – Bulletin A | 0.052 | 0.045 | 0.001 | 0.001 | −0.312 | −0.242 | 0.152 | 0.139 |
| C04 – SPACE | 0.066 | 0.051 | 0.035 | −0.025 | −0.307 | −0.228 | 0.214 | 0.122 |
| C04 – IGS rapid | 0.084 | 0.070 | 0.006 | −0.001 | −0.413 | −0.257 | 0.247 | 0.254 |
| C04 – IGS final | 0.080 | 0.065 | 0.001 | 0.000 | −0.419 | −0.254 | 0.227 | 0.194 |
| C04 – ILRS | 0.214 | 0.241 | −0.050 | −0.116 | −1.656 | −0.772 | 0.600 | 0.673 |
| C04 – IVS rapid | 0.360 | 0.299 | 0.028 | 0.139 | -1.441 | -1.144 | 2.268 | 1.263 |