
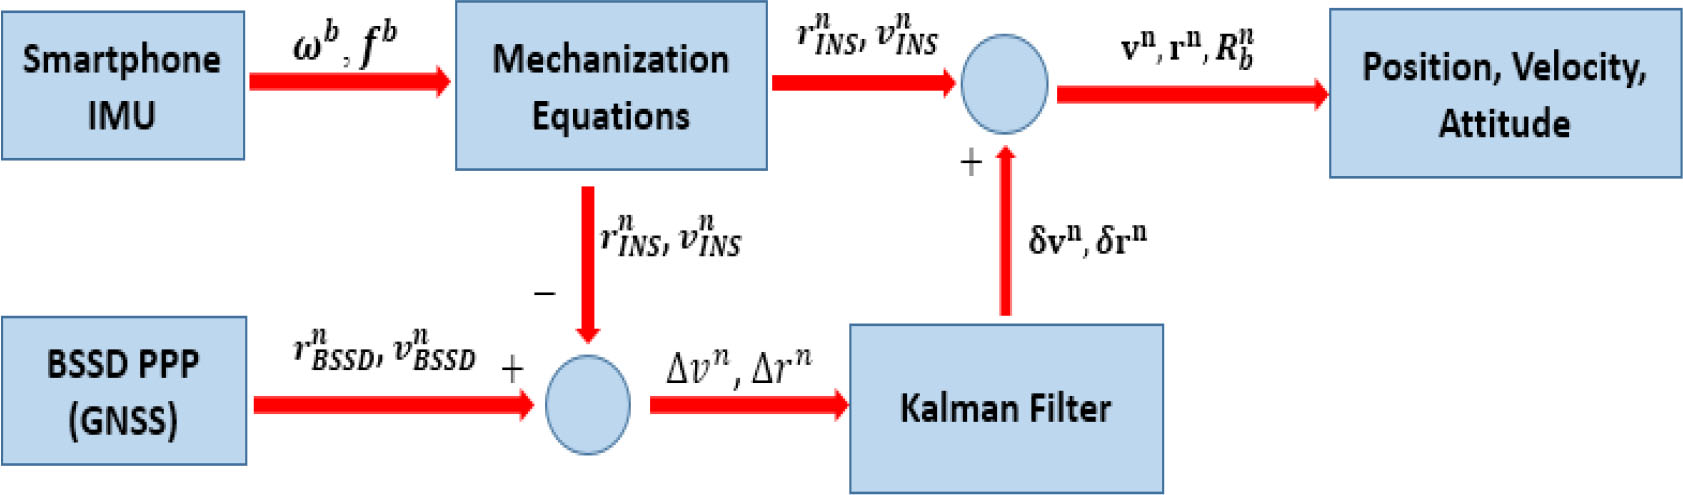
Figure 1.
Block diagram of loosely coupled GNSS–INS integration process
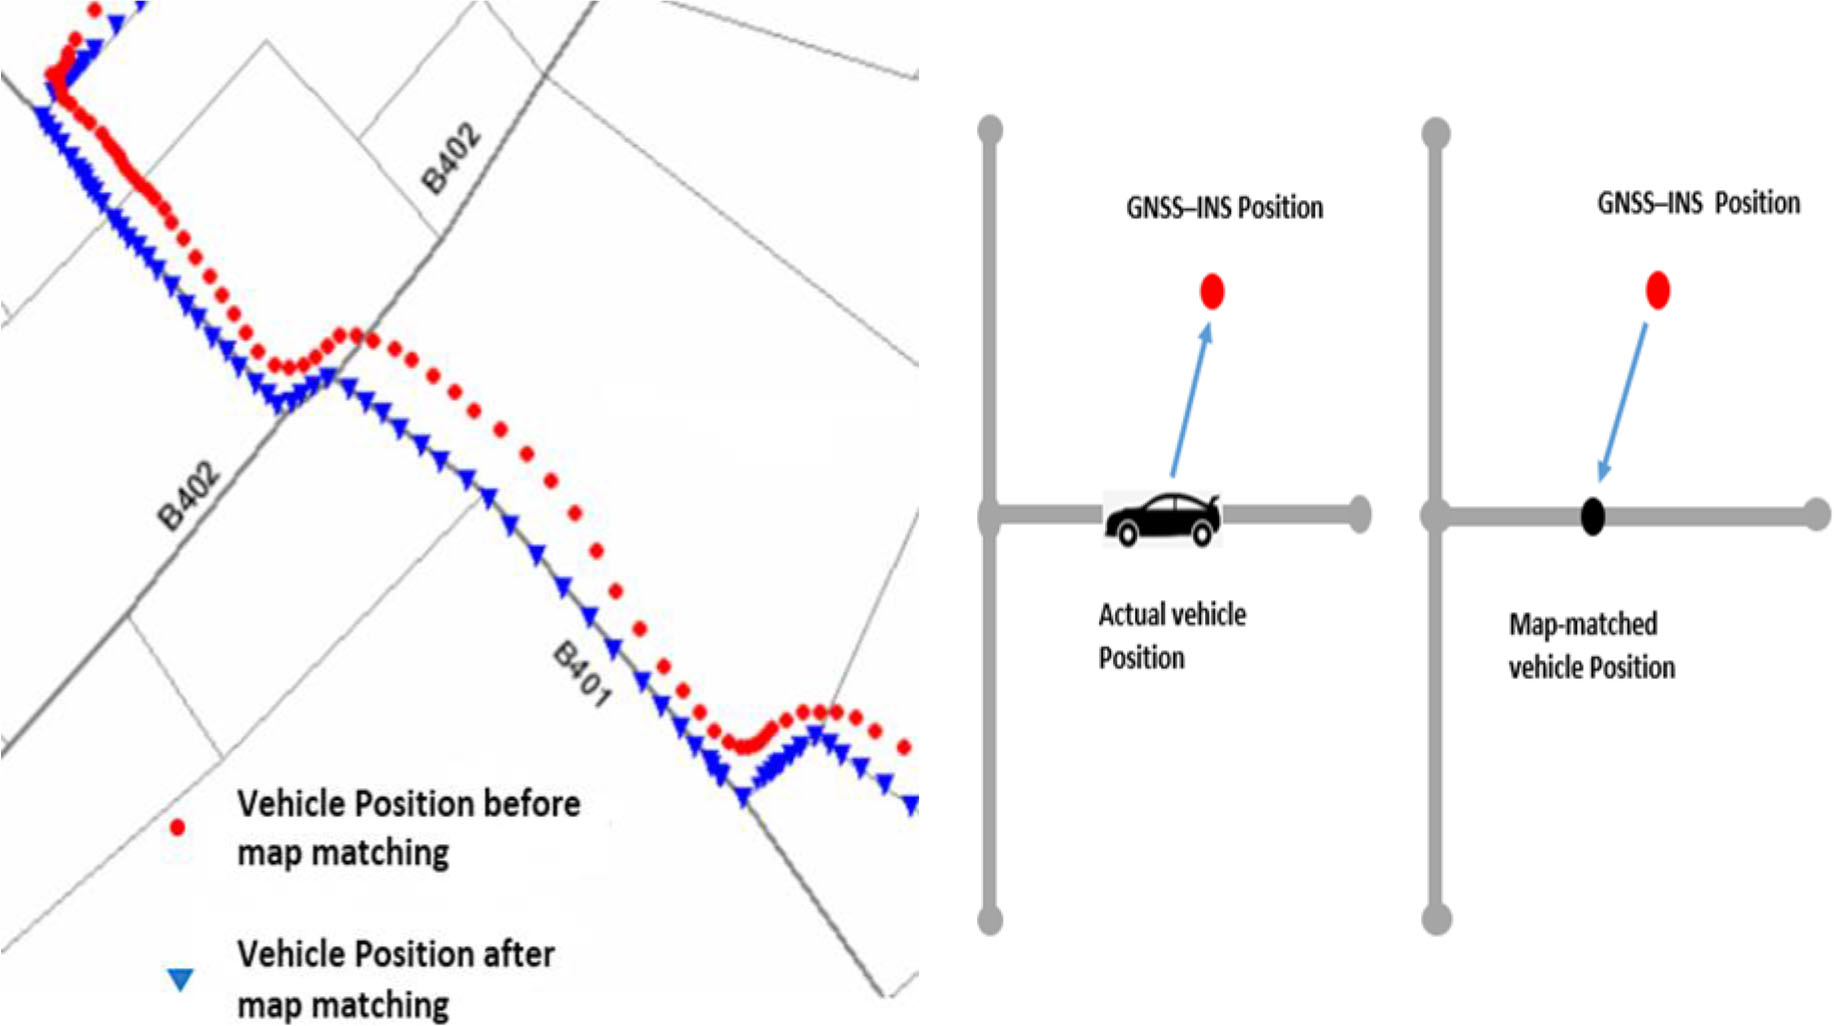
Figure 2.
Map matching process illustration (left) and focusing at specific position (right)
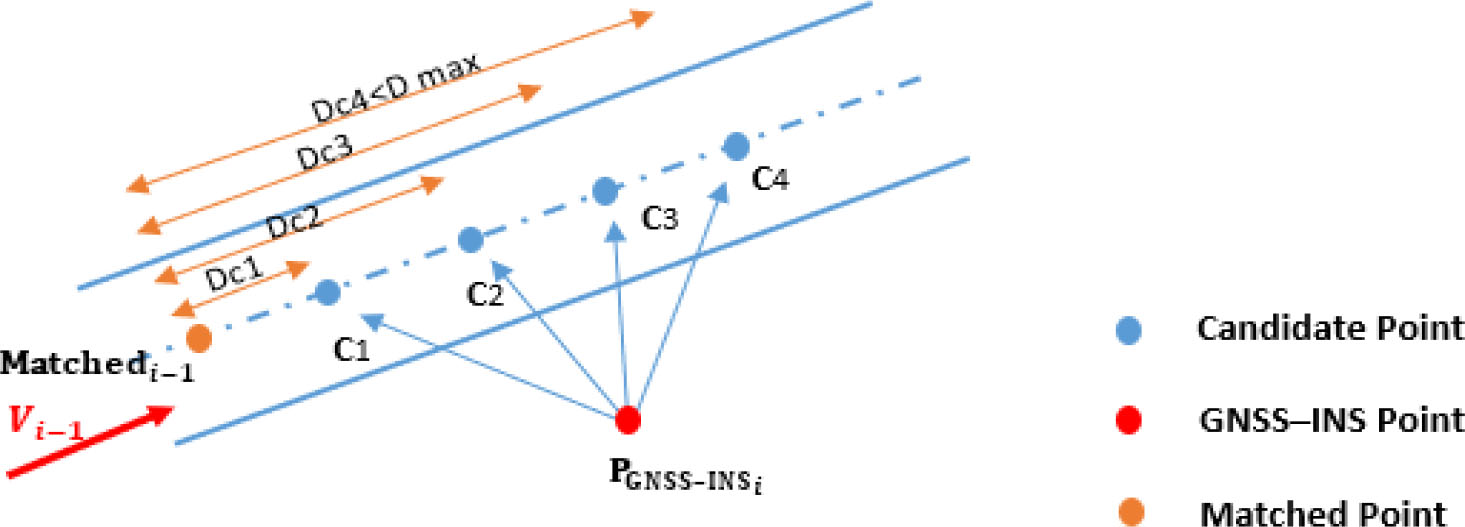
Figure 3.
Selection of the candidate points of the trajectory
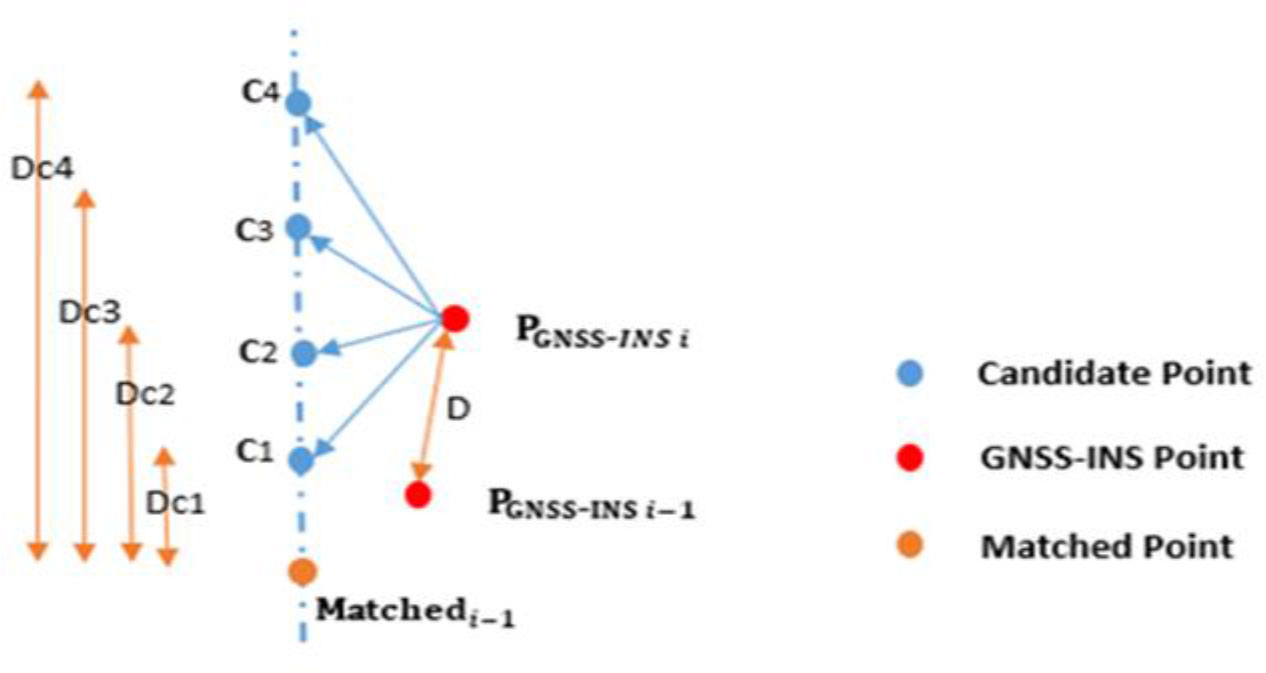
Figure 4.
Transition probability representation
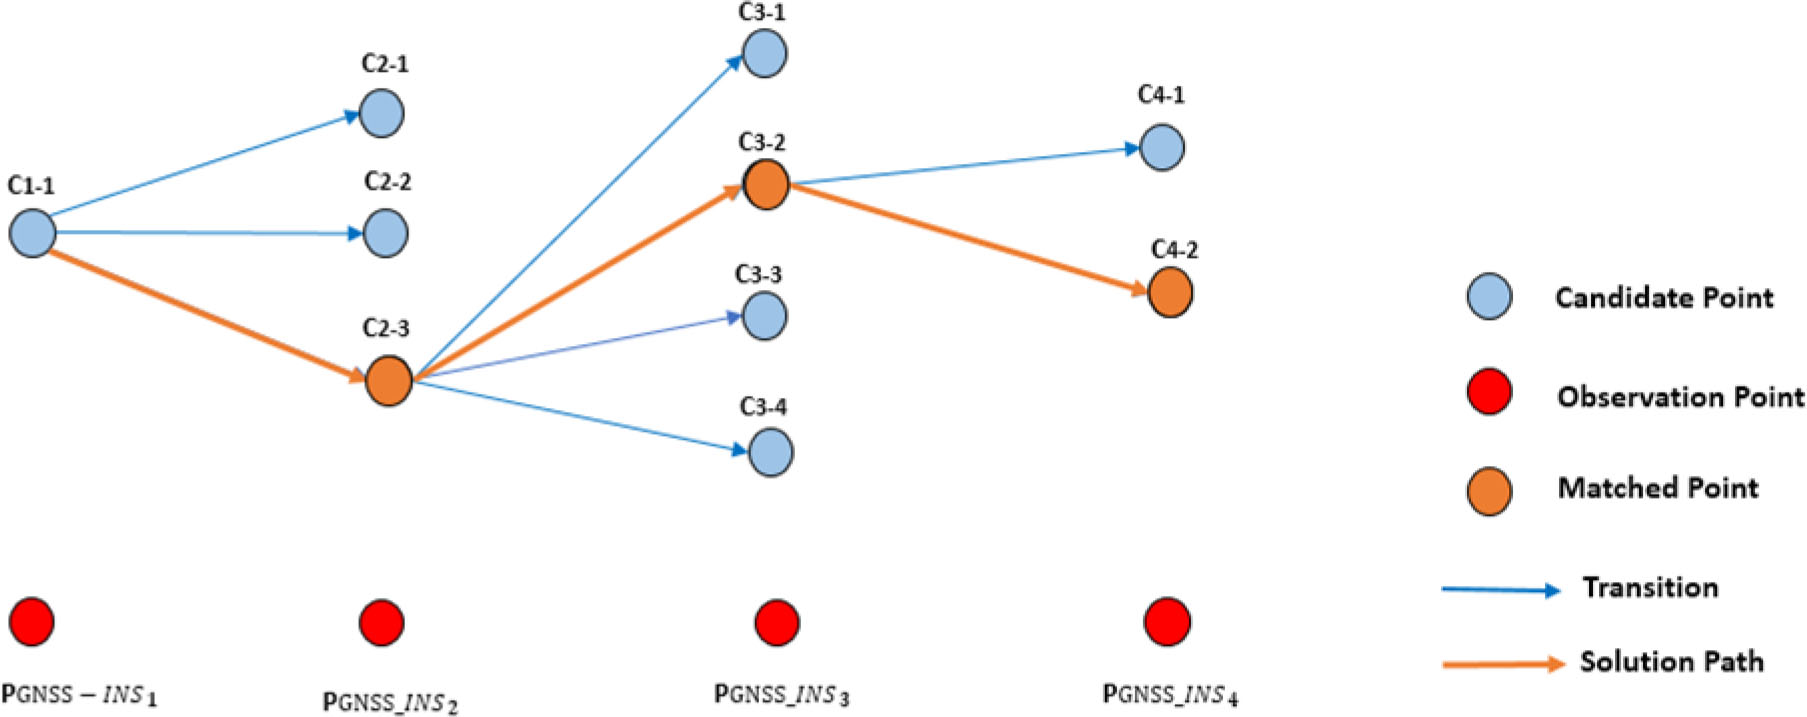
Figure 5.
Determination of the final matching trajectory
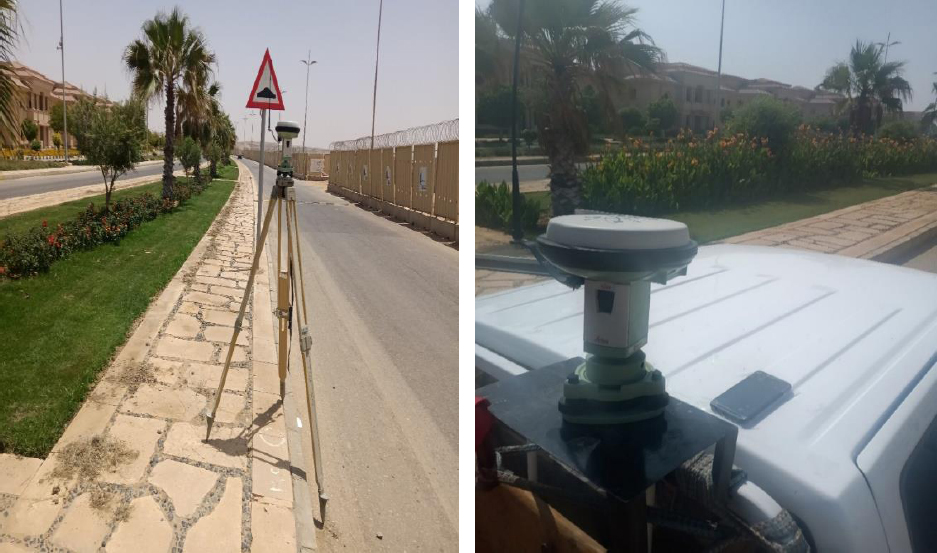
Figure 6.
Geodetic base (left) and geodetic rover and smartphone (right)
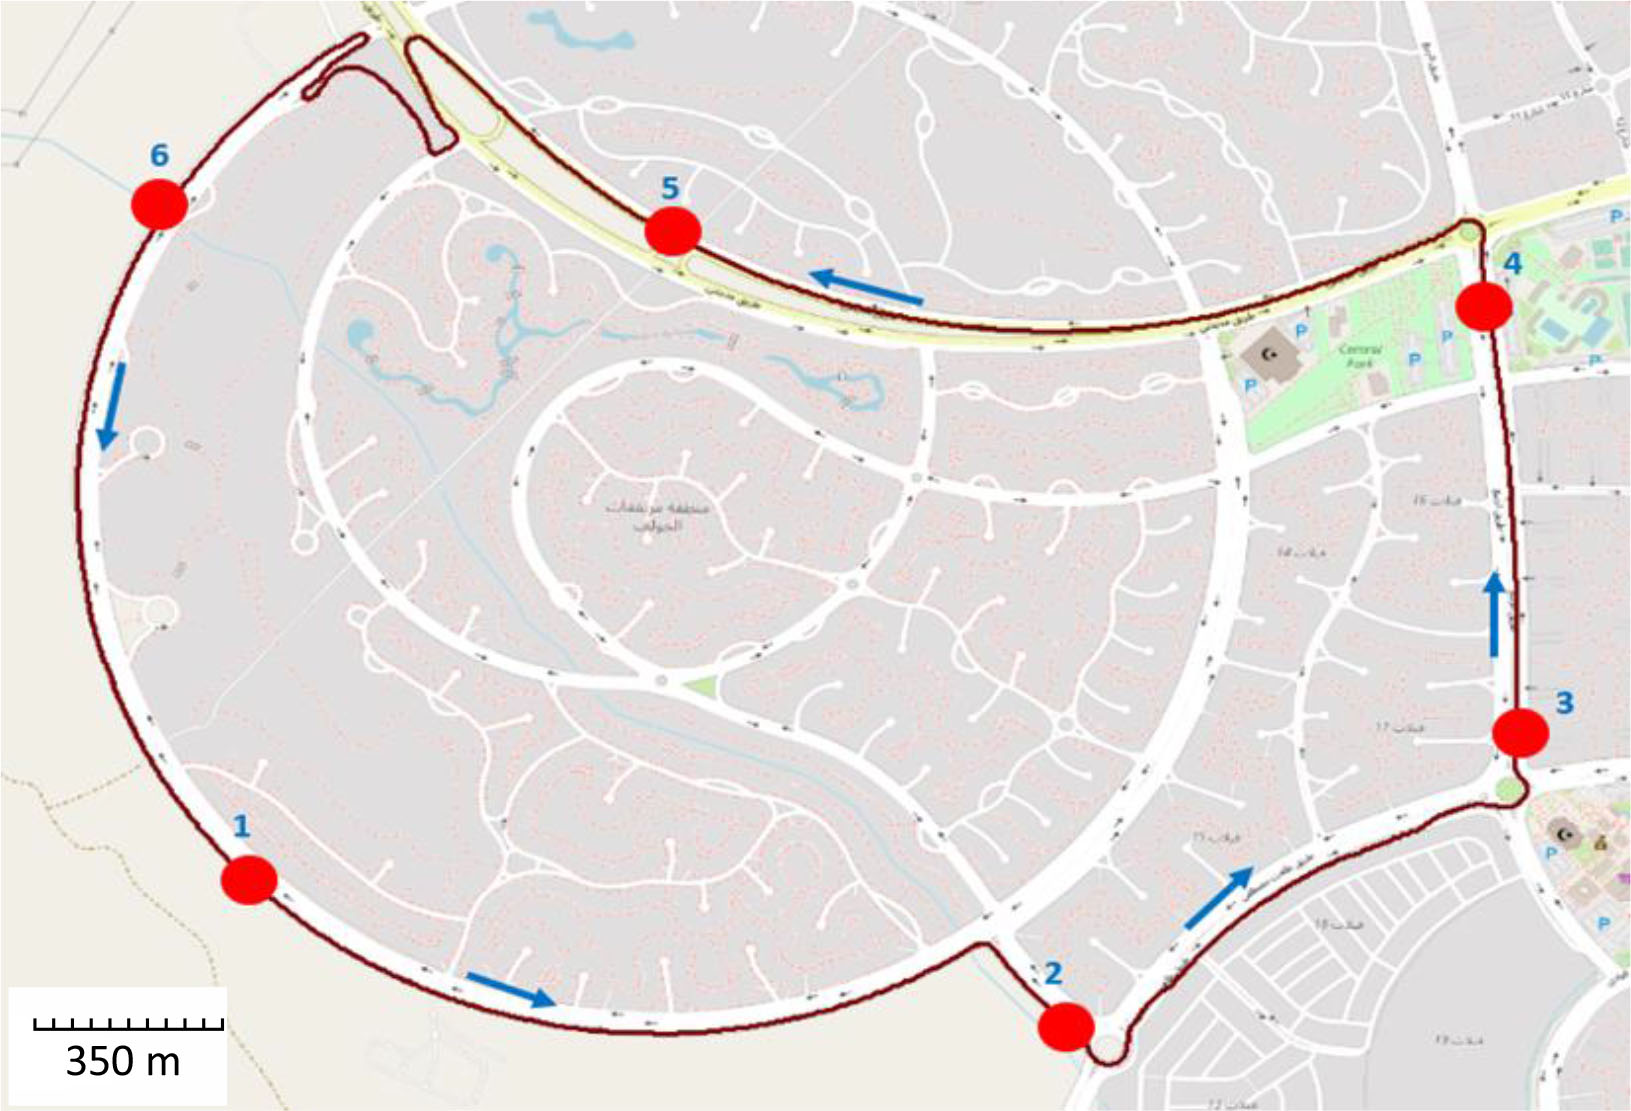
Figure 7.
Trajectory layout plan marked with the simulated locations of outages
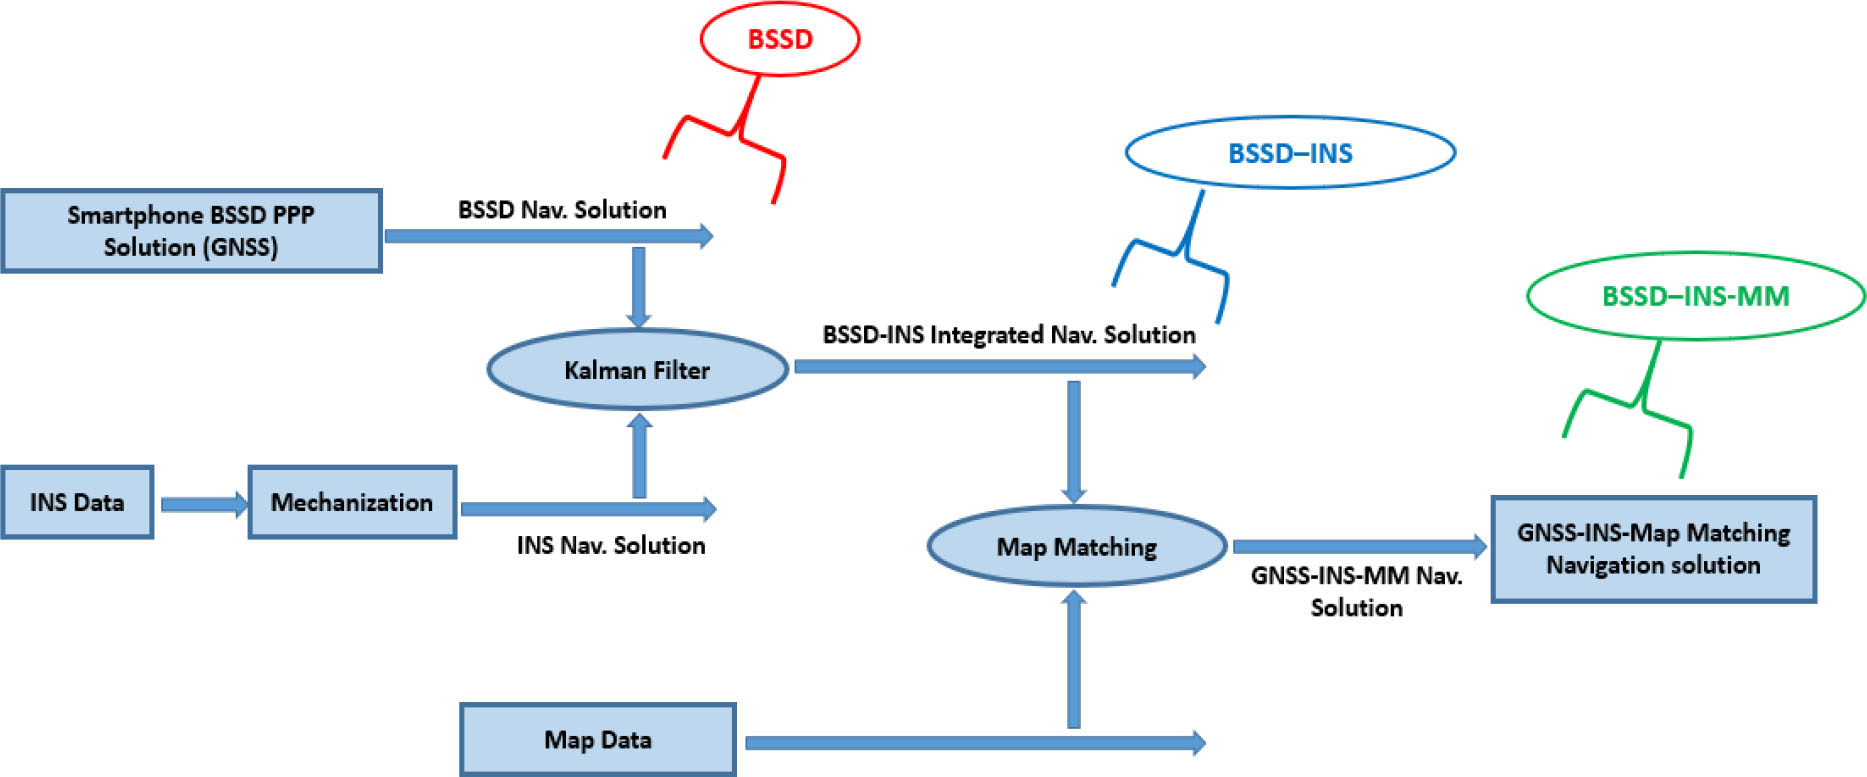
Figure 8.
Block diagram of GPS–INS–map matching navigation solution
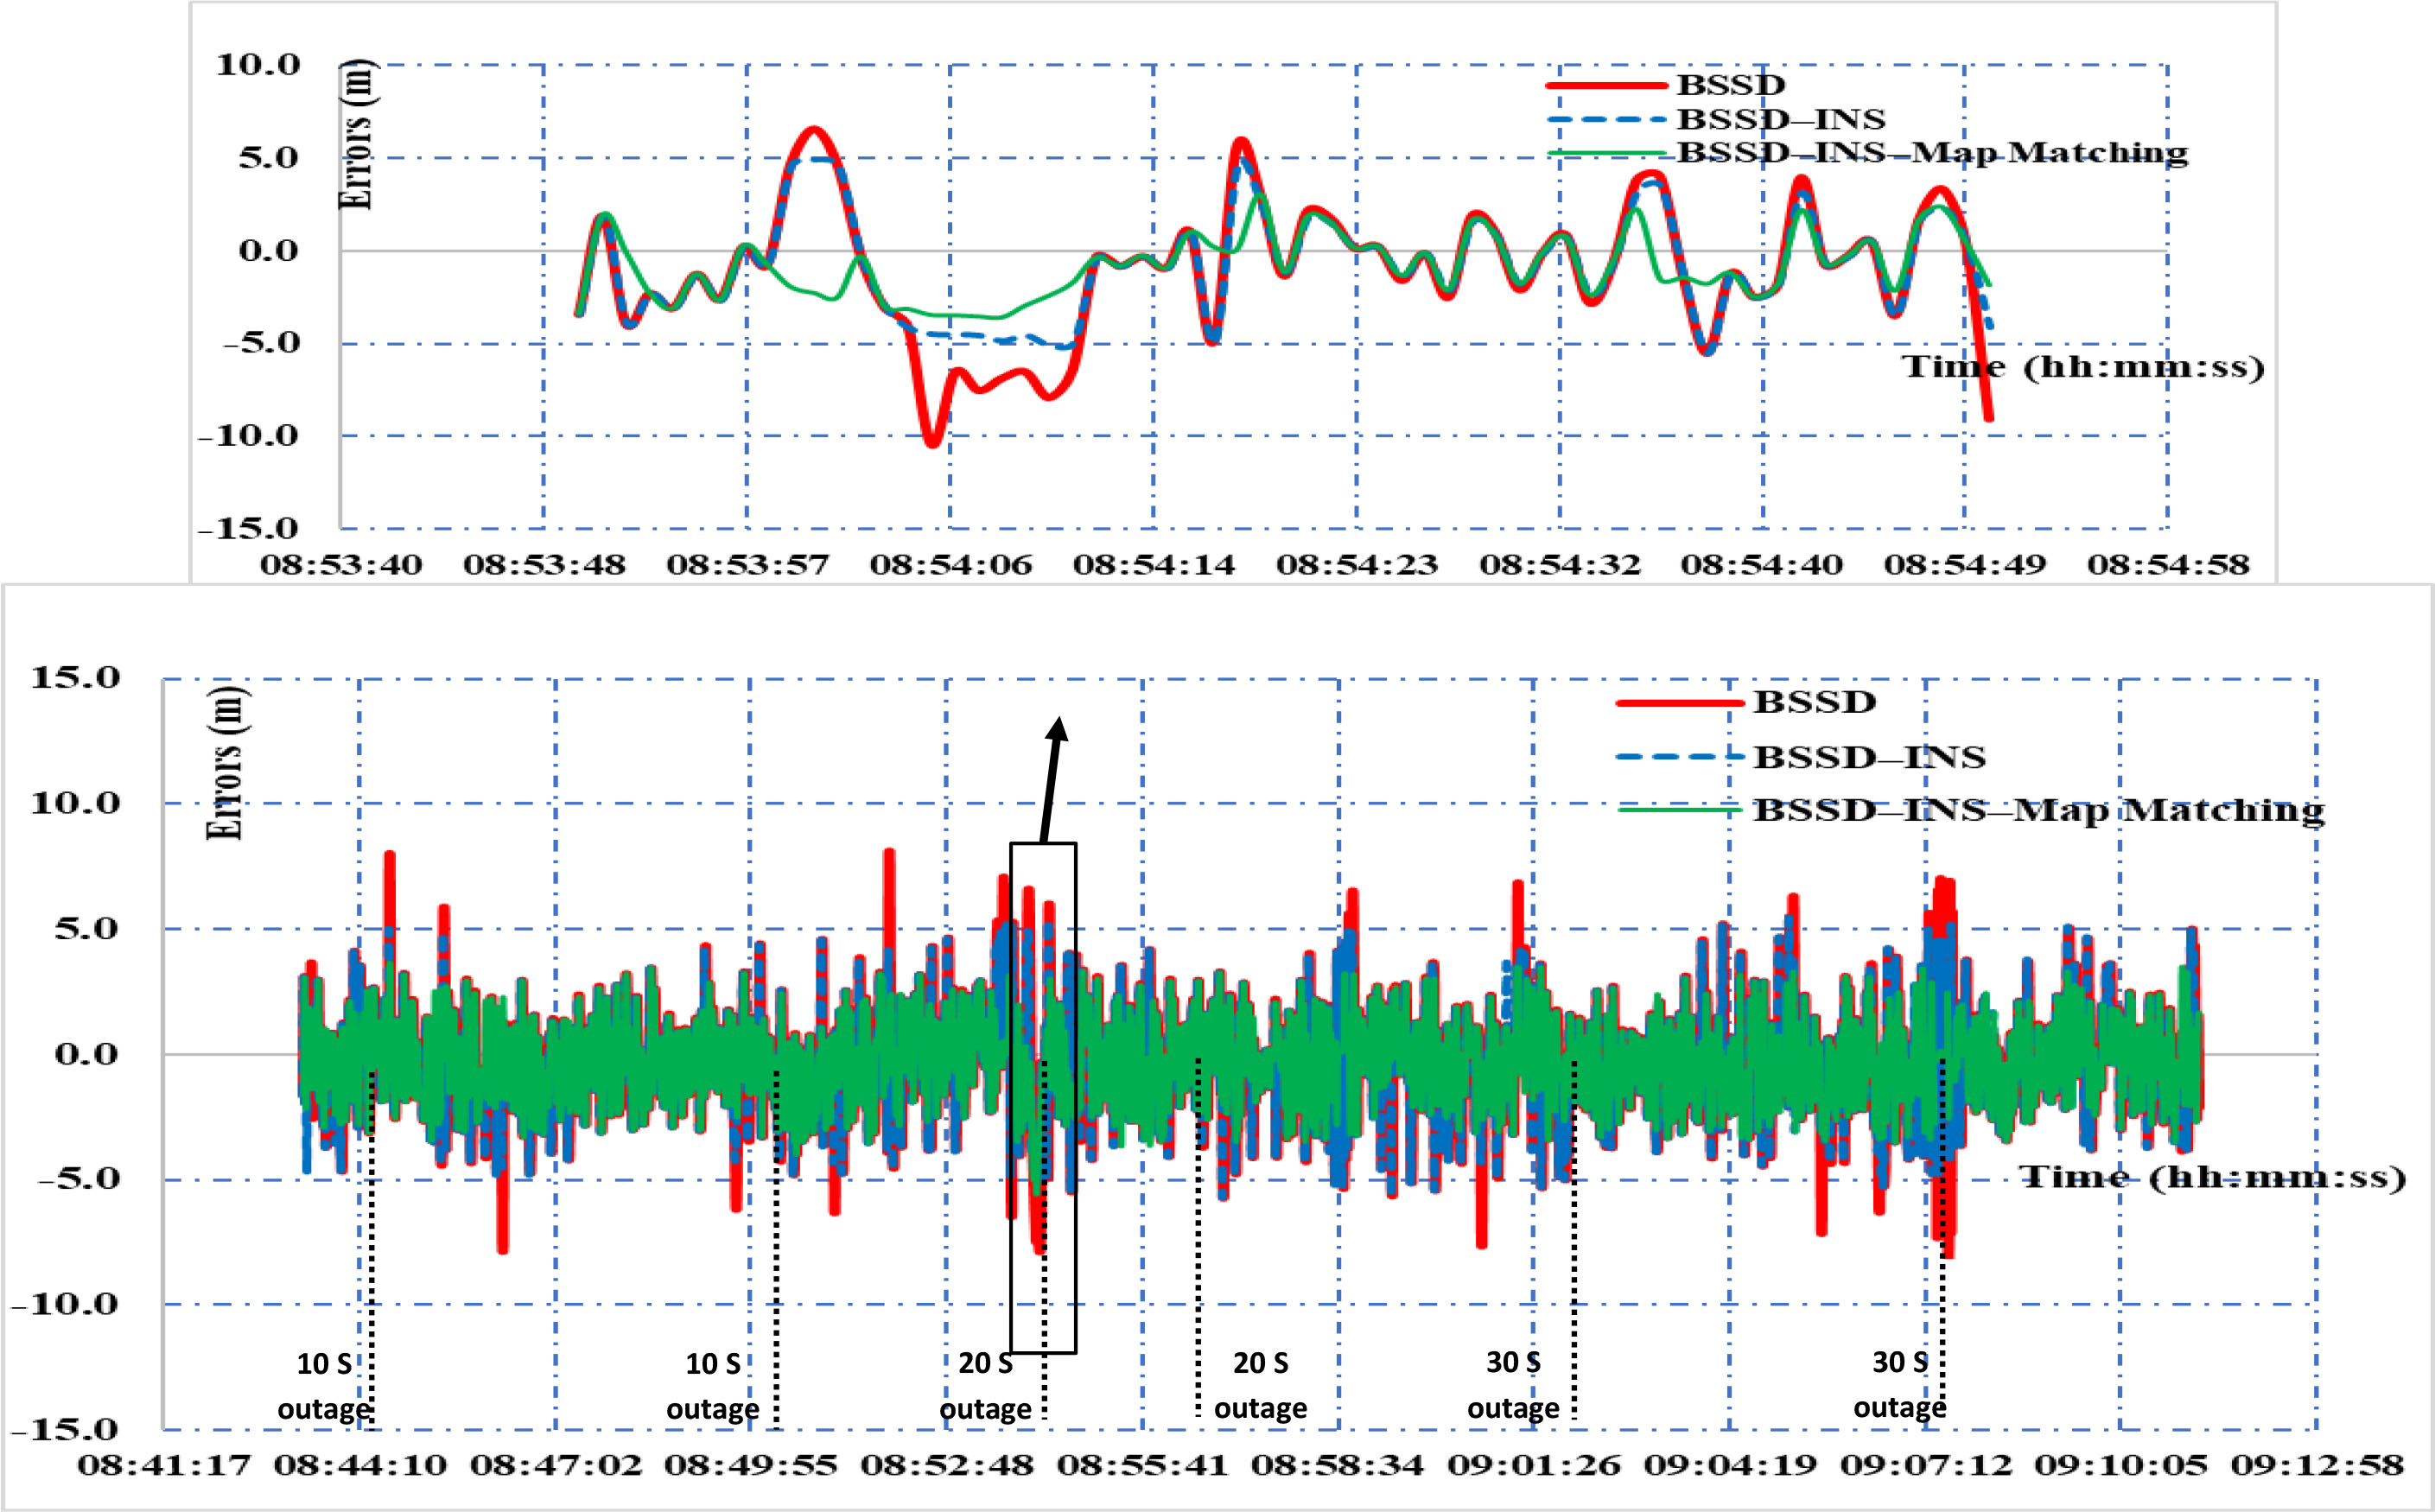
Figure 9.
Easting direction solutions without simulated outages (lower figure) and easting solution focused at 1 min (upper figure)
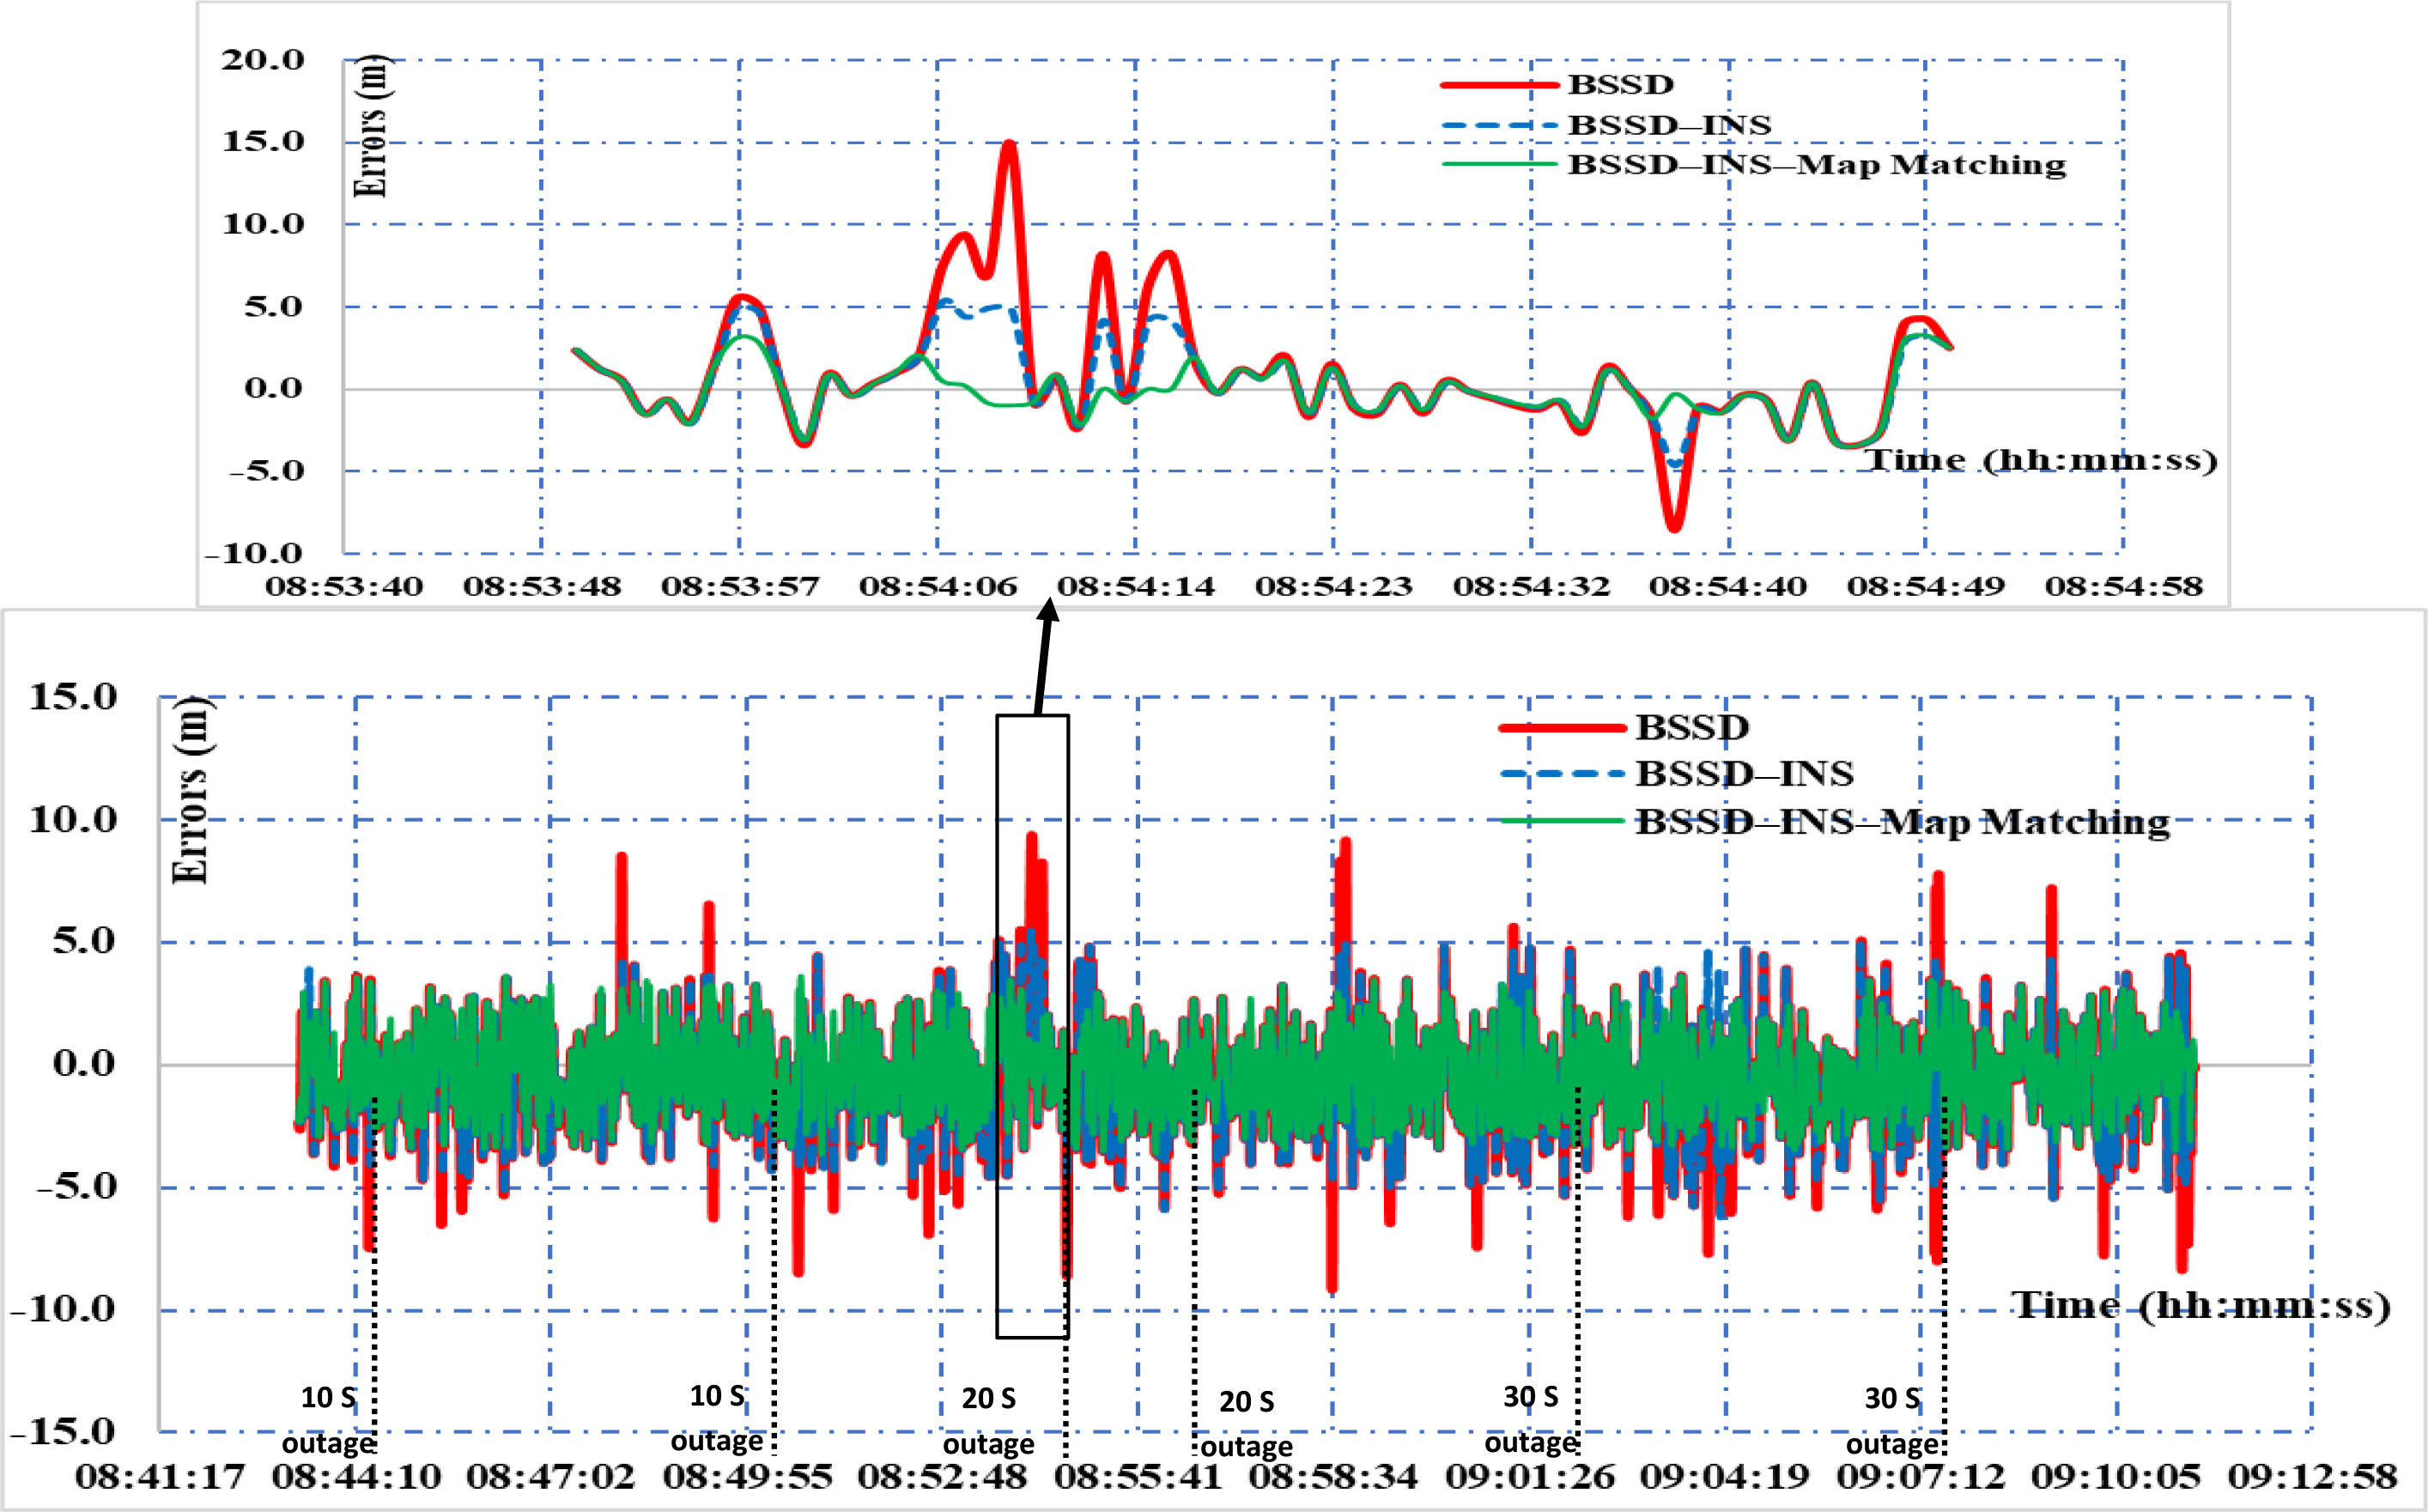
Figure 10.
Northing direction solutions without simulated outages (lower figure) and northing solution focused at 1 min (upper figure)
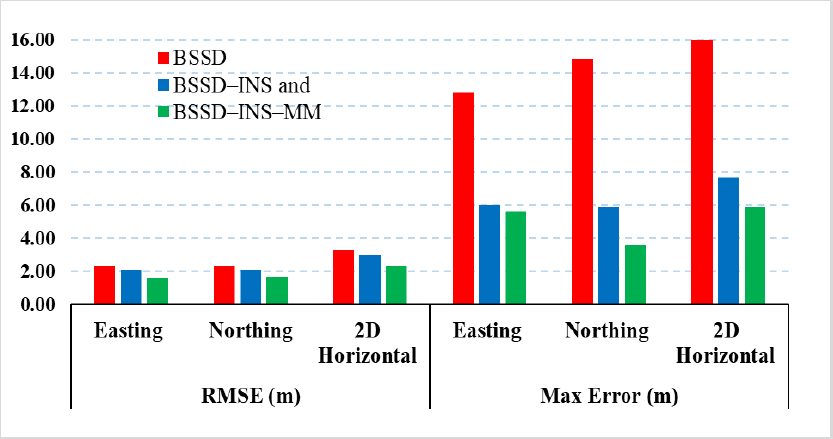
Figure 11.
Analysis of RMSE and maximum error for BSSD, BSSD–INS and BSSD–INS–MM tracks
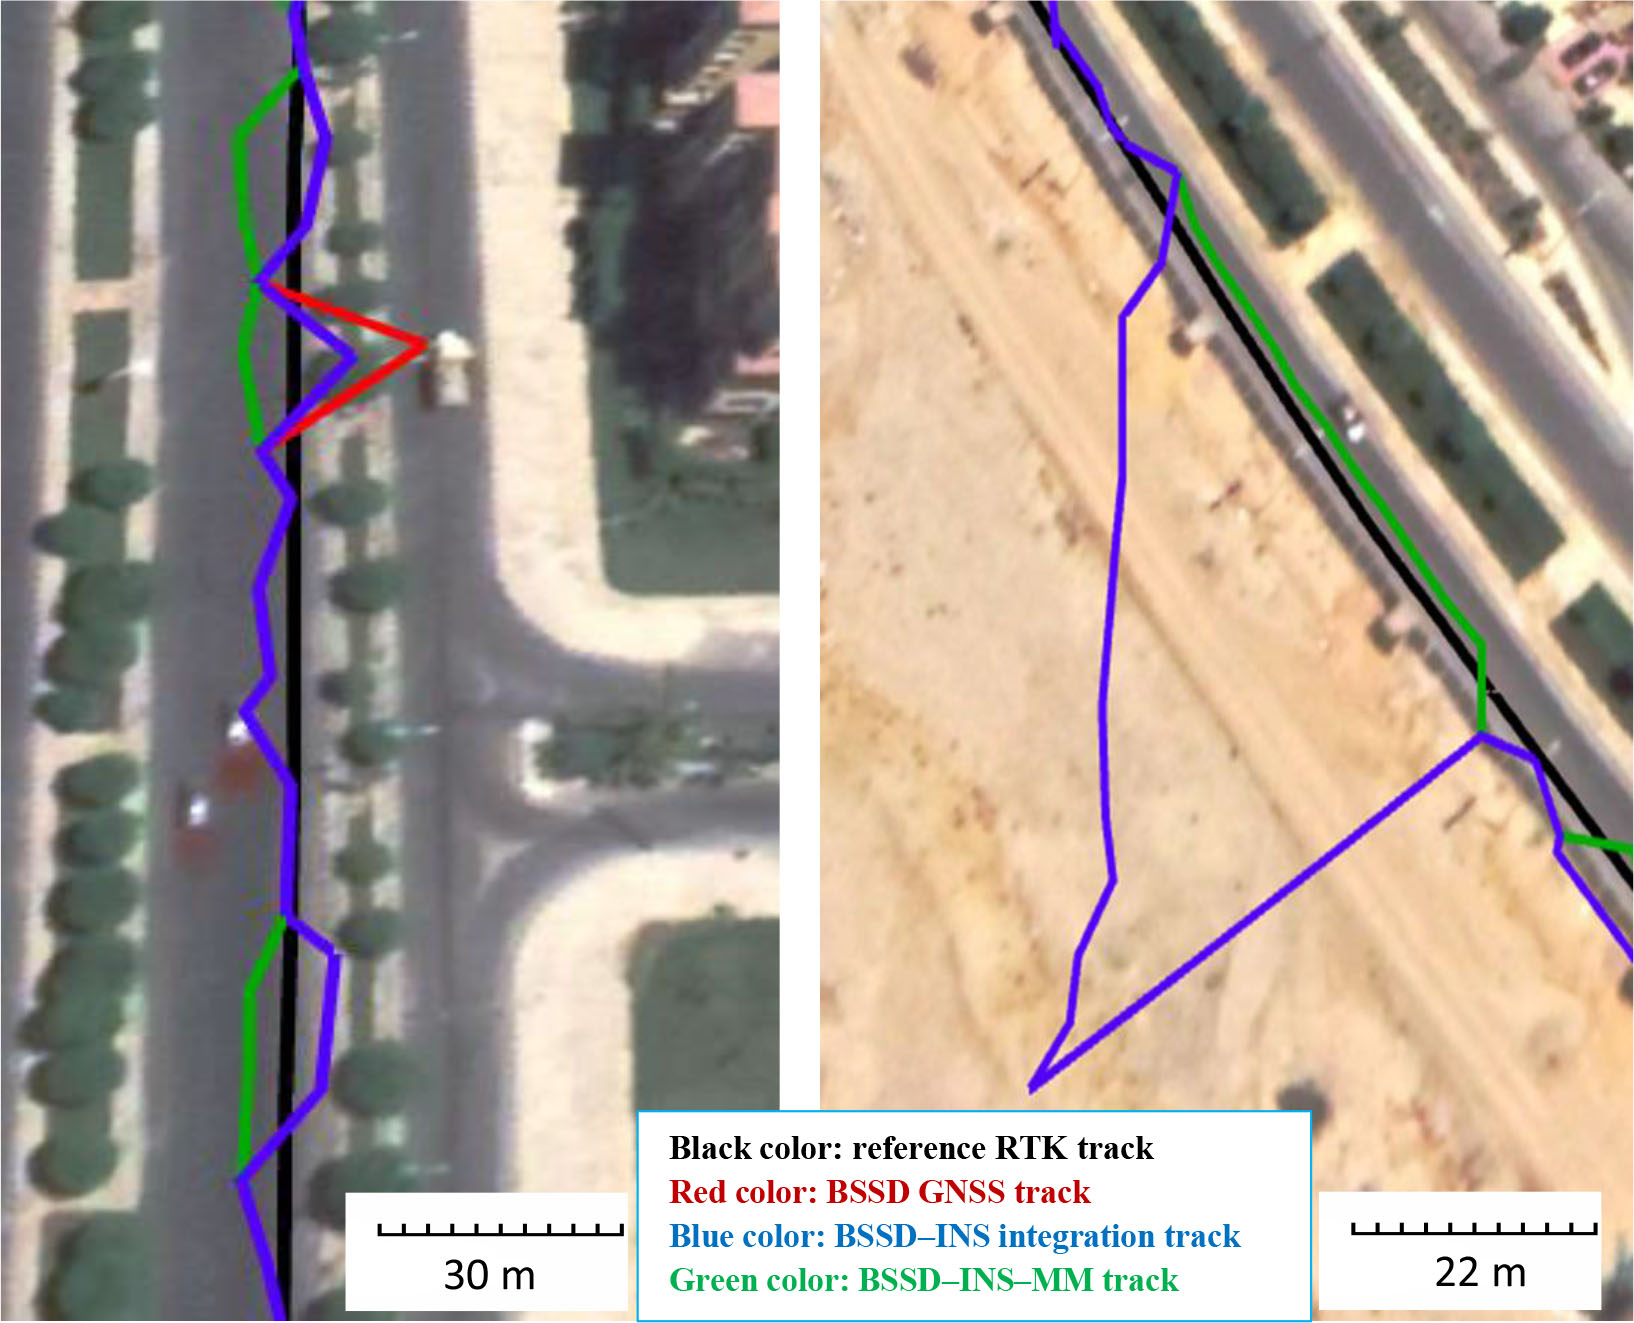
Figure 12.
Part of the resulting layouts of tracks solution with the reference track (left) and layouts of tracks solution at GNSS signal outage No. 1 (right)
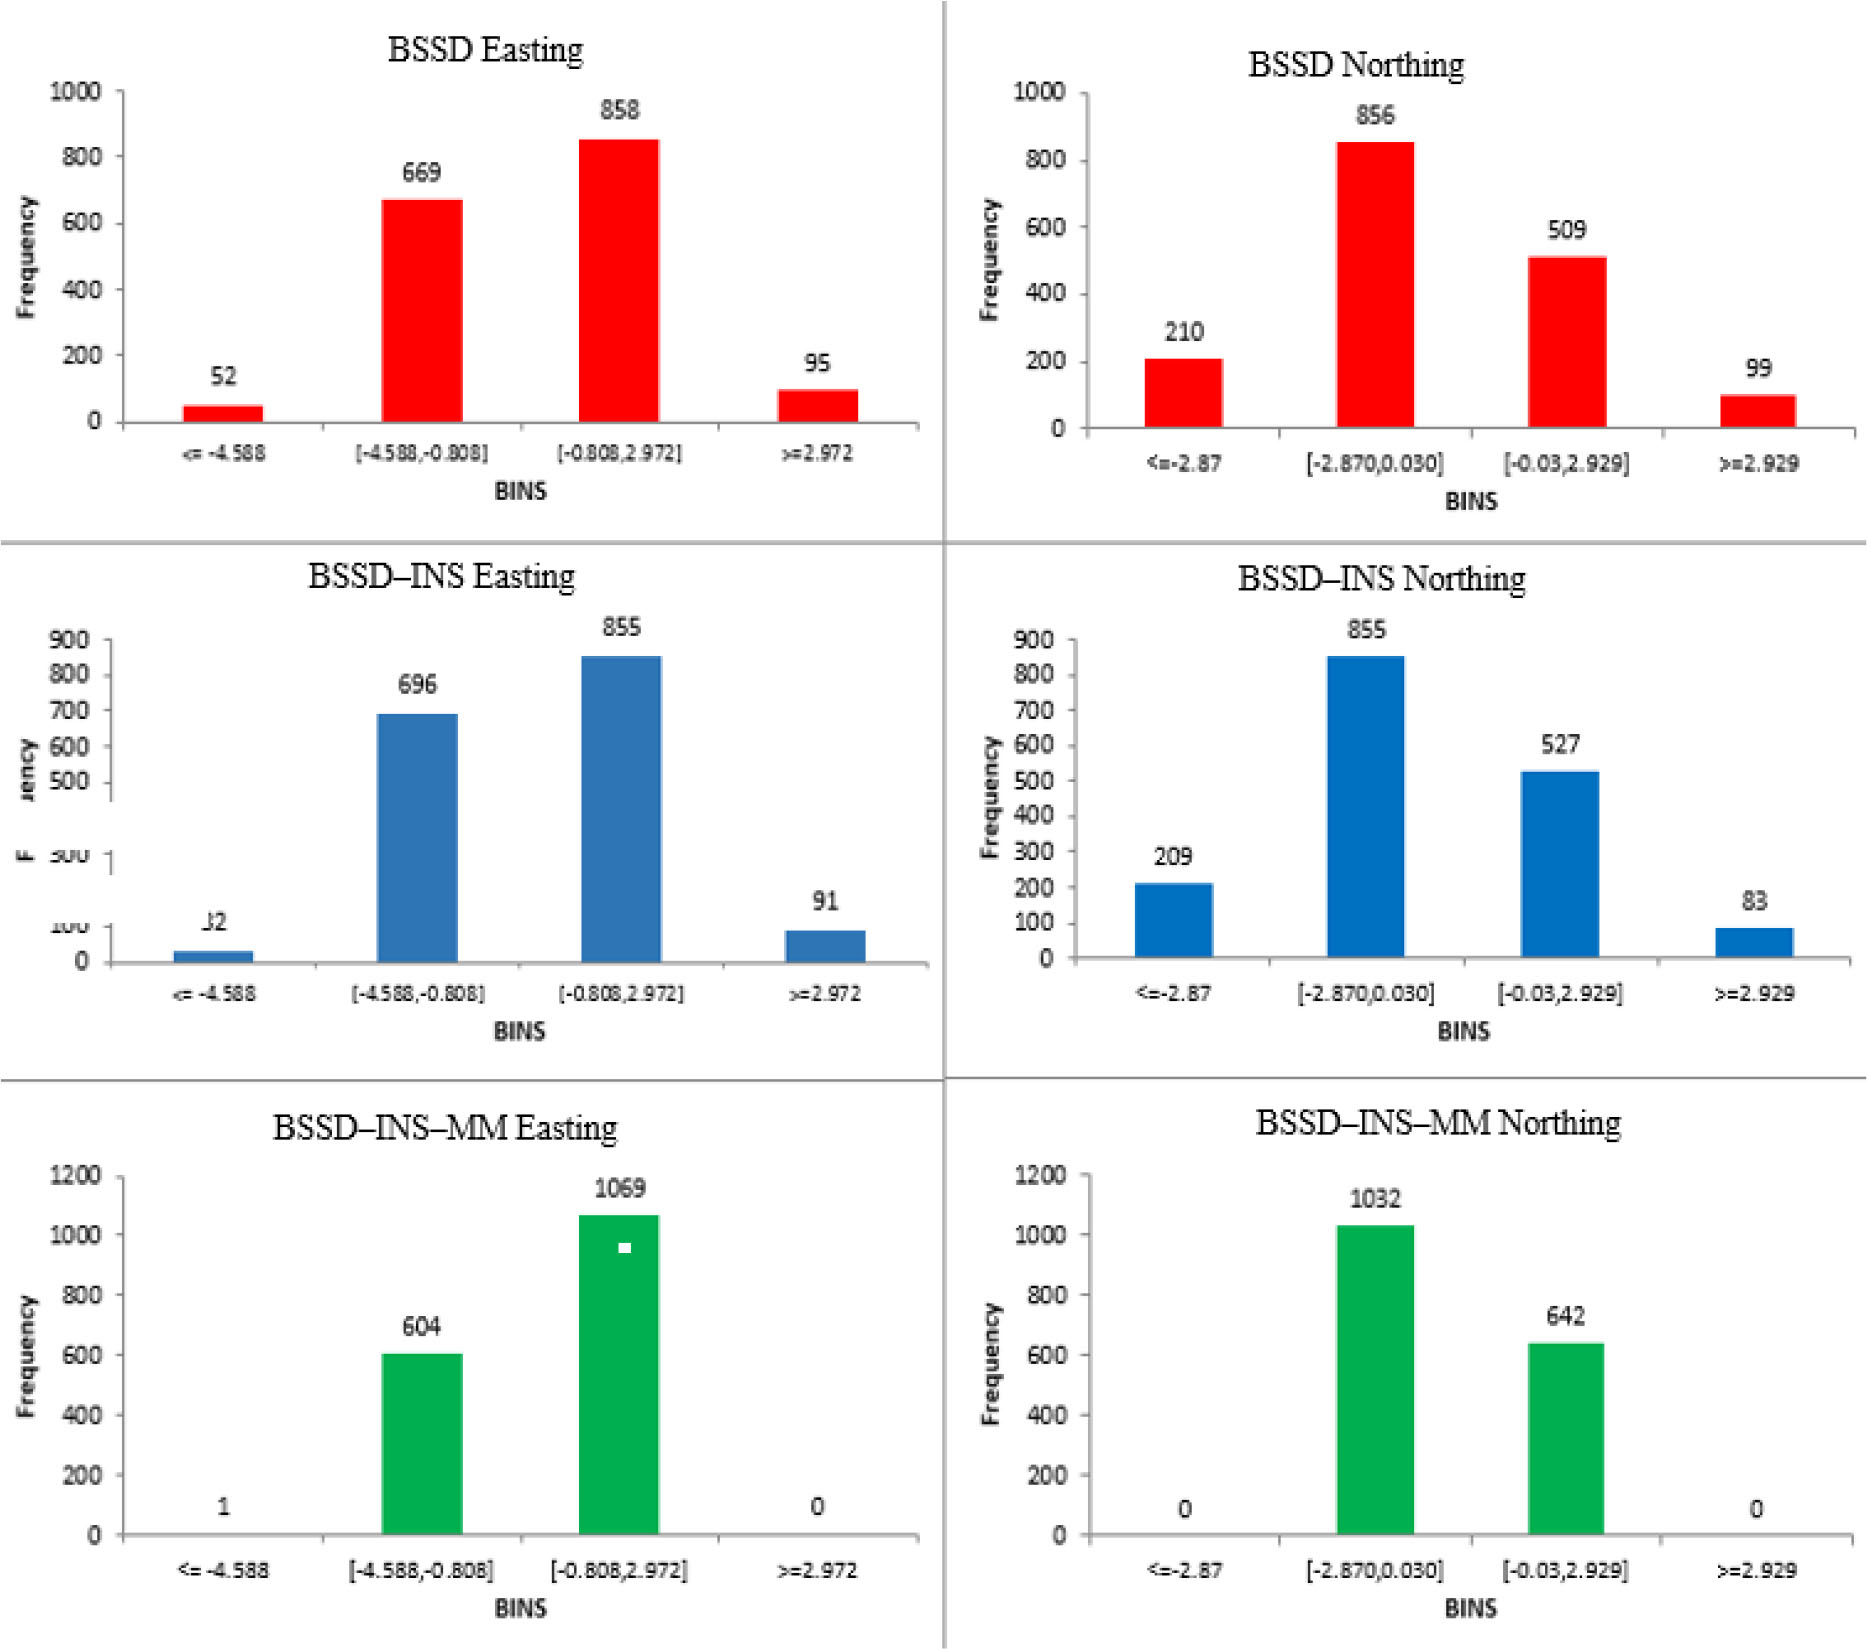
Figure 13.
Positioning error histograms for BSSD, BSSD–INS, and BSSD–INS–MM solutions in easting and northing directions
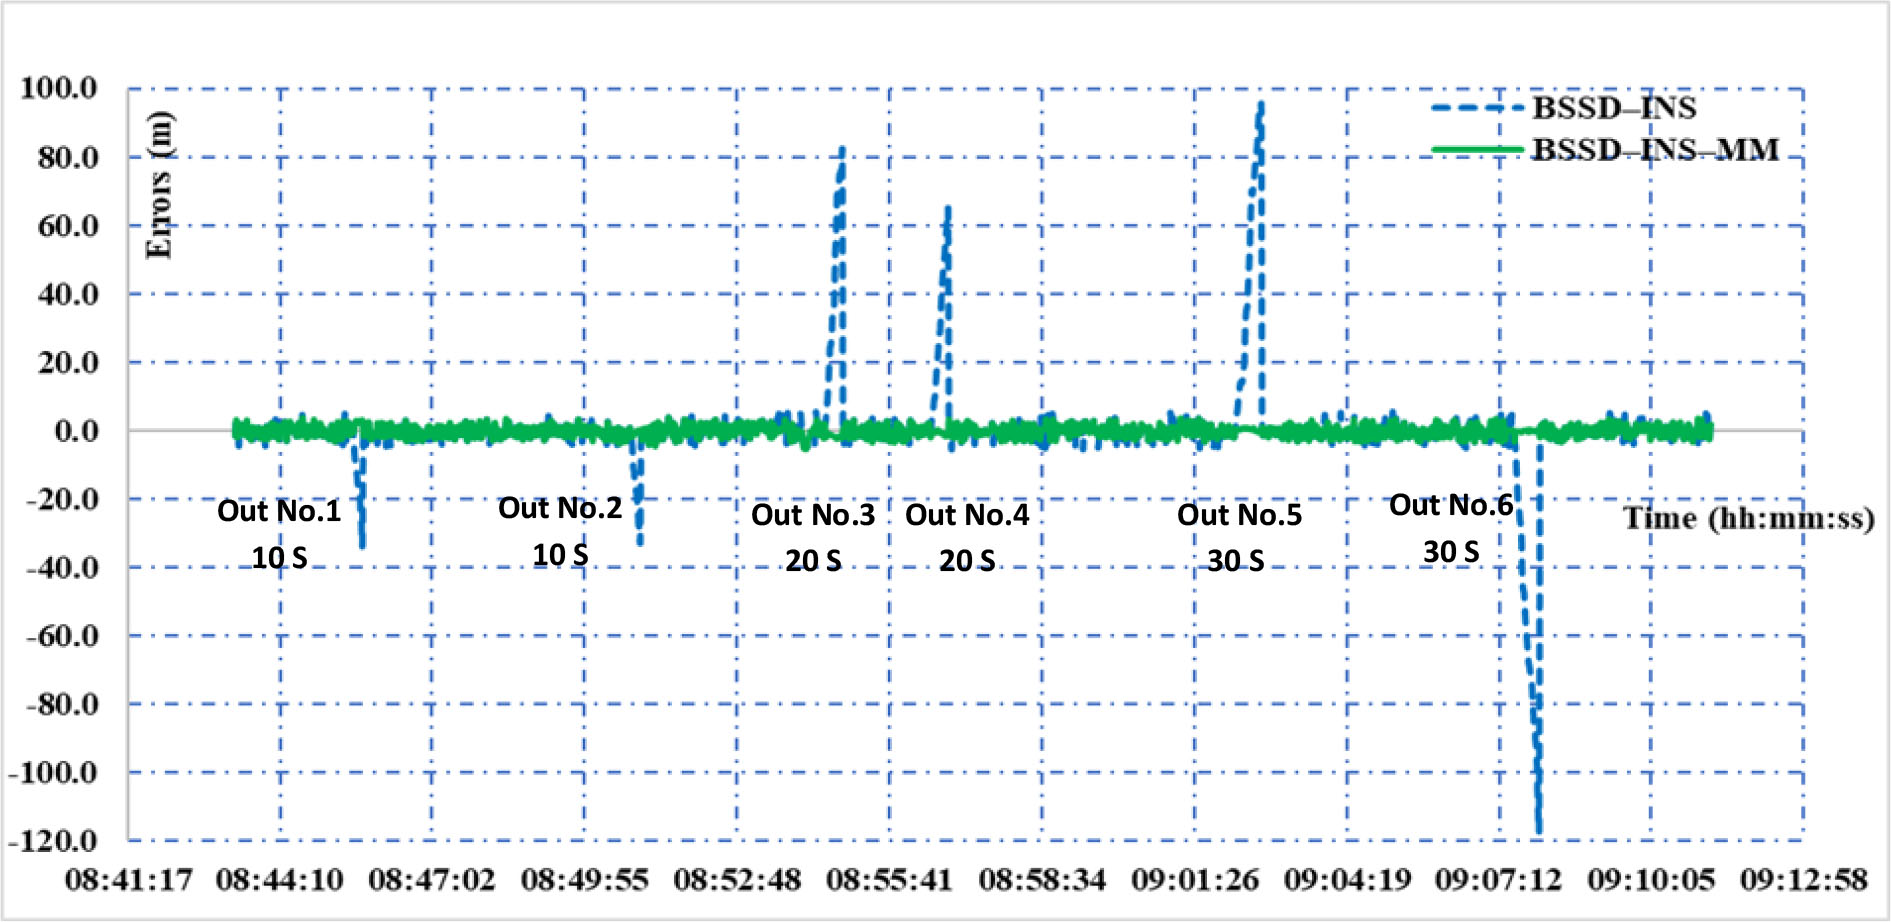
Figure 14.
Easting direction solutions of the BSSD–INS integration and BSSD–INS–MM tracks with simulated outages
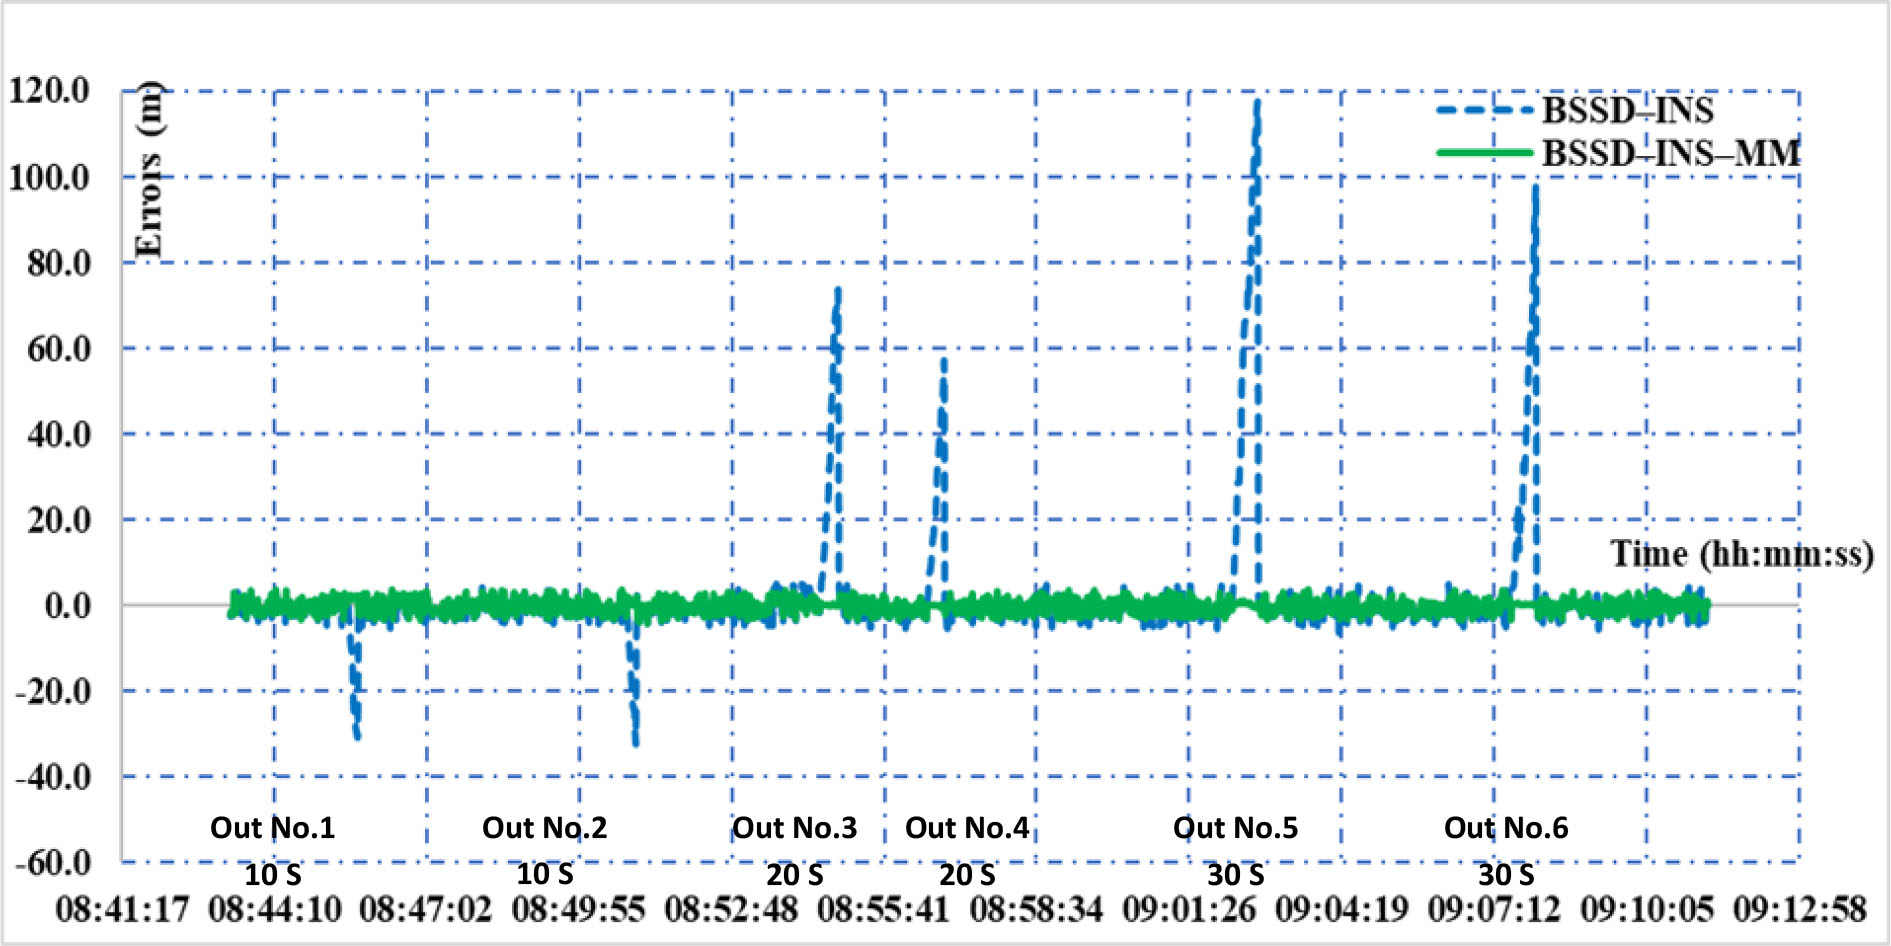
Figure 15.
Northing direction solutions of the BSSD–INS integration and BSSD–INS–MM tracks with simulated outages
Table 1.
Maximum error for BSSD–INS and BSSD–INS–MM tracks at the inserted outages
| Solution | Maximum error (m)_ UTM datum | Improvement % | |||||
|---|---|---|---|---|---|---|---|
| BSSD–INS | BSSD–INS–MM | ||||||
| Outages | Easting | Northing | 2D Hz | Easting | Northing | 2D Hz | 2D Hz |
| 1 | 33.47 | 30.45 | 45.25 | 2.98 | 2.50 | 3.74 | 92 |
| 2 | 32.70 | 31.80 | 45.61 | 3.00 | 3.46 | 4.58 | 90 |
| 3 | 81.96 | 73.42 | 110.04 | 2.57 | 2.49 | 3.11 | 97 |
| 4 | 64.76 | 56.70 | 86.08 | 3.22 | 3.13 | 3.97 | 95 |
| 5 | 95.52 | 117.28 | 151.25 | 2.20 | 2.55 | 3.29 | 98 |
| 6 | 117.23 | 97.25 | 152.31 | 3.37 | 3.50 | 4.86 | 97 |
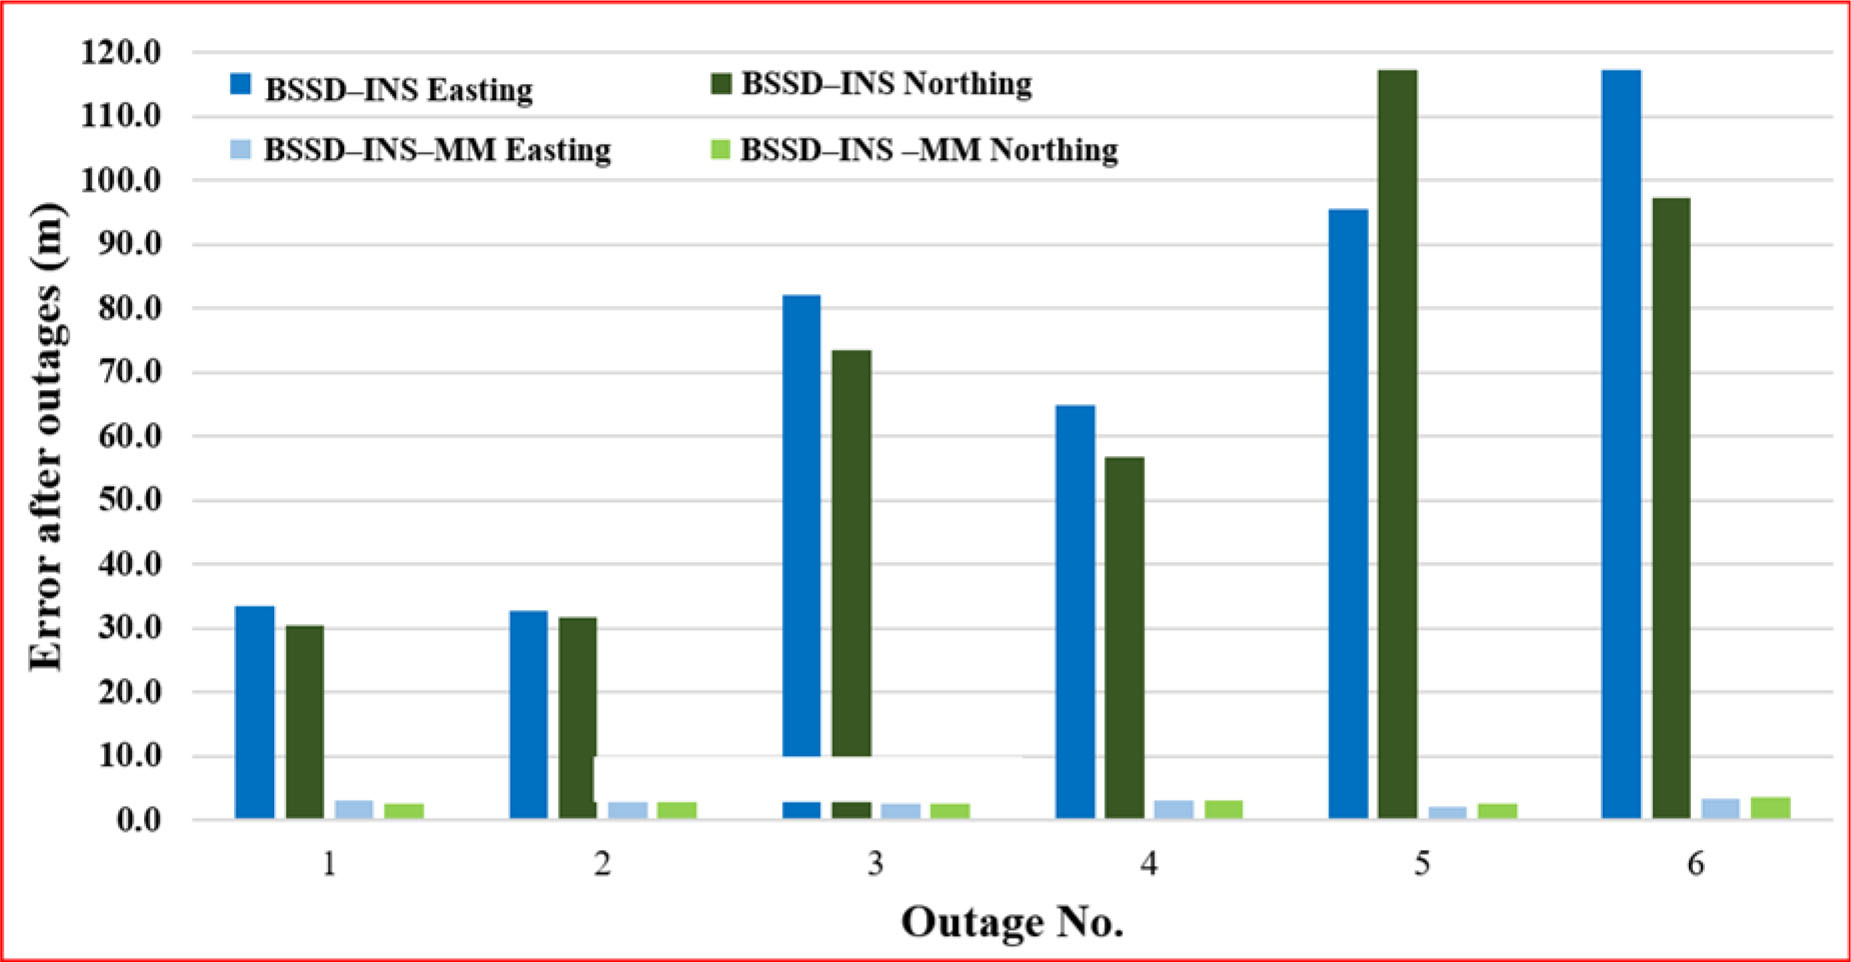
Figure 16.
Analysis of maximum error for BSSD–INS and BSSD–INS–MM tracks at the inserted outages
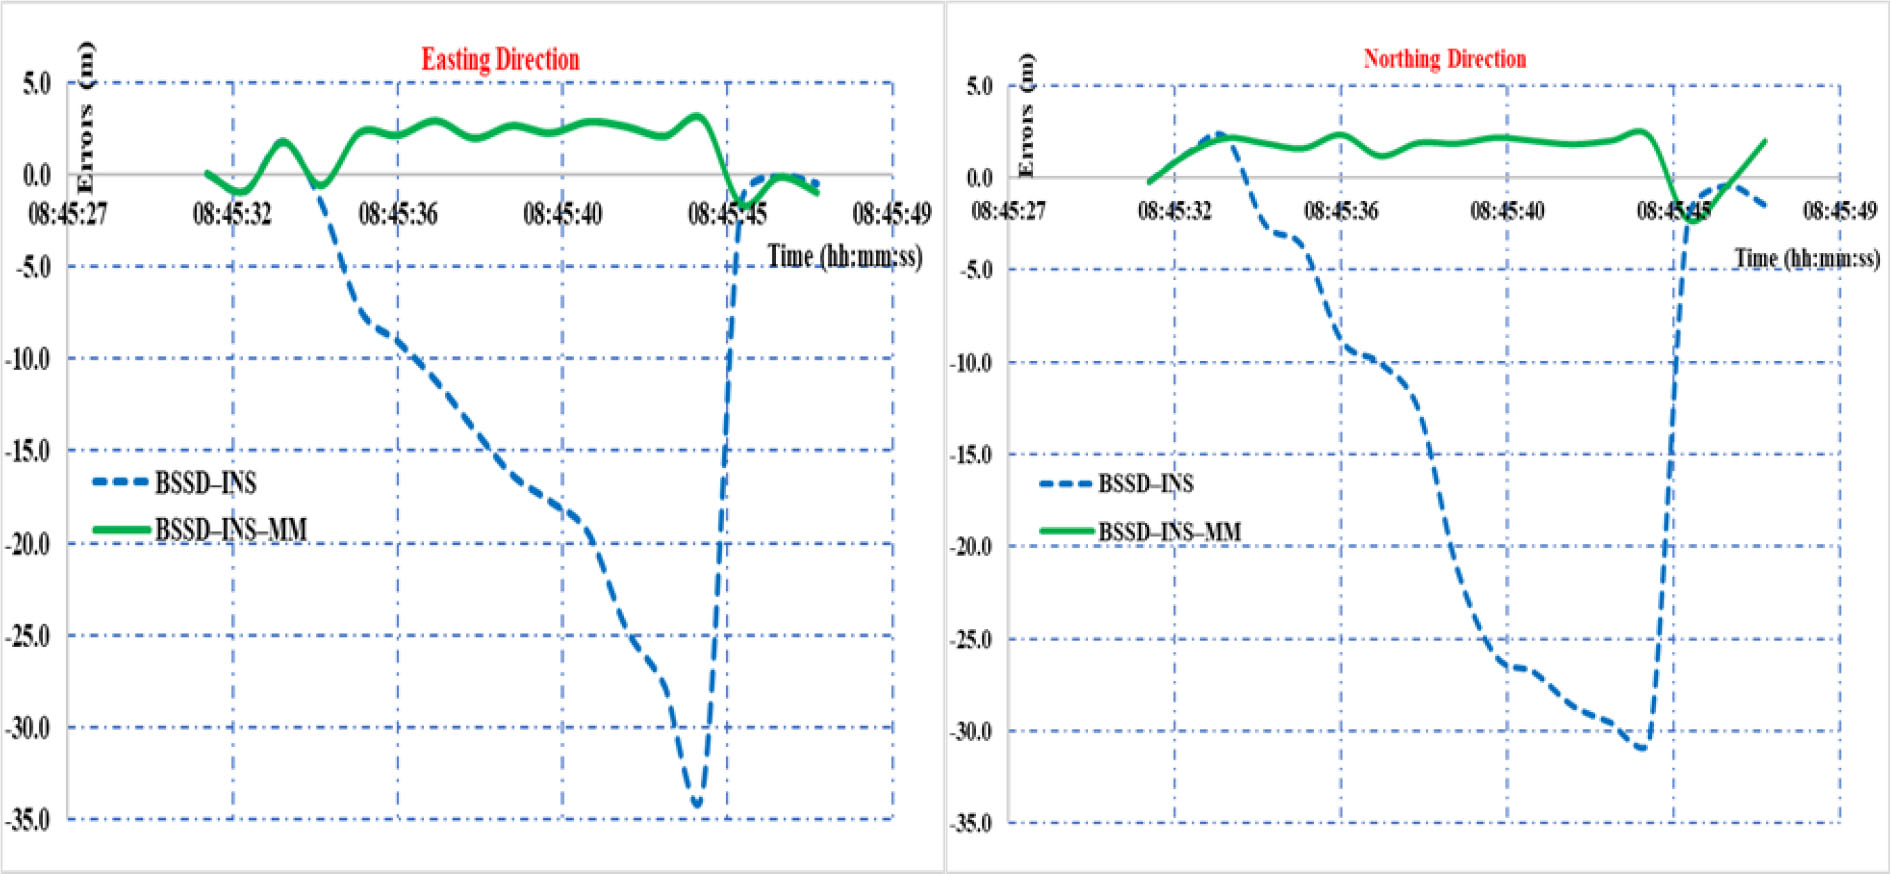
Figure 17.
Easting and northing position errors for BSSD–INS and BSSD–INS–MM tracks solutions during simulated outage No. 1