
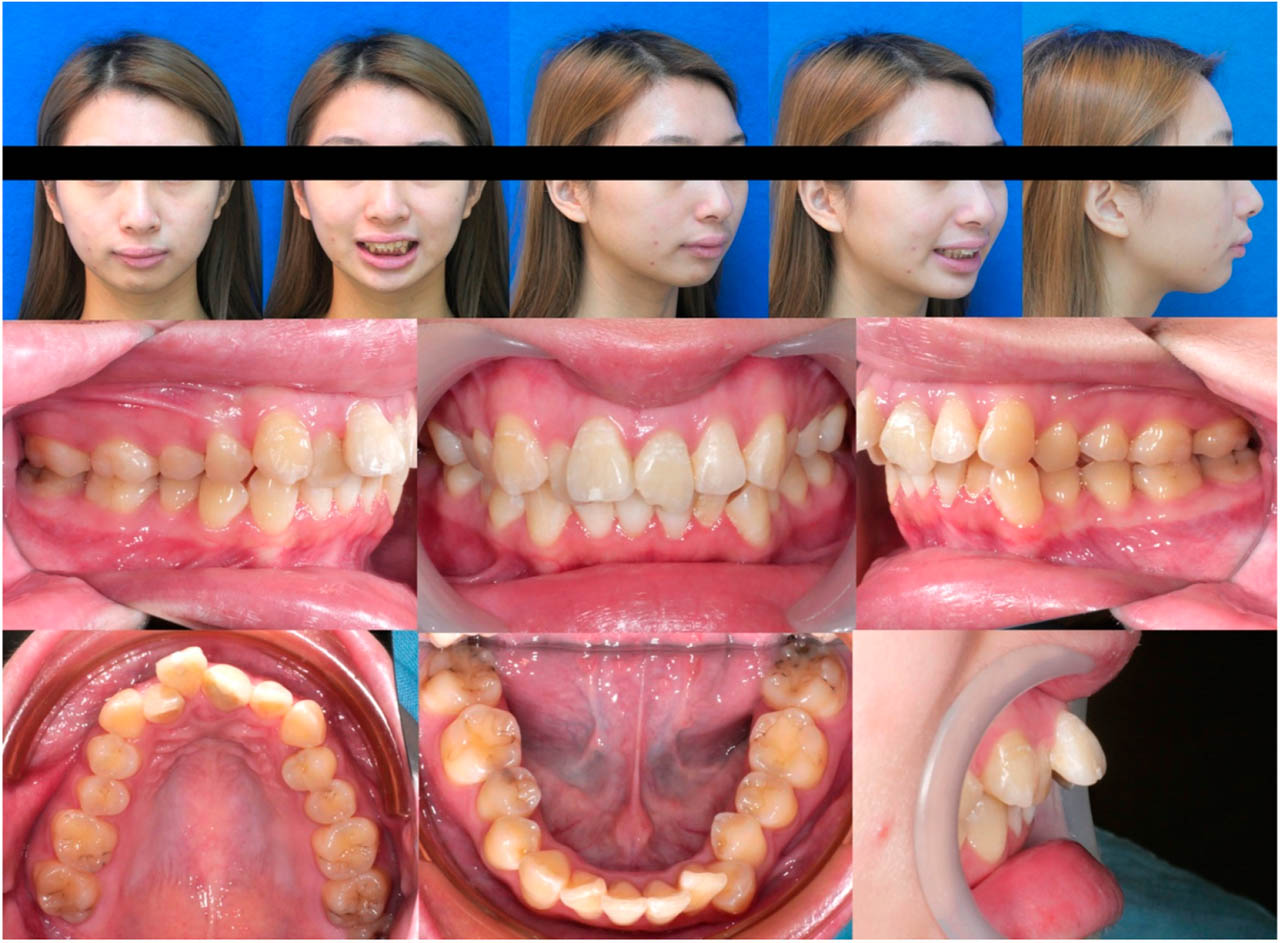
Figure 1.
Initial extraoral and intraoral photographs before comprehensive orthodontic treatment.
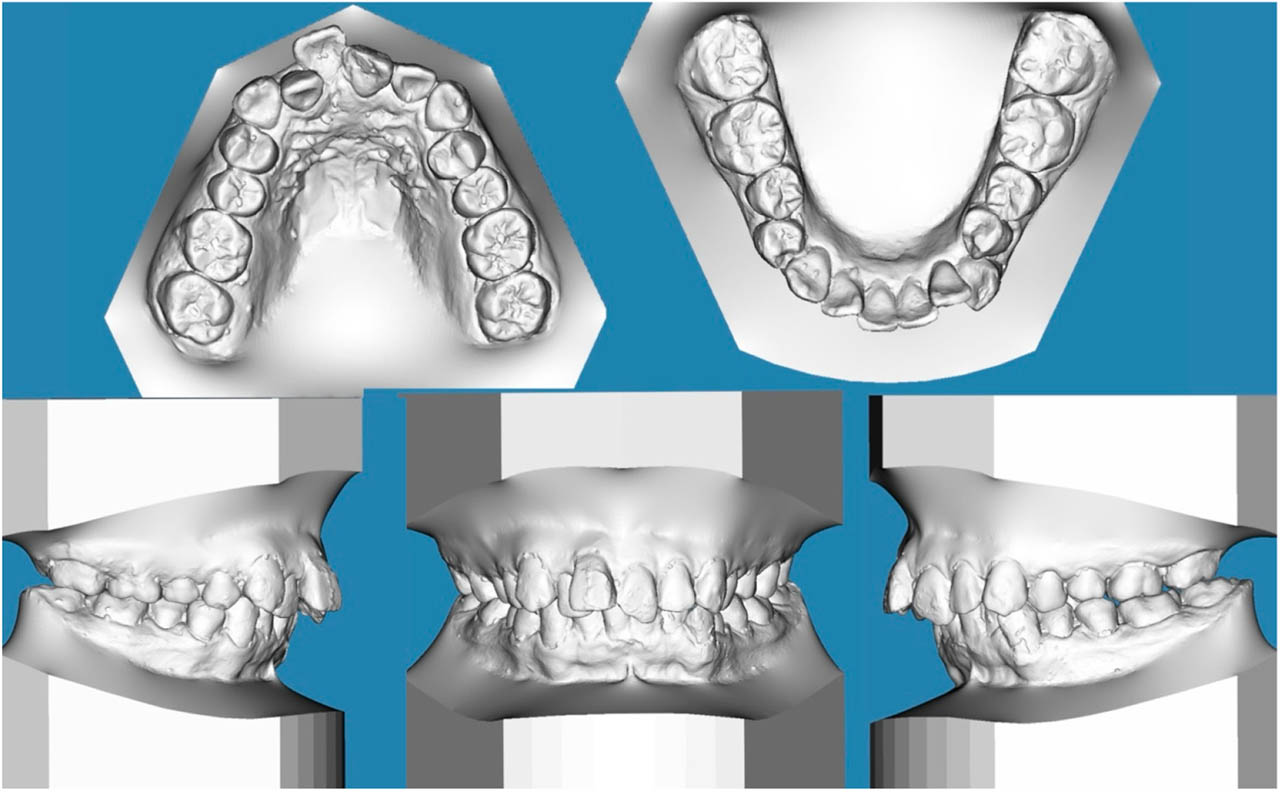
Figure 2.
Initial digital study model.
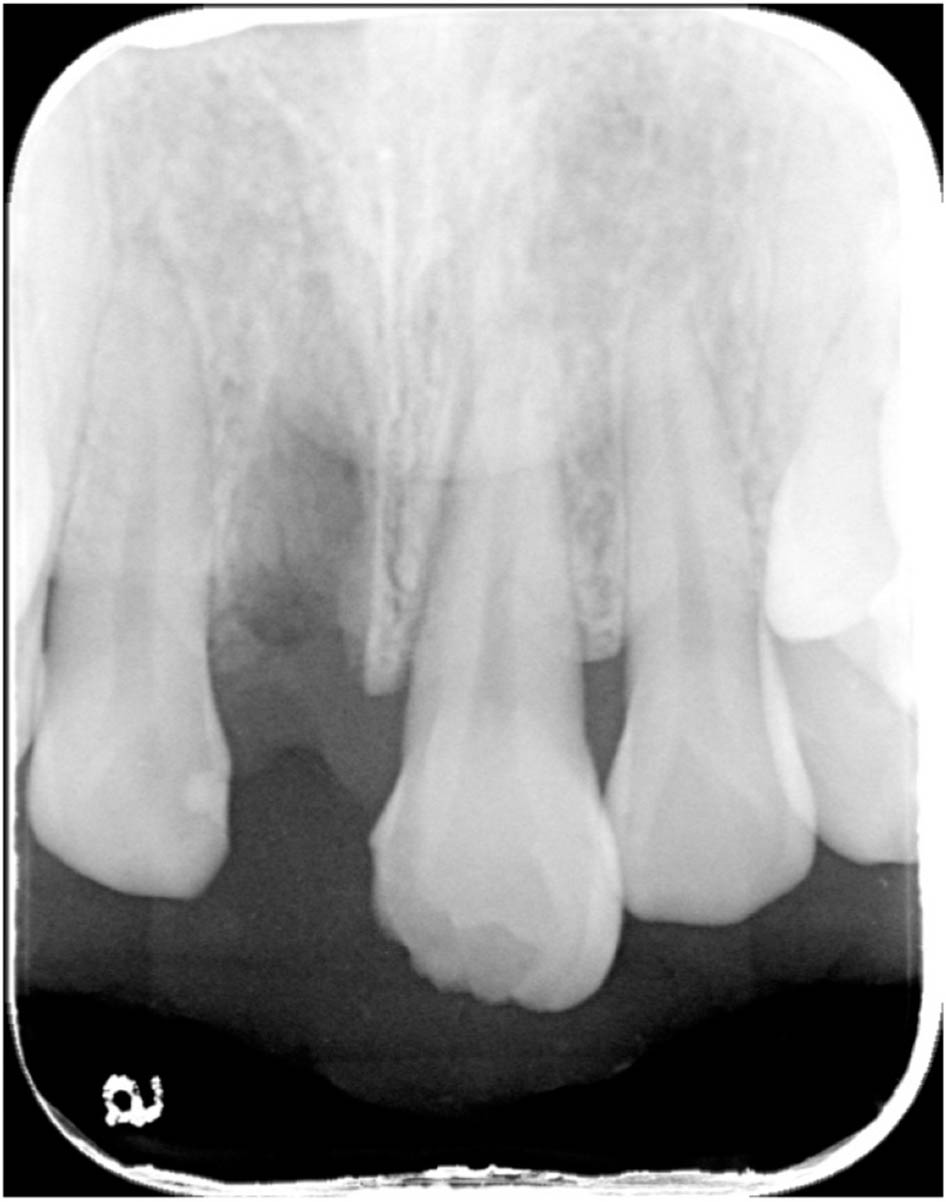
Figure 3.
Periapical radiograph showing tooth 11 avulsion before repositioning and an uncomplicated crown fracture of tooth 21.
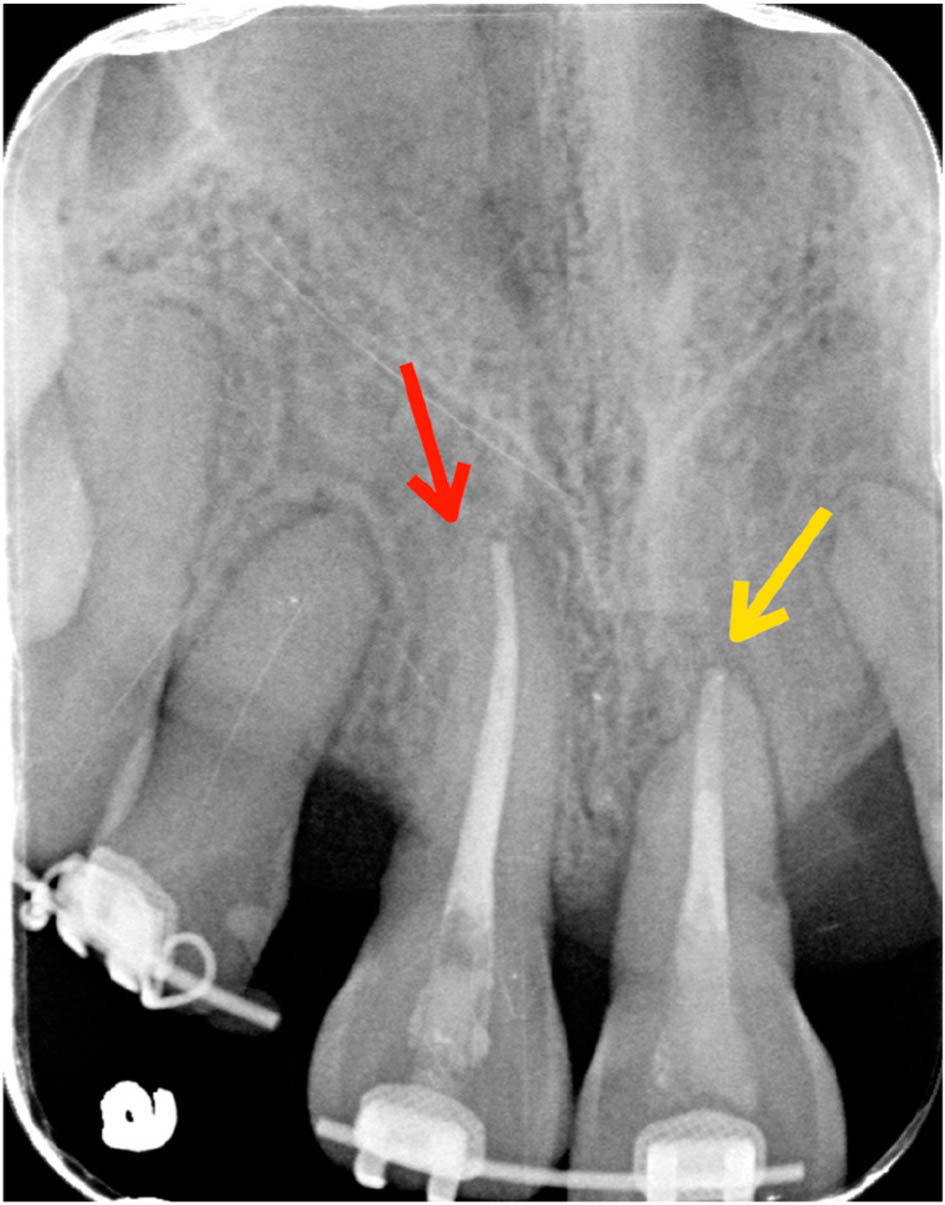
Figure 4.
Preoperative periapical radiograph showing tooth 11 with absence of a periodontal ligament space (red arrow) and external root resorption of tooth 21 (yellow arrow).
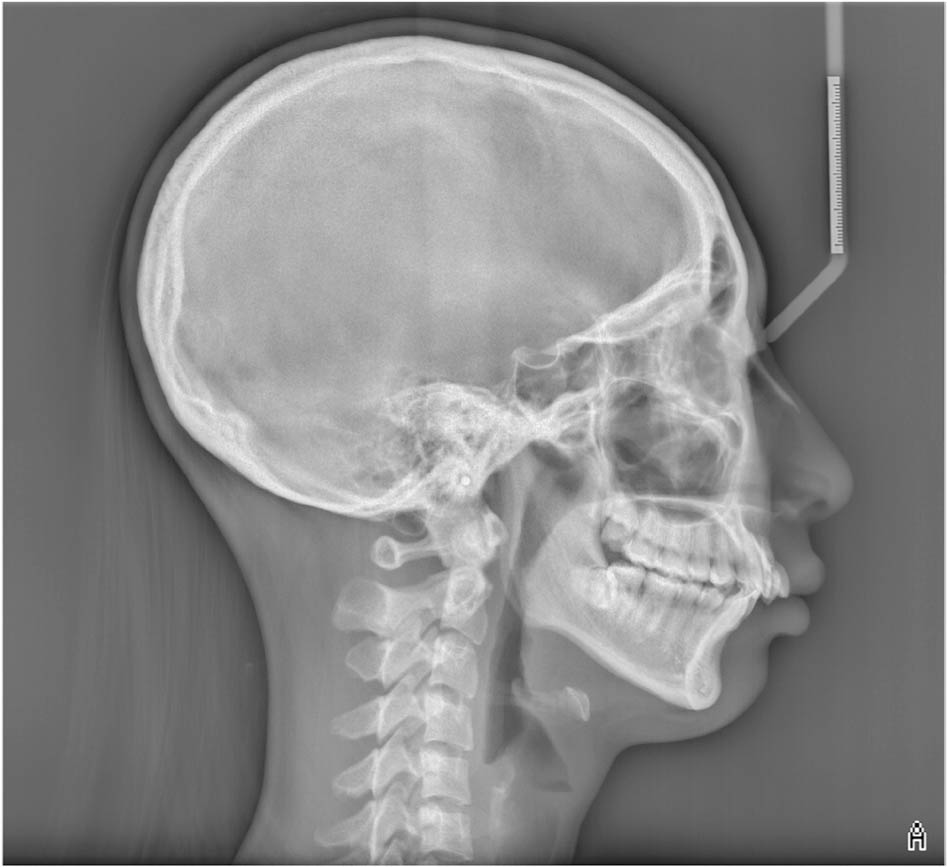
Figure 5.
Initial cephalometric radiograph.
TABLE I.
Initial and posttreatment cephalometric measurements
| 15–30 y/o, female | Taiwanese norm | Initial | Final | Change |
|---|---|---|---|---|
| Skeletal | ||||
| SNA (°) | 79.7 ~ 86.1 | 82.5 | 80.0 | −2.5 |
| SNB (°) | 77.6 ~ 83.7 | 72.5 | 74.5 | +2.0 |
| ANB (°) | 0.7 ~ 3.8 | 10.0 | 5.5 | −4.5 |
| SN-MP (°) (Gn-Go) | 25.5 ~ 34.5 | 39.7 | 36.1 | −3.6 |
| FMA (°) | 26.0 ~ 34.1 | 31.0 | 26.7 | −4.3 |
| Dental | ||||
| U1 - SN (°) | 102.2 ~ 115.1 | 107.0 | 102.5 | −4.5 |
| U1 - NA (mm) | 3.2 ~ 7.3 | 5.2 | 1.4 | −3.8 |
| L1 - MP (°) (Gn-Go) | 90.5 ~ 103.1 | 104.0 | 110.0 | +6.0 |
| L1 - NB (mm) | 4.0 ~ 8.4 | 11.1 | 9.1 | −2.0 |
| Overjet (mm) | 2.0 ~ 3.0 | 8.0 | 2.0 | −6.0 |
| Overbite (mm) | 2.0 ~ 4.0 | 6.5 | 2.0 | −4.5 |
| Soft tissue | ||||
| E - line upper lip (mm) | −2.9 ~ 0.4 | 1.5 | −0.5 | −2.0 |
| E - line lower lip (mm) | −1.9 ~ 2.1 | 2.5 | −0.5 | −3.0 |
| Nasolabial angle (°) (Cm-Sn-Ls) | 103.0 ~ 119.8 | 98.5 | 106.1 | +7.6 |
| Facial convexity (°) (G′-Sn′-Pg′) | 165.0 ~ 174.8 | 154.8 | 162.8 | +8.0 |
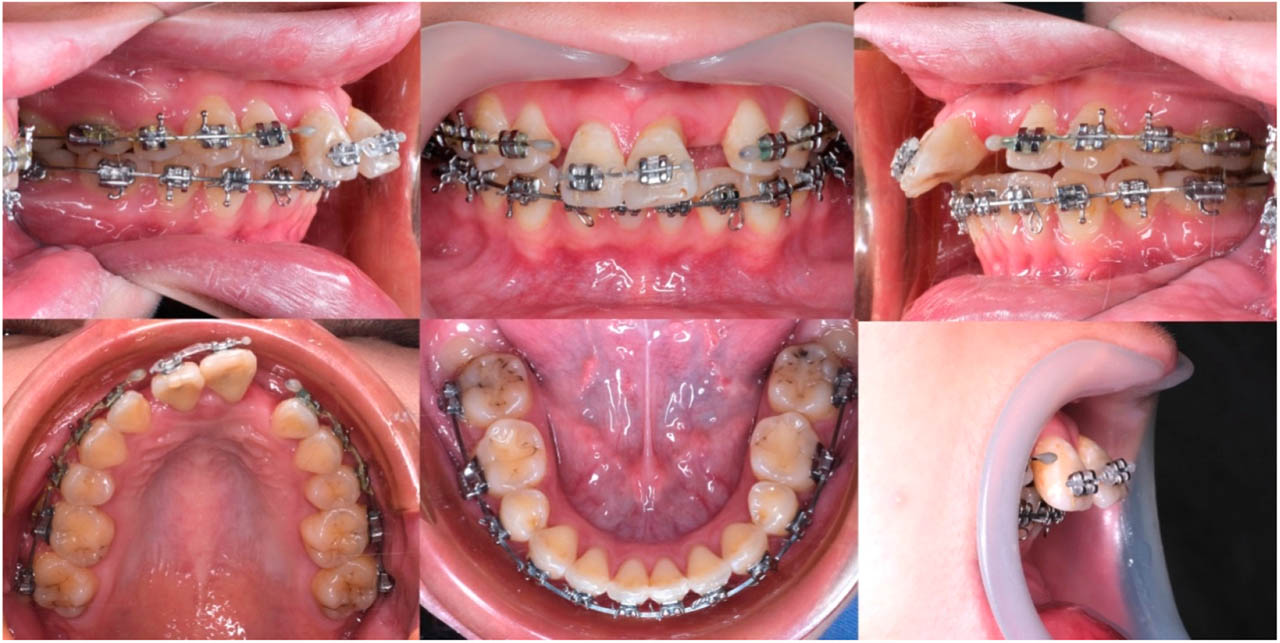
Figure 6.
Intraoral photographs before surgery.
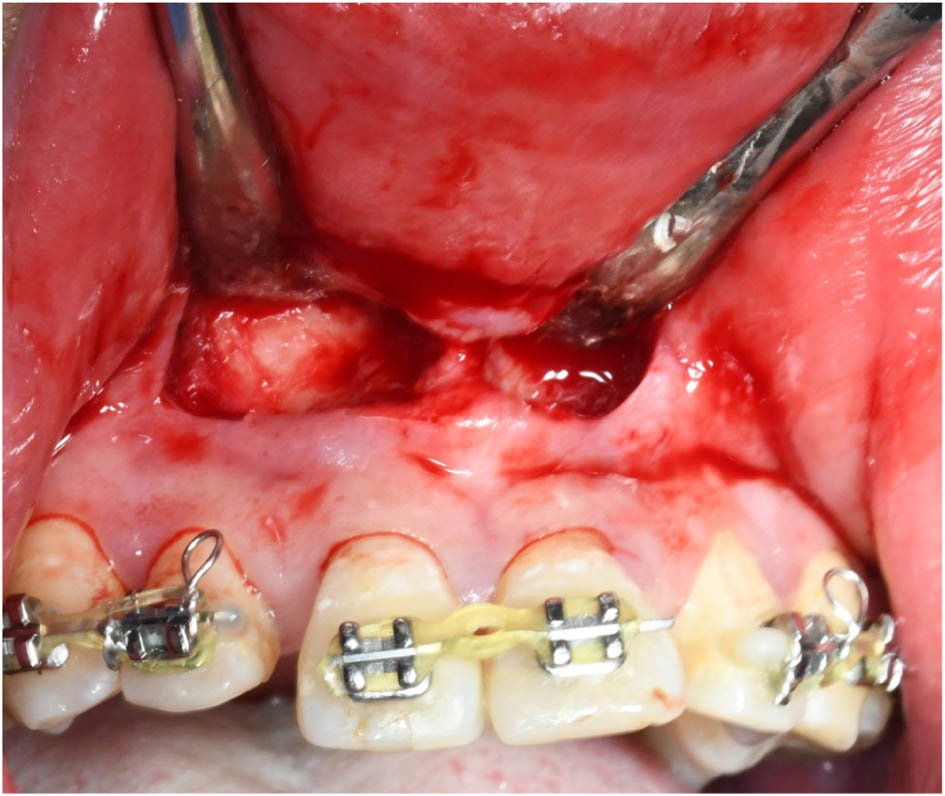
Figure 7.
A vestibular incision was made approximately 5 mm above the mucogingival junction using a scalpel blade. This incision and flap design provided excellent horizontal visibility, allowing precise osteotomy placement 5 mm apical to teeth 11 and 21. It also facilitated clear access for removing interdental and apical bone while preserving palatal-side blood supply to the dento-osseous segment.
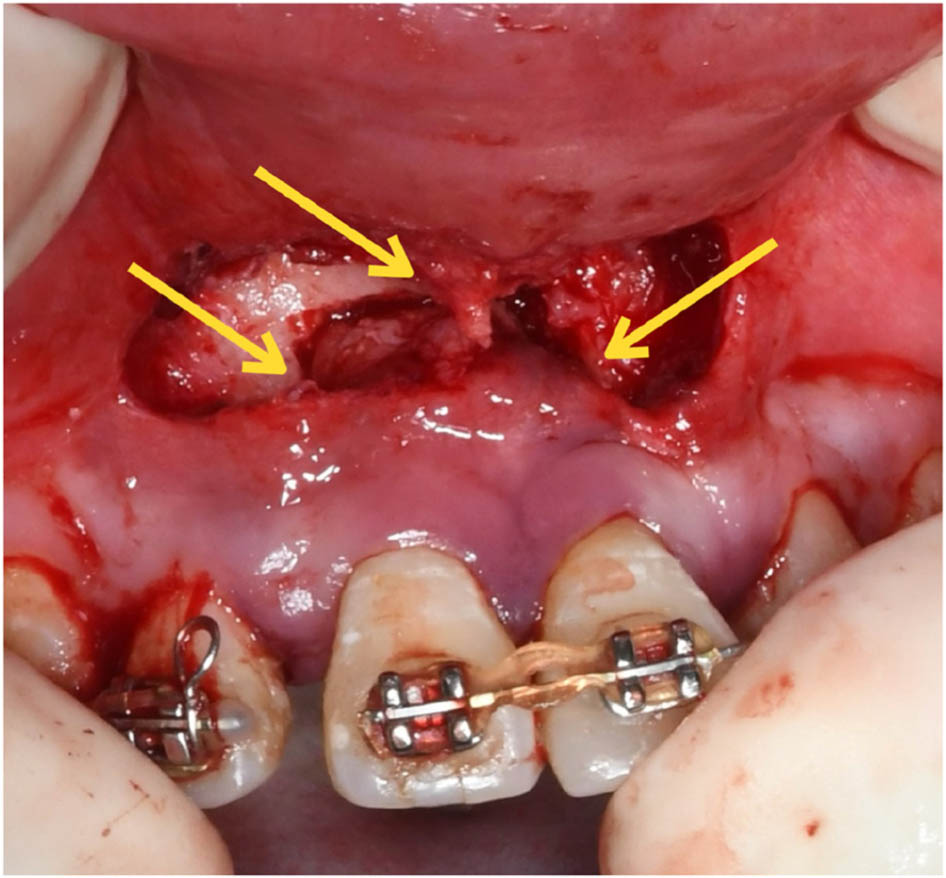
Figure 8.
A vertical and occlusally diverging osteotomy was performed, after which bony interferences were removed and the dento-osseous segment was repositioned. The yellow arrow indicates the apical and interdental bone that was removed, while both the facial and palatal pedicles were preserved.
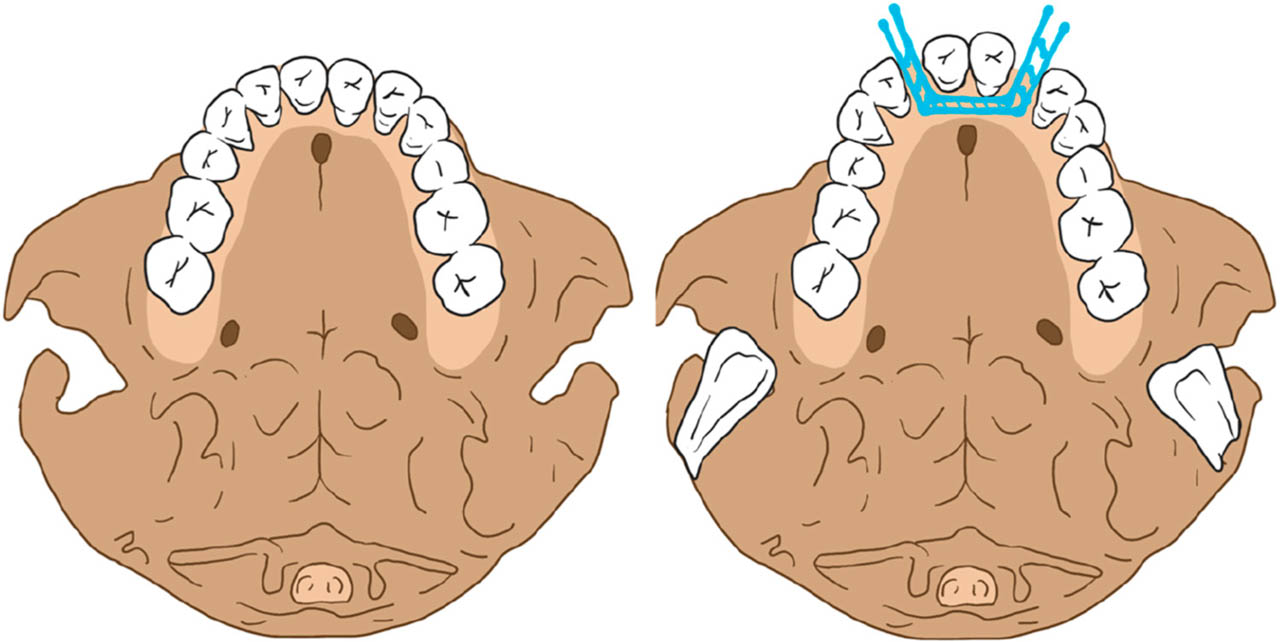
Figure 9.
The surgical diagram illustrates the osteotomy lines (blue line) in axial view.
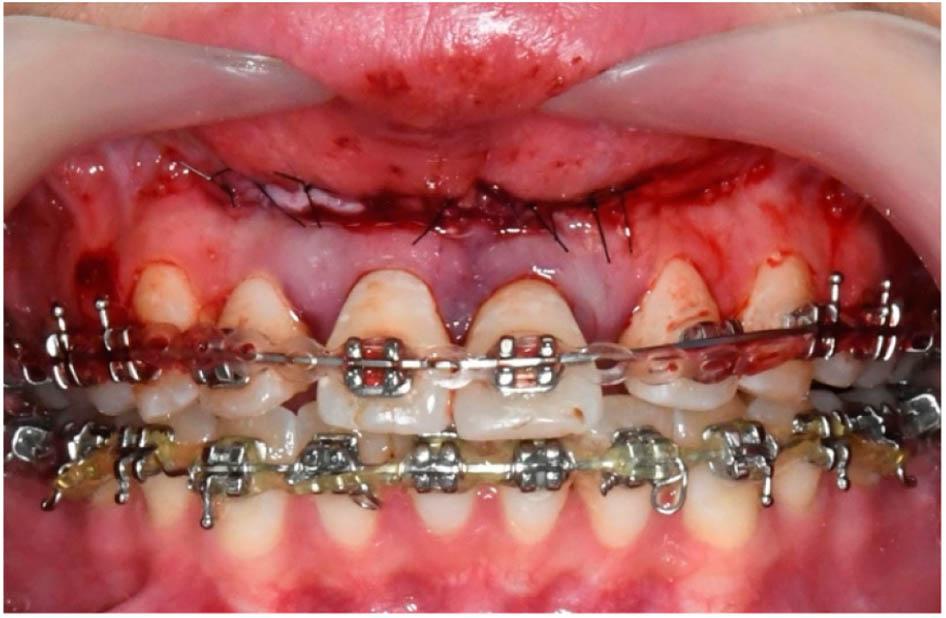
Figure 10.
Teeth 11 and 21 were fixed with the main wire with the help of power chain.
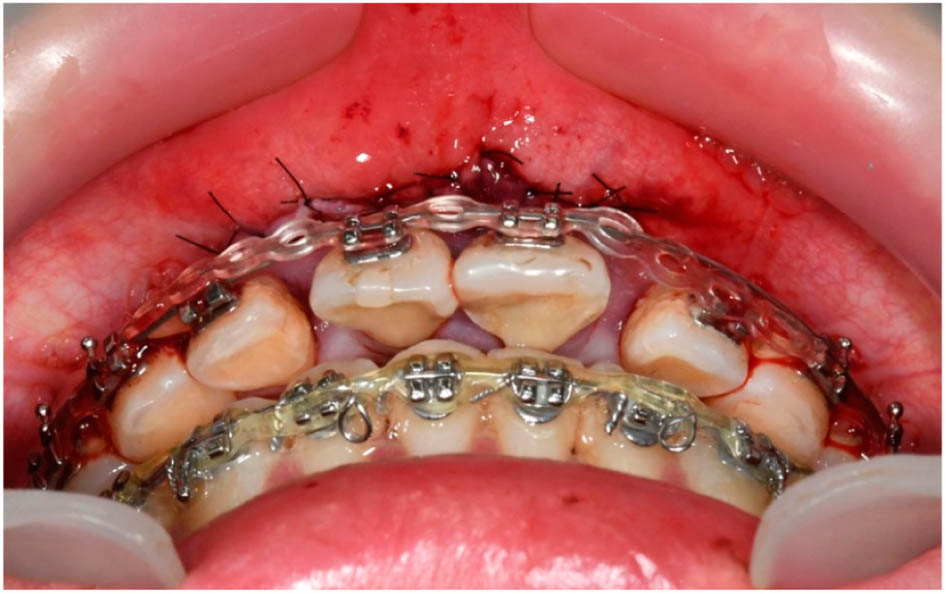
Figure 11.
Due to the non-ideal position, the main wire could not fit in the brackets of teeth 12 and 22. The force of power chain can retract the teeth-bone segment continuously.
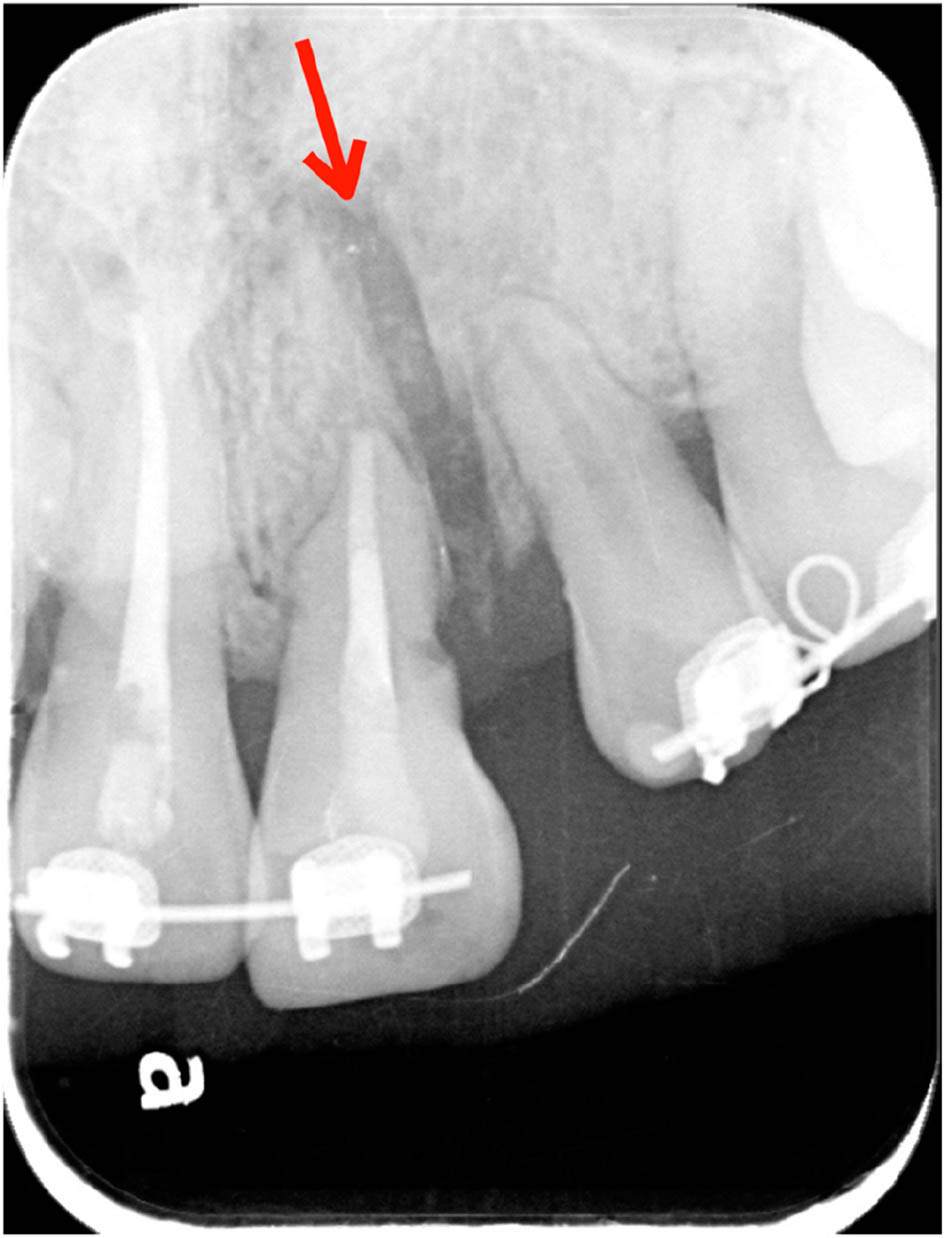
Figure 12.
Periapical radiograph after the surgery showing the bony gap and spacing between teeth 21 and 22 (red arrow).
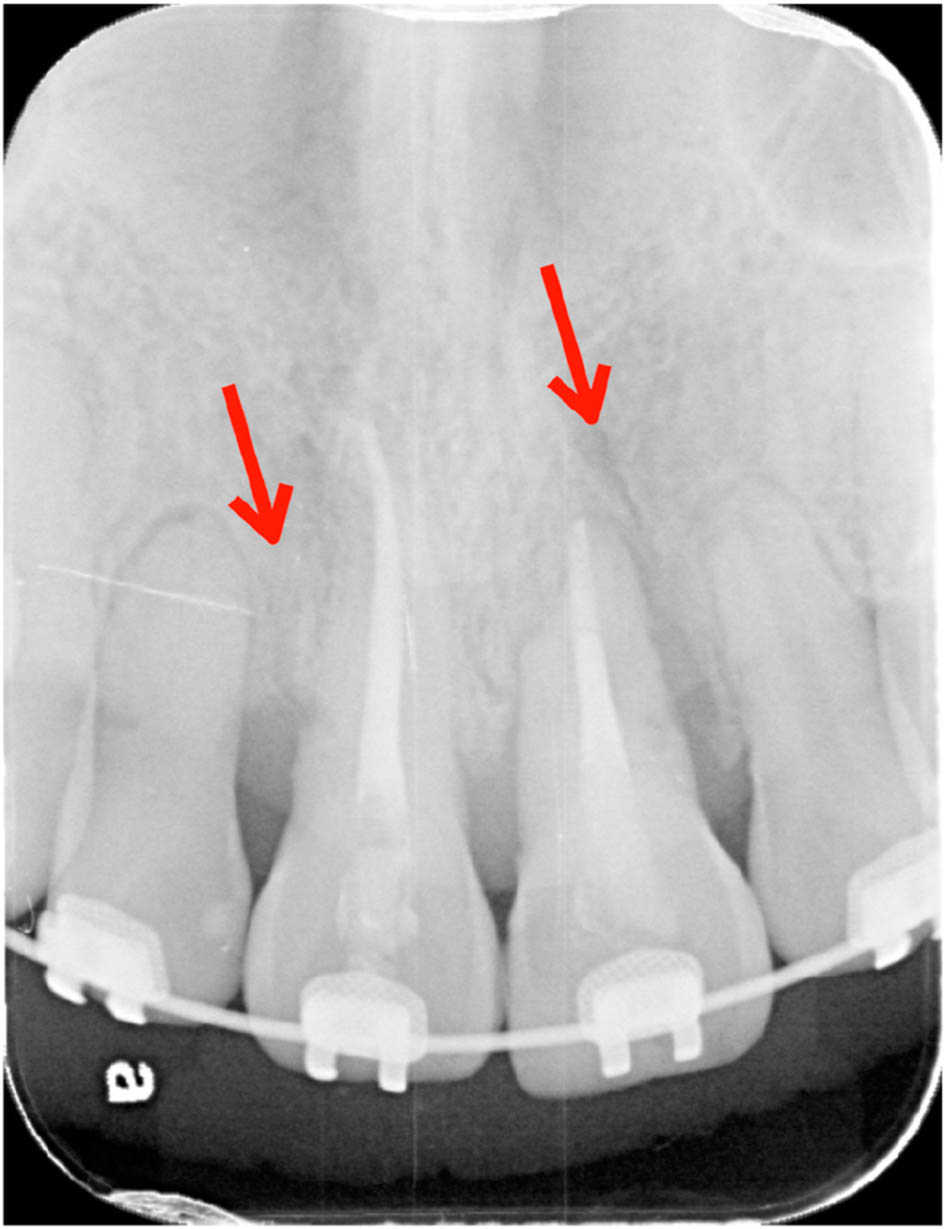
Figure 13.
Periapical radiograph four months postoperatively showing good alveolar bone healing and the closing of the space between central and lateral incisors (red arrow).
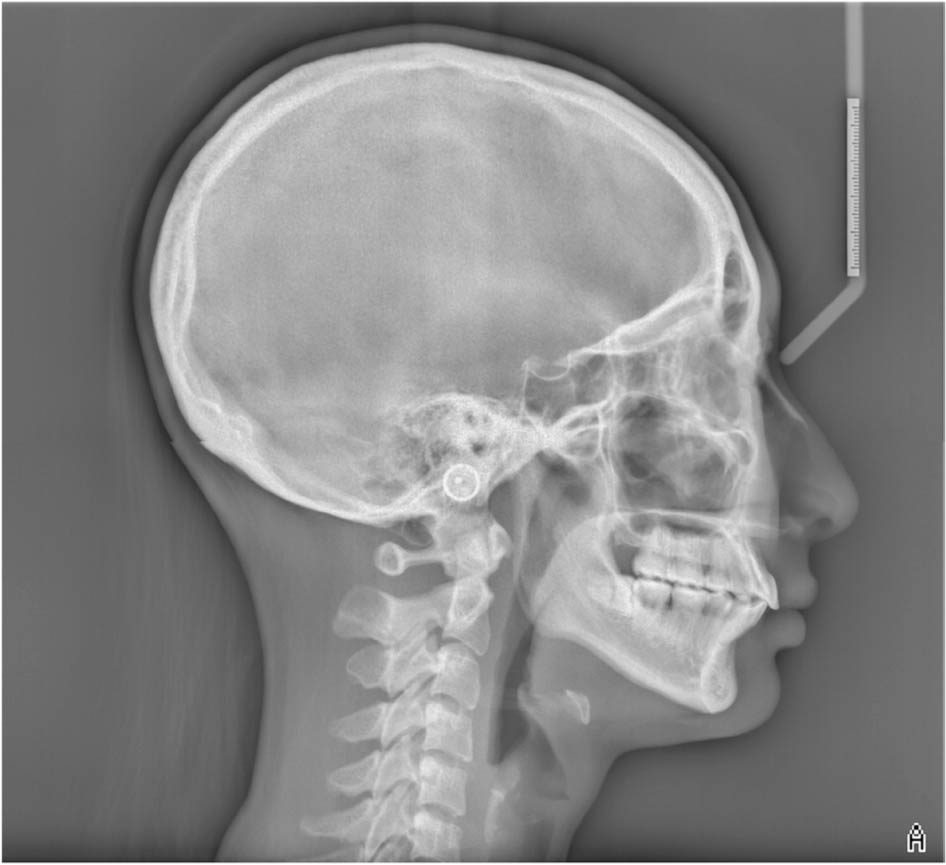
Figure 14.
Posttreatment cephalometric radiograph.
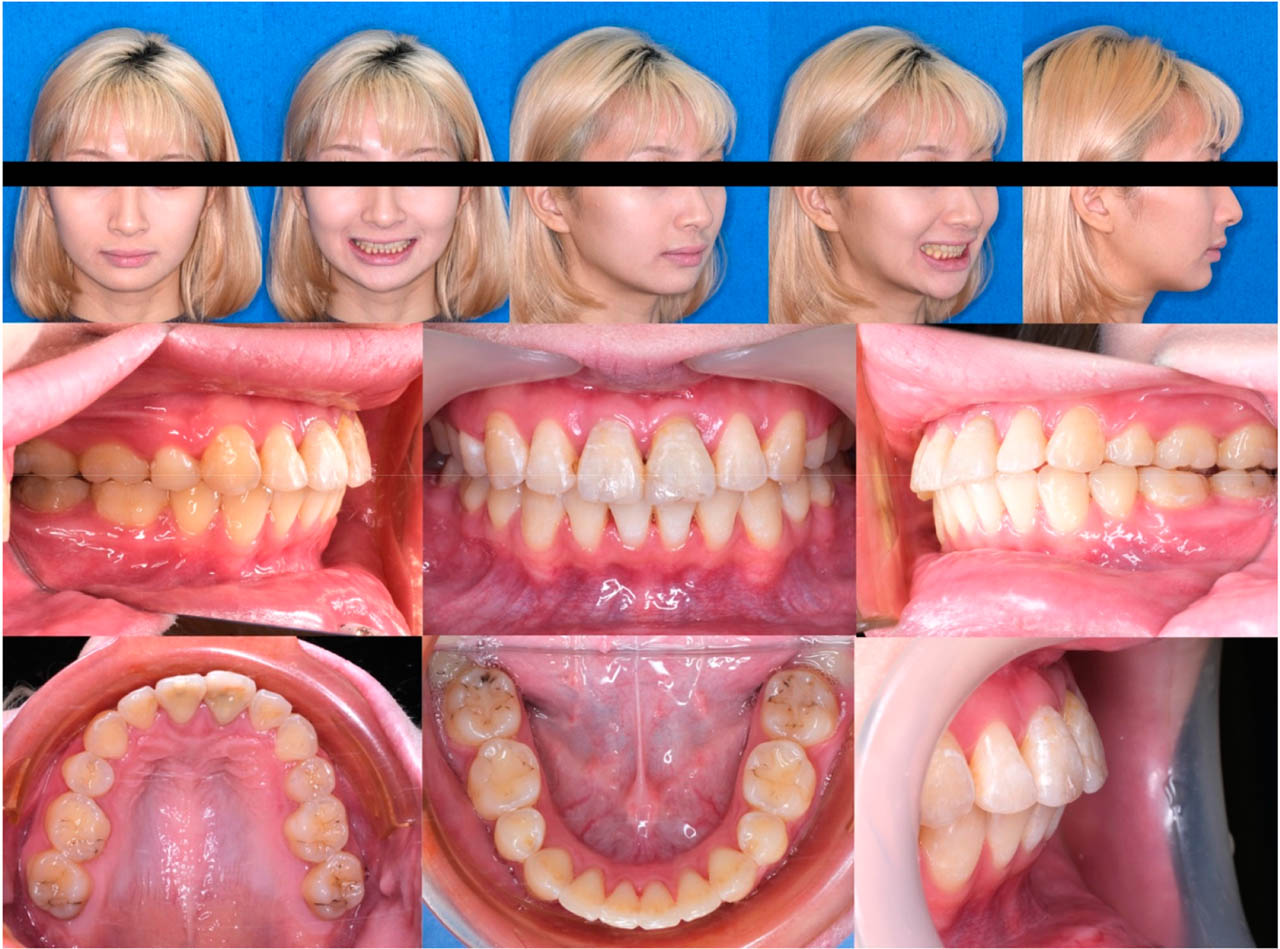
Figure 15.
Posttreatment extraoral and intraoral photographs.
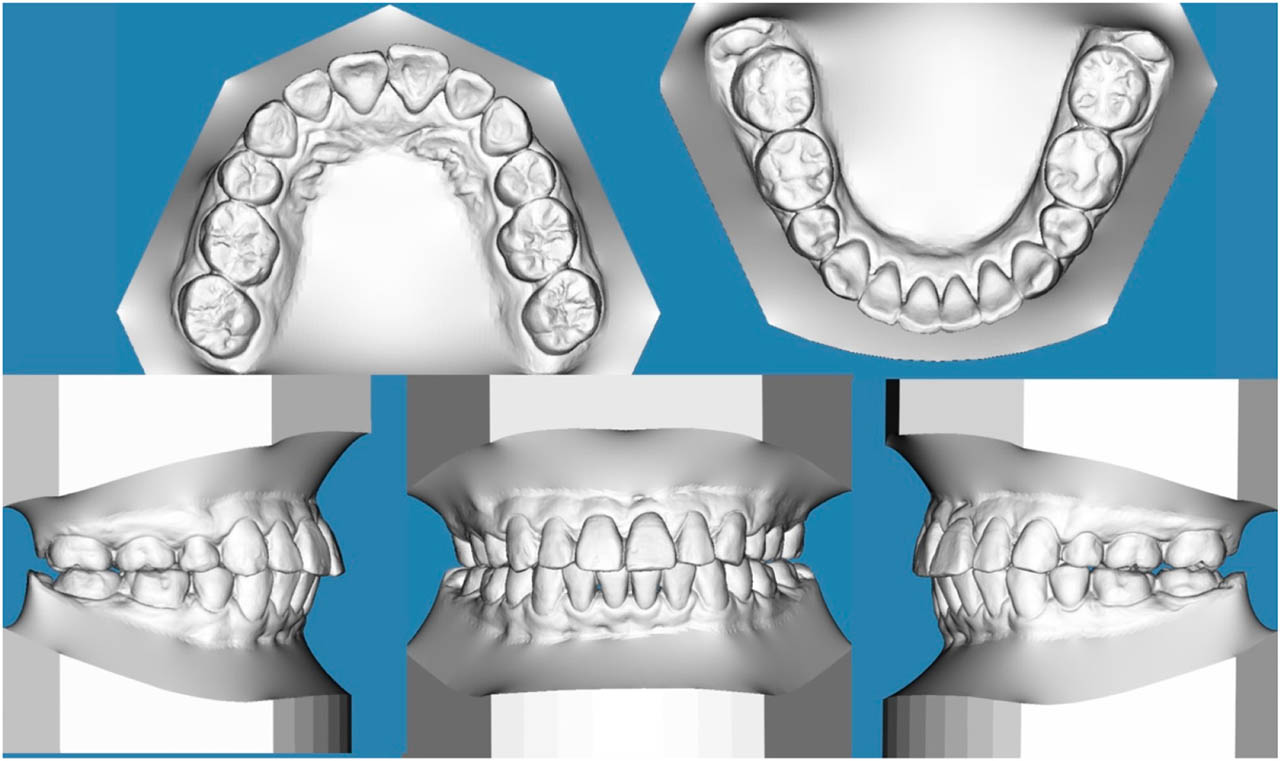
Figure 16.
Posttreatment digital study model.
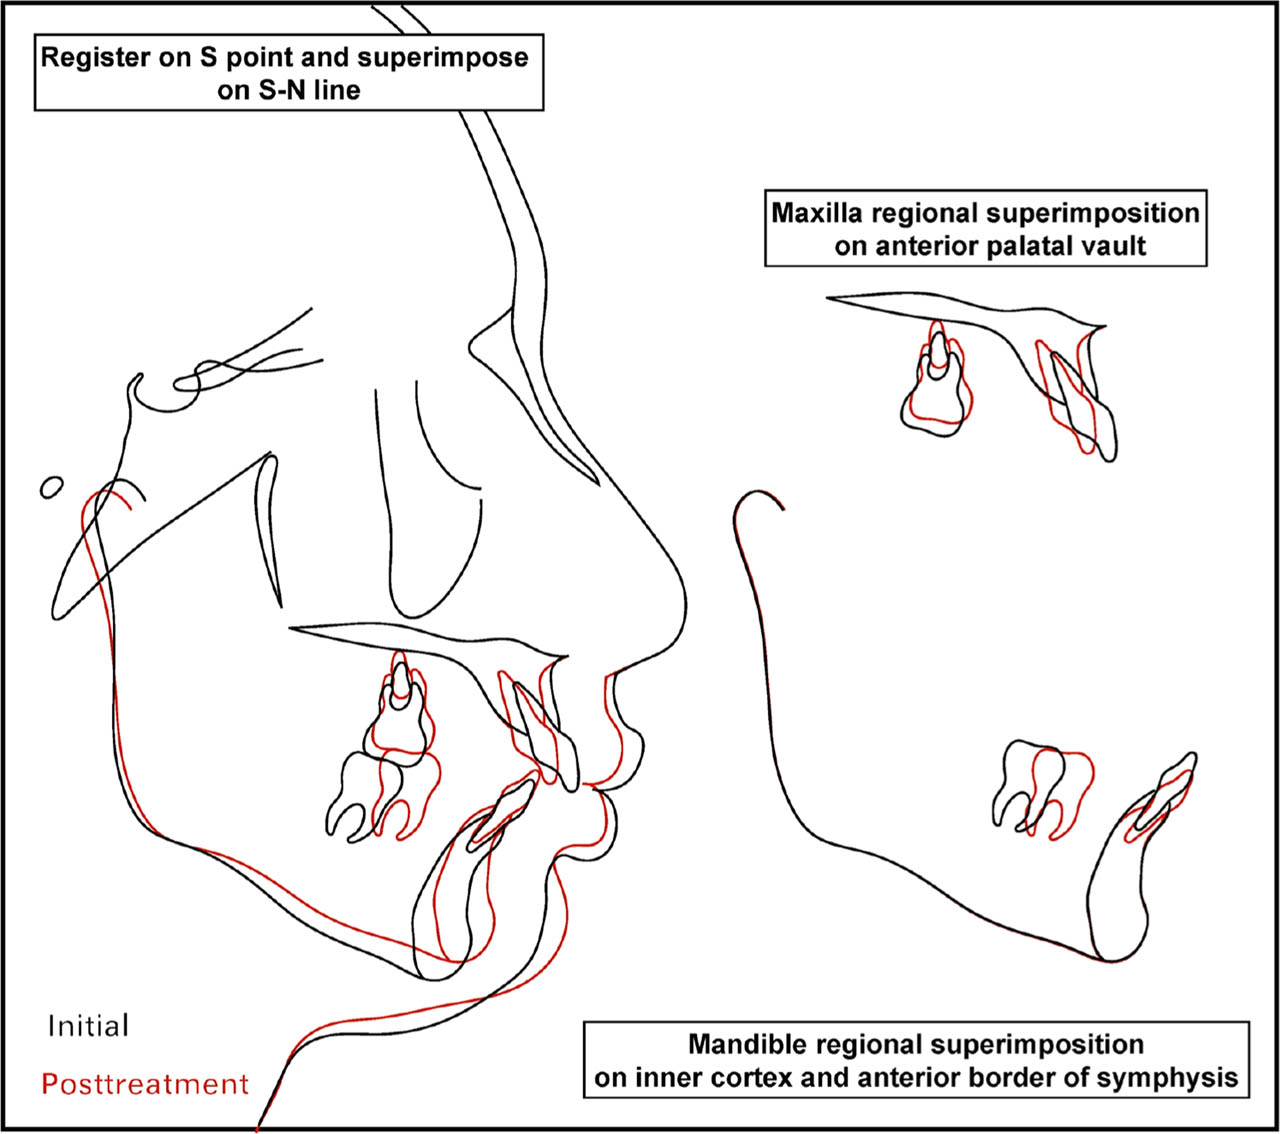
Figure 17.
Cephalometric superimposition.
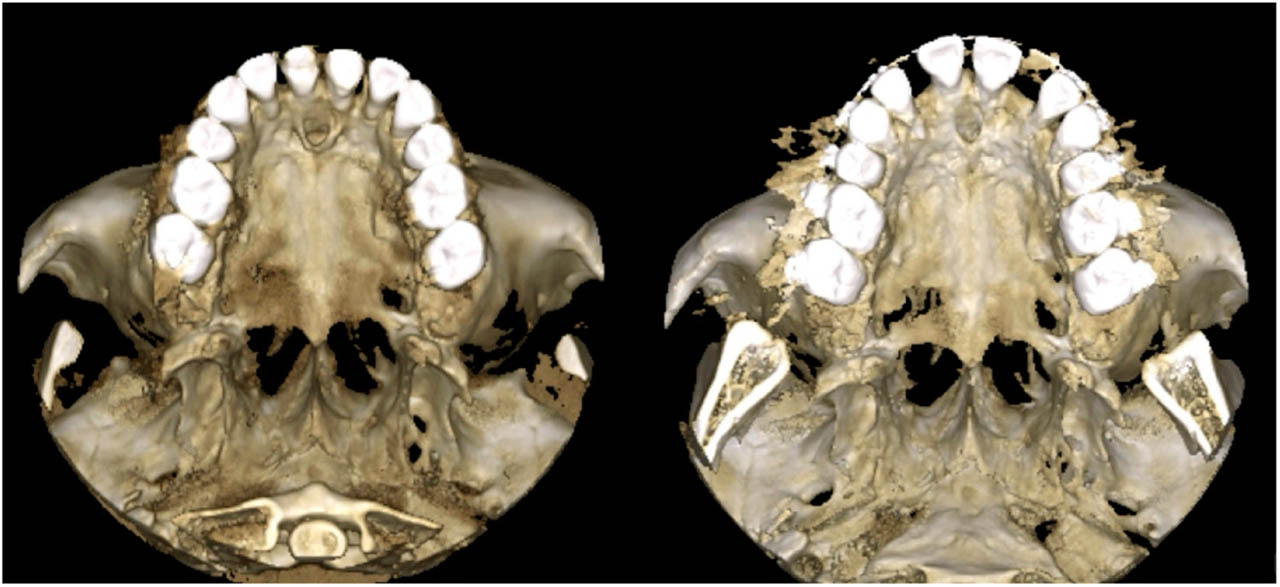
Figure 18.
Presurgical and posttreatment CBCT 3D model in axial view.
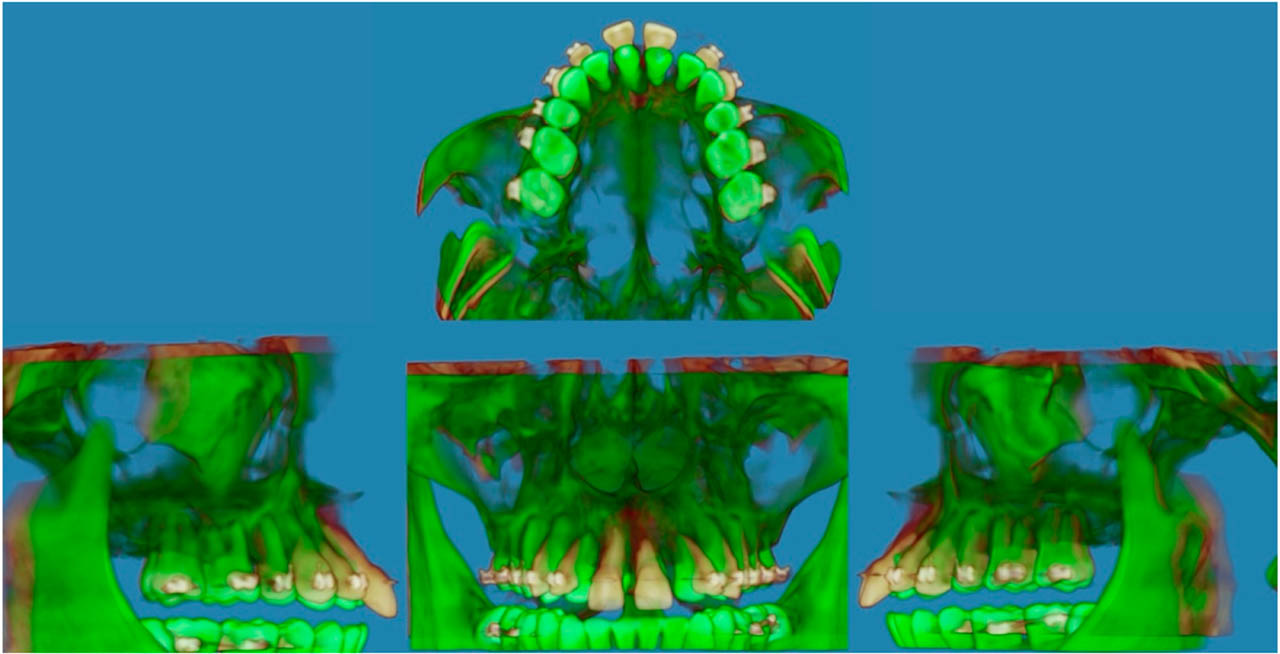
Figure 19.
CBCT superimposition.
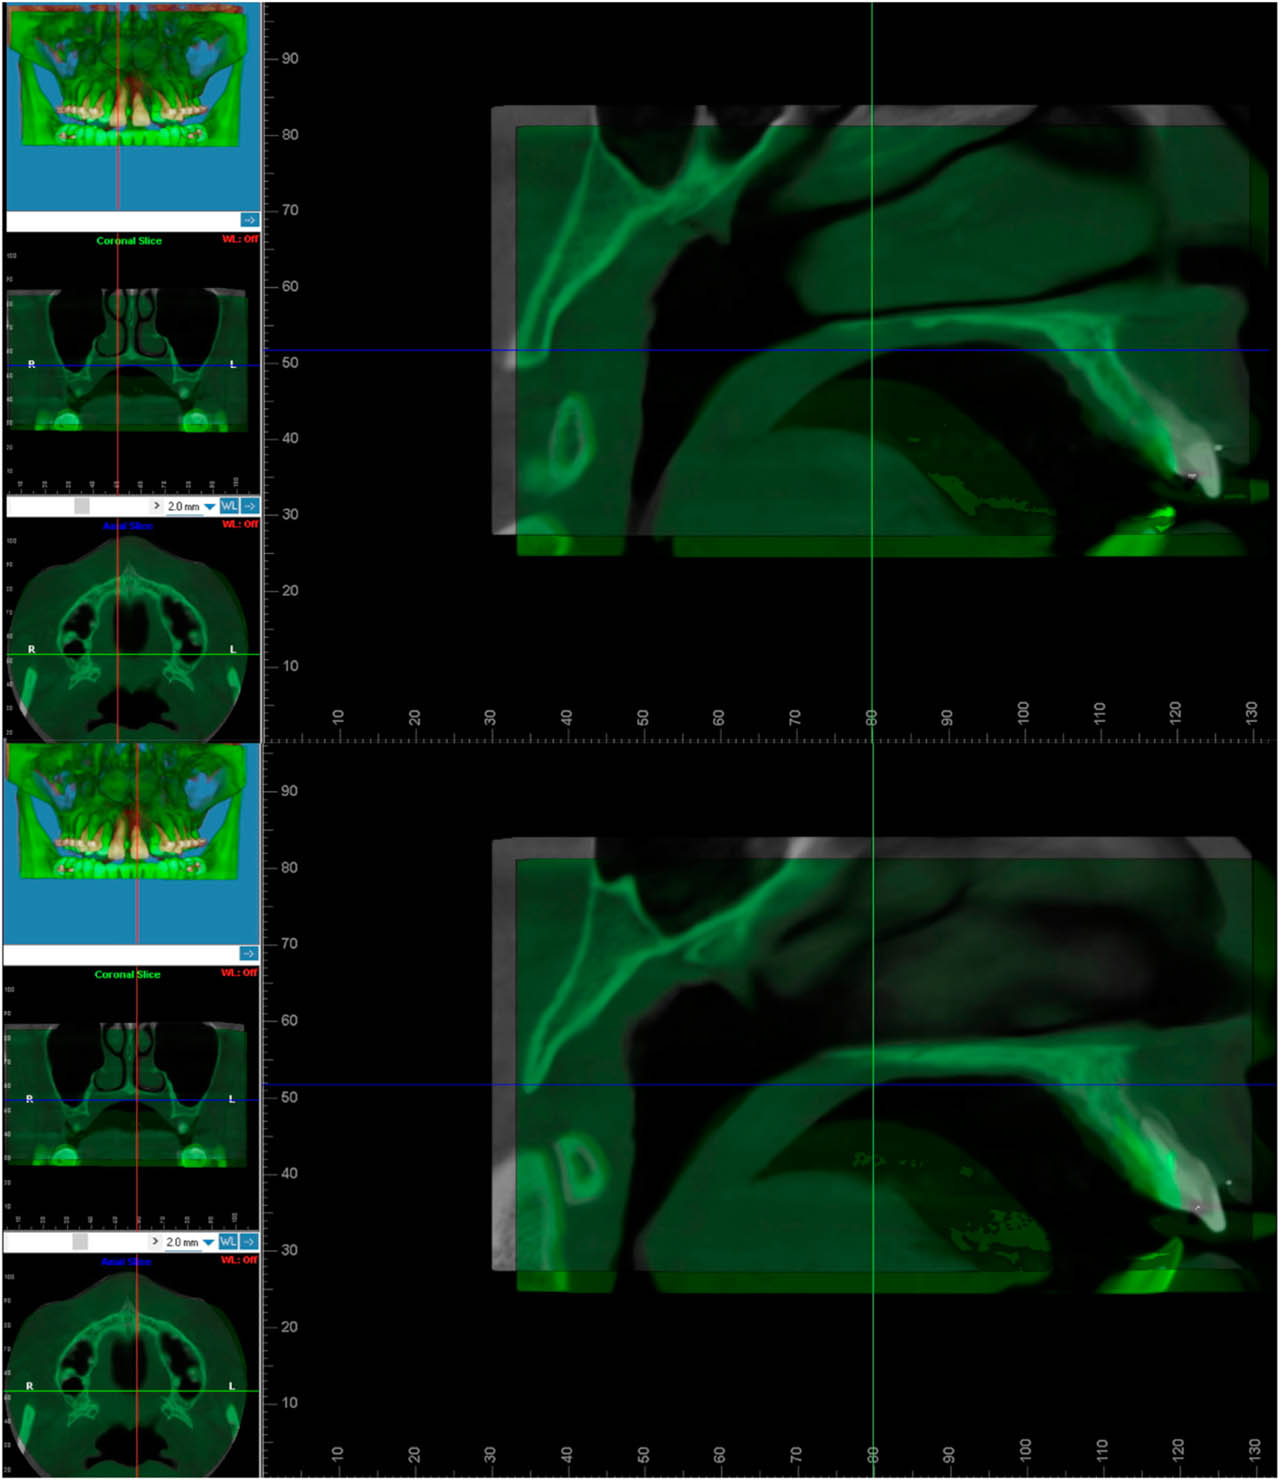
Figure 20.
Superimposed sagittal CBCT sections at the levels of teeth 11 and 21 demonstrating retraction and impaction of the dento-osseous segment.
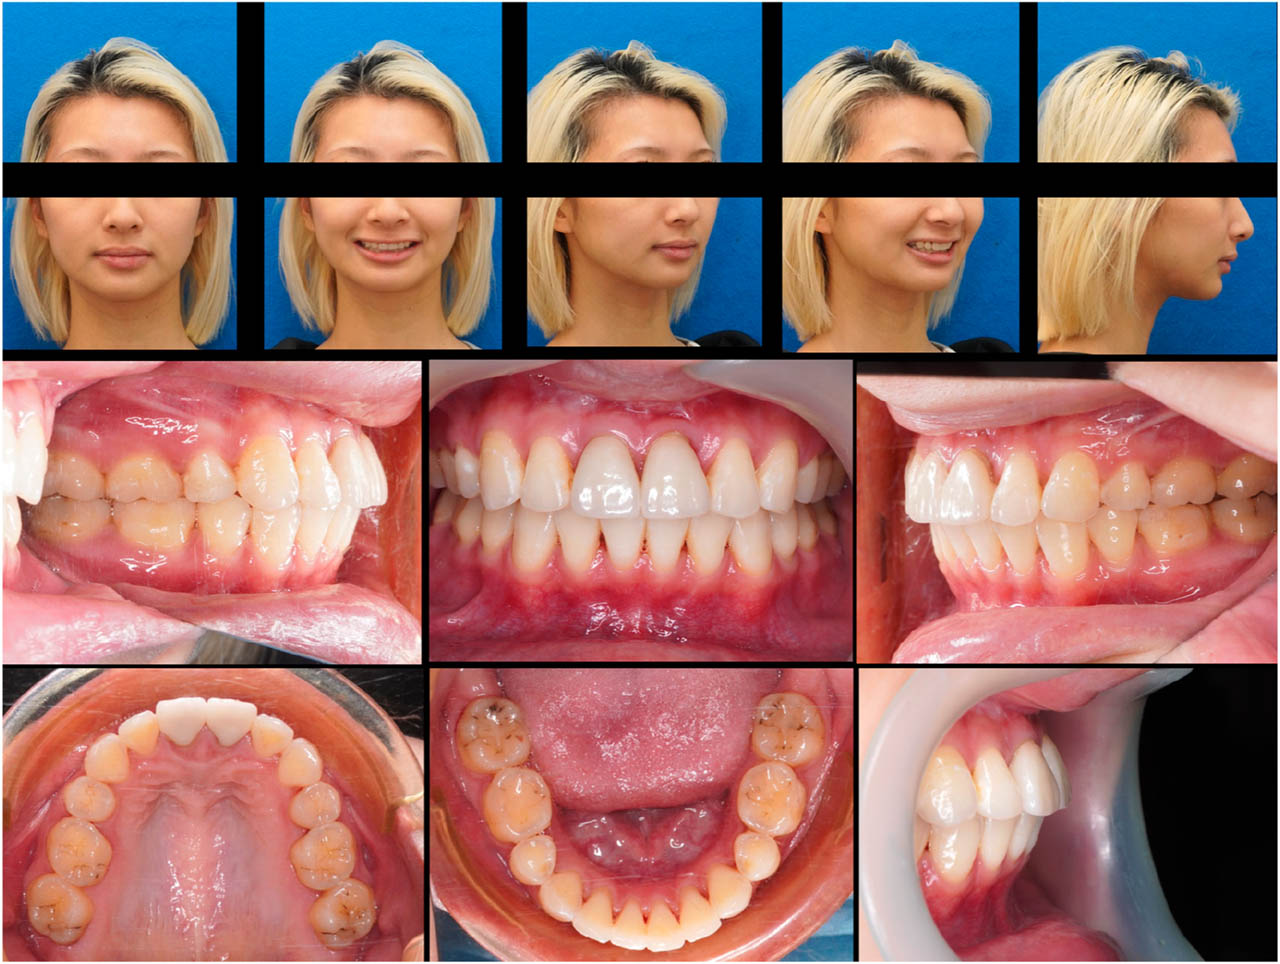
Figure 21.
One-year follow-up extraoral and intraoral photographs.
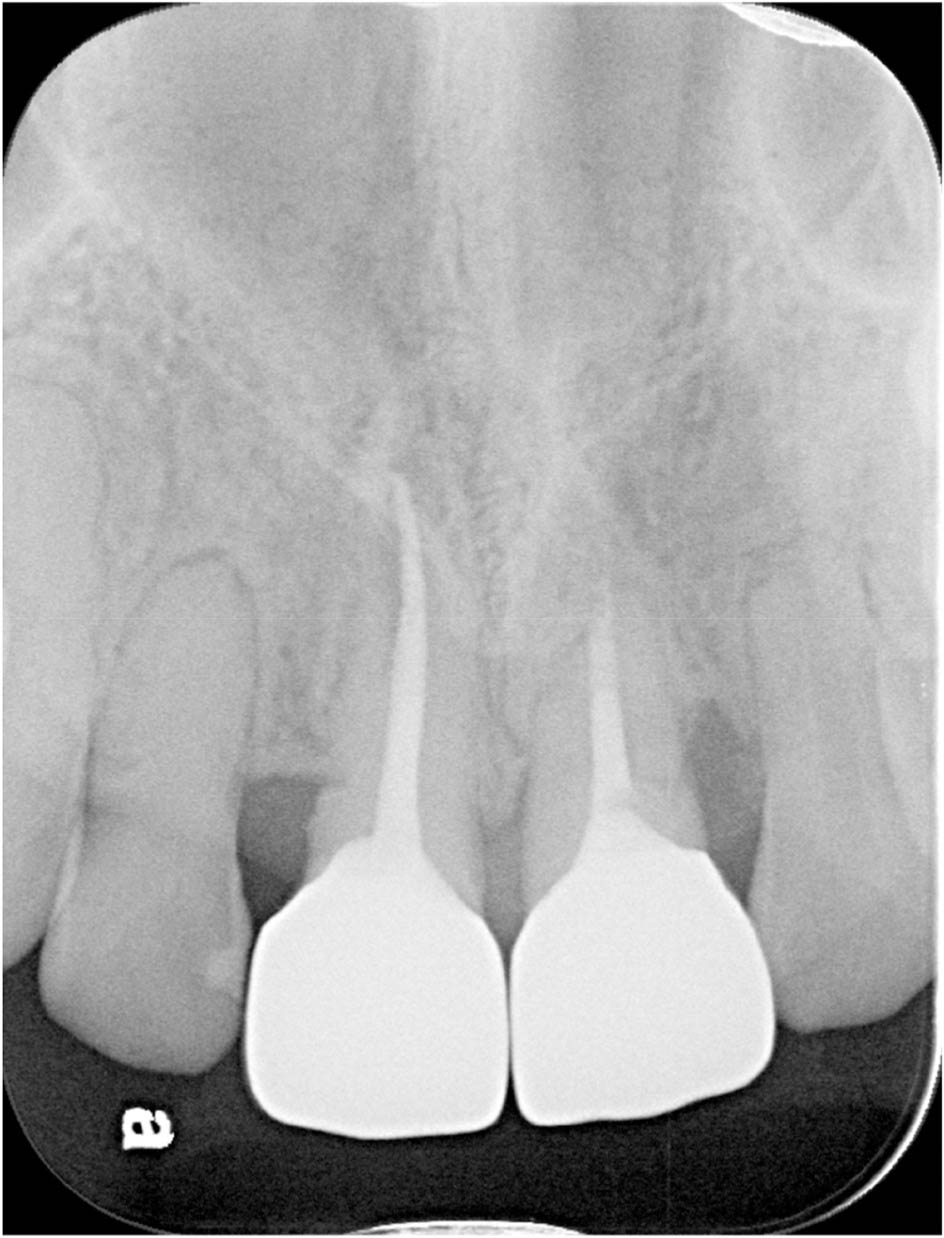
Figure 22.
One-year follow-up periapical radiograph.
TABLE II.
Comparison of treatment approaches for ankylosed maxillary incisors: extraction, prosthetic replacement, and segmental osteotomy
| Extracting the ankylosed tooth and orthodontically closing the space | Extracting the ankylosed tooth, maintaining the space, then utilizing a prosthesis for rehabilitation | Segmental osteotomy to move the ankylosed tooth | |
|---|---|---|---|
| Advantages |
|
|
|
| Disadvantages |
|
|
|