
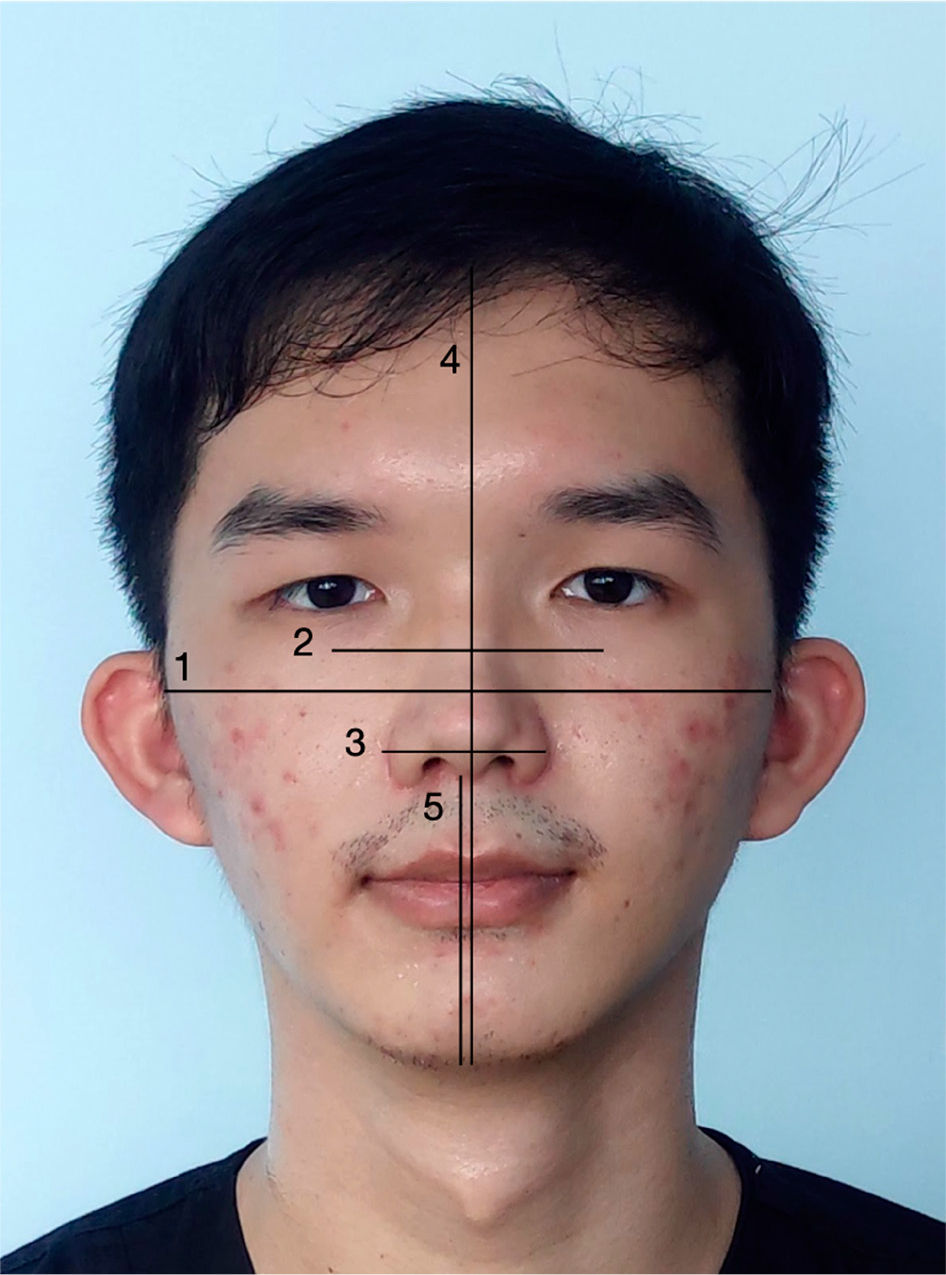
Figure 1.
Extraoral photograph with ruler.
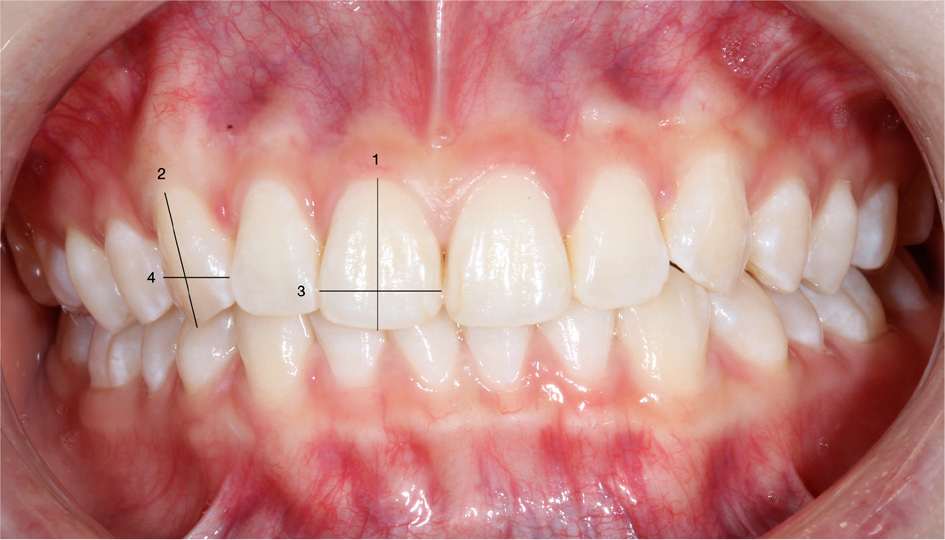
Figure 2.
Intraoral photograph with ruler.
Table I.
Mean and standard deviation of extraoral and intraoral measurements
| Parameter | Device | Mean (mm) | SD |
|---|---|---|---|
| ZA-ZA | DSLR | 143.59 | 11.36 |
| Xiaomi | 137.30 | 10.26 | |
| Or-Or | DSLR | 66.03 | 4.60 |
| Xiaomi | 63.83 | 4.26 | |
| Ac-Ac | DSLR | 40.97 | 3.93 |
| Xiaomi | 39.75 | 3.88 | |
| Tr-Me | DSLR | 182.85 | 13.57 |
| Xiaomi | 178.48 | 14.01 | |
| Sn-Me | DSLR | 68.83 | 5.85 |
| Xiaomi | 65.45 | 5.23 | |
| Incisor width | DSLR | 8.04 | 0.59 |
| Xiaomi | 7.81 | 0.58 | |
| Canine width | DSLR | 4.76 | 0.79 |
| Xiaomi | 4.45 | 0.78 | |
| Incisor height | DSLR | 9.52 | 0.99 |
| Xiaomi | 9.20 | 1.01 | |
| Canine height | DSLR | 8.50 | 1.16 |
| Xiaomi | 8.24 | 1.04 |
Table II.
Comparison of extraoral measurements using DSLR and smartphone
| Parameter | Paired t-test | p-value | |||
|---|---|---|---|---|---|
| Mean difference in mm (SD) | Standard error mean | 95% CI of difference | t-stat (df) | ||
| ZA-ZA | 6.29 (3.24) | 0.59 | (5.08, 7.50) | 10.62 (29) | <0.001 |
| Or-Or | 2.20 (1.28) | 0.23 | (1.72, 2.68) | 9.40 (29) | <0.001 |
| Ac-Ac | 1.22 (1.36) | 0.25 | (0.71, 1.73) | 4.91 (29) | <0.001 |
| Tr-Me | 4.37 (4.54) | 0.83 | (2.68, 6.07) | 5.28 (29) | <0.001 |
| Sn-Me | 3.38 (2.42) | 0.44 | (2.48, 4.29) | 7.65 (29) | <0.001 |
Table III.
Comparison of intraoral measurements using DSLR and smartphone
| Parameter | Paired t-test | p-value | |||
|---|---|---|---|---|---|
| Mean difference in mm (SD) | Standard error mean | 95% CI of difference | t-stat (df) | ||
| Incisor width | 0.22 (0.34) | 0.06 | (0.09, 0.35) | 3.54 (29) | 0.001 |
| Canine width | 0.31 (0.42) | 0.08 | (0.15, 0.46) | 3.96 (29) | <0.001 |
| Incisor height | 0.31 (0.47) | 0.09 | (0.14, 0.49) | 3.69 (29) | 0.001 |
| Canine height | 0.26 (0.39) | 0.07 | (0.11, 0.41) | 3.58 (29) | 0.001 |
Table IV.
Smartphone/DSLR ratio analysis
| Parameter | Mean Ratio (M ± SD) | t (df = 29) | p-value | Mean Difference | 95% CI of Difference |
|---|---|---|---|---|---|
| ZA-ZA | 0.9568 ± 0.0218 | -10.856 | <0.001 | -0.0432 | [-0.0513, -0.0351] |
| Or-Or | 0.9670 ± 0.0185 | -9.777 | <0.001 | -0.0330 | [-0.0399, -0.0261] |
| Ac-Ac | 0.9705 ± 0.0311 | -5.190 | <0.001 | -0.0295 | [-0.0411, -0.0179] |
| Tr-Me | 0.9760 ± 0.0246 | -5.334 | <0.001 | -0.0240 | [-0.0332, -0.0148] |
| Sn-Me | 0.9518 ± 0.0340 | -7.768 | <0.001 | -0.0482 | [-0.0608, -0.0355] |
| Incisal Width | 0.9733 ± 0.0418 | -3.505 | 0.002 | -0.0267 | [-0.0423, -0.0111] |
| Canine Width | 0.9379 ± 0.0906 | -3.755 | <0.001 | -0.0621 | [-0.0959, -0.0283] |
| Incisal Height | 0.9675 ± 0.0480 | -3.713 | <0.001 | -0.0325 | [-0.0505, -0.0146] |
| Canine Height | 0.9722 ± 0.0452 | -3.368 | 0.002 | -0.0278 | [-0.0447, -0.0109] |
Table V.
Data analysis of the studied variables for extraoral measurements obtained from photographs on two separate occasions
| Parameter | Device | ICC test | Paired t-test | |||||
|---|---|---|---|---|---|---|---|---|
| ICC | p-value | Mean difference in mm (SD) | Standard error mean | 95% CI of difference | t-stat (df) | p-value | ||
| ZA-ZA | DSLR | 1.000 | <0.001 | -0.10 (0.31) | 0.06 | (-0.22, 0.02) | -1.75 (29) | 0.090 |
| Xiaomi | 0.990 | <0.001 | -0.53 (1.49) | 0.27 | (-1.08, 0.03) | -1.93 (29) | 0.106* | |
| Or-Or | DSLR | 0.997 | <0.001 | -0.14 (0.37) | 0.07 | (-0.27, 0.00) | -1.99 (29) | 0.056 |
| Xiaomi | 0.987 | <0.001 | -0.11 (0.70) | 0.13 | (-0.37, 0.15) | -0.85 (29) | 0.400 | |
| Ac-Ac | DSLR | 0.989 | <0.001 | -0.12 (0.61) | 0.11 | (-0.35, 0.11) | -1.08 (29) | 0.382* |
| Xiaomi | 0.988 | <0.001 | -0.07 (0.60) | 0.11 | (-0.29, 0.16) | -0.62 (29) | 0.538 | |
| Tr-Me | DSLR | 0.999 | <0.001 | -0.22 (0.74) | 0.13 | (-0.49, 0.06) | -1.63 (29) | 0.114 |
| Xiaomi | 0.993 | <0.001 | -0.58 (1.64) | 0.30 | (-1.19, 0.03) | -1.94 (29) | 0.062 | |
| Sn-Me | DSLR | 0.995 | <0.001 | -0.09 (0.59) | 0.11 | (-0.31, 0.13) | -0.85 (29) | 0.401 |
| Xiaomi | 0.992 | <0.001 | -0.22 (0.72) | 0.13 | (-0.49, 0.05) | -1.70 (29) | 0.101 | |
Table VI.
Data analysis of the studied variables for intraoral measurements obtained from photographs on two separate occasions
| Parameter | ICC test | Paired t-test | ||||||
|---|---|---|---|---|---|---|---|---|
| Device | ICC | p-value | Mean difference in mm (SD) | Standard error mean | 95% CI of difference | t-stat (df) | p-value | |
| Incisor width | DSLR | 0.971 | <0.001 | -0.01 (0.23) | 0.04 | (-0.09, 0.08) | -0.15 (29) | 0.884 |
| Xiaomi | 0.955 | <0.001 | 0.05 (0.34) | 0.06 | (-0.08, 0.18) | 0.79 (29) | 0.437 | |
| Canine width | DSLR | 0.977 | <0.001 | -0.09 (0.25) | 0.05 | (-0.18, 0.01) | -1.92 (29) | 0.064 |
| Xiaomi | 0.957 | <0.001 | 0.10 (0.31) | 0.06 | (-0.02, 0.21) | 1.68 (29) | 0.105 | |
| Incisor height | DSLR | 0.892 | <0.001 | -0.06 (0.27) | 0.05 | (-0.16, 0.05) | -1.13 (29) | 0.269 |
| Xiaomi | 0.956 | <0.001 | 0.06 (0.17) | 0.03 | (-0.01, 0.12) | 1.77 (29) | 0.087 | |
| Canine height | DSLR | 0.971 | <0.001 | 0.06 (0.19) | 0.03 | (-0.01, 0.13) | 1.79 (29) | 0.084 |
| Xiaomi | 0.957 | <0.001 | 0.00 (0.23) | 0.04 | (-0.09, 0.08) | -0.04 (29) | 0.969 | |
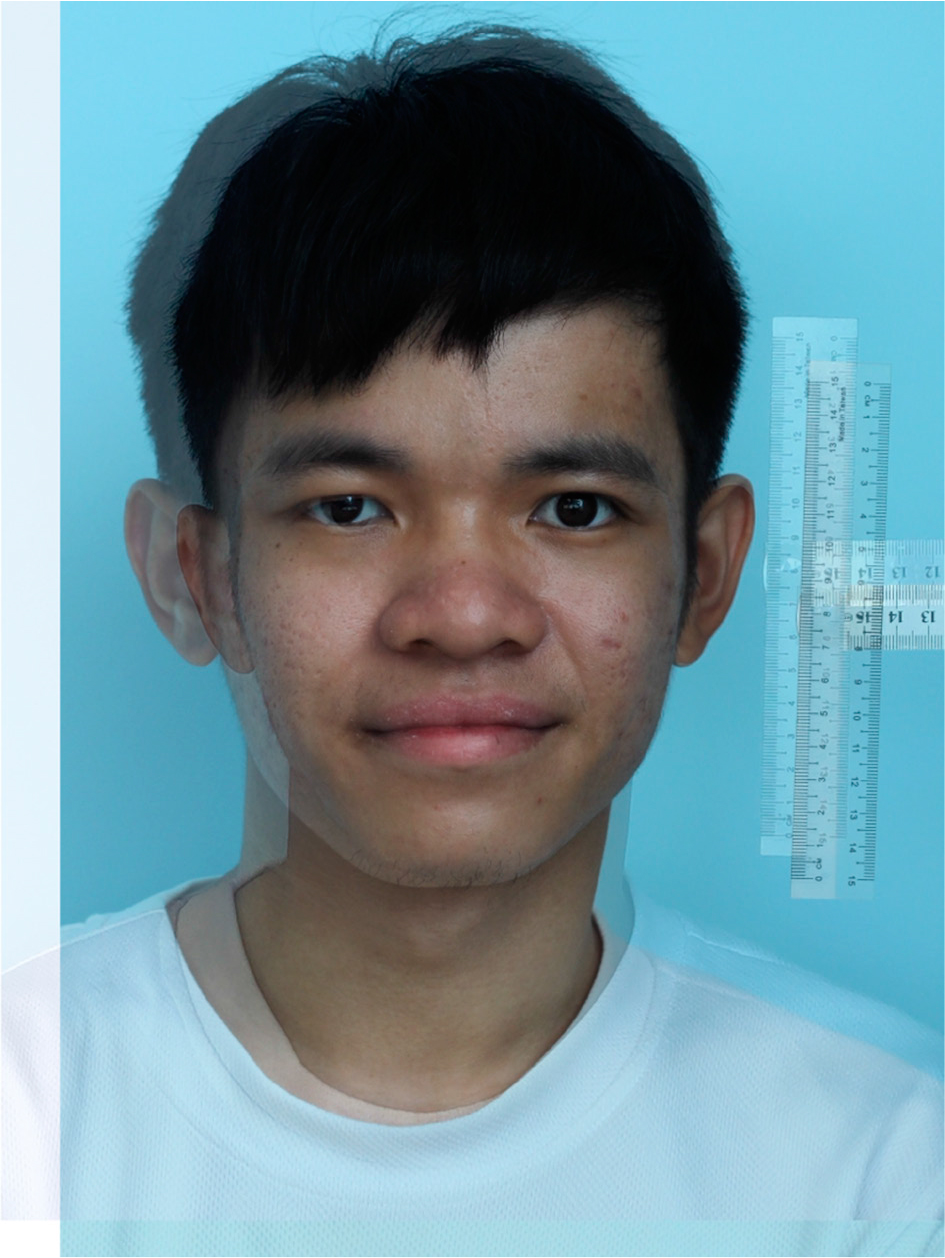
Figure 3.
Example of the visual comparison of the extraoral photographs. The photographs were superimposed over the nose and left eye. The shadow of the larger image was from the DSLR photograph.
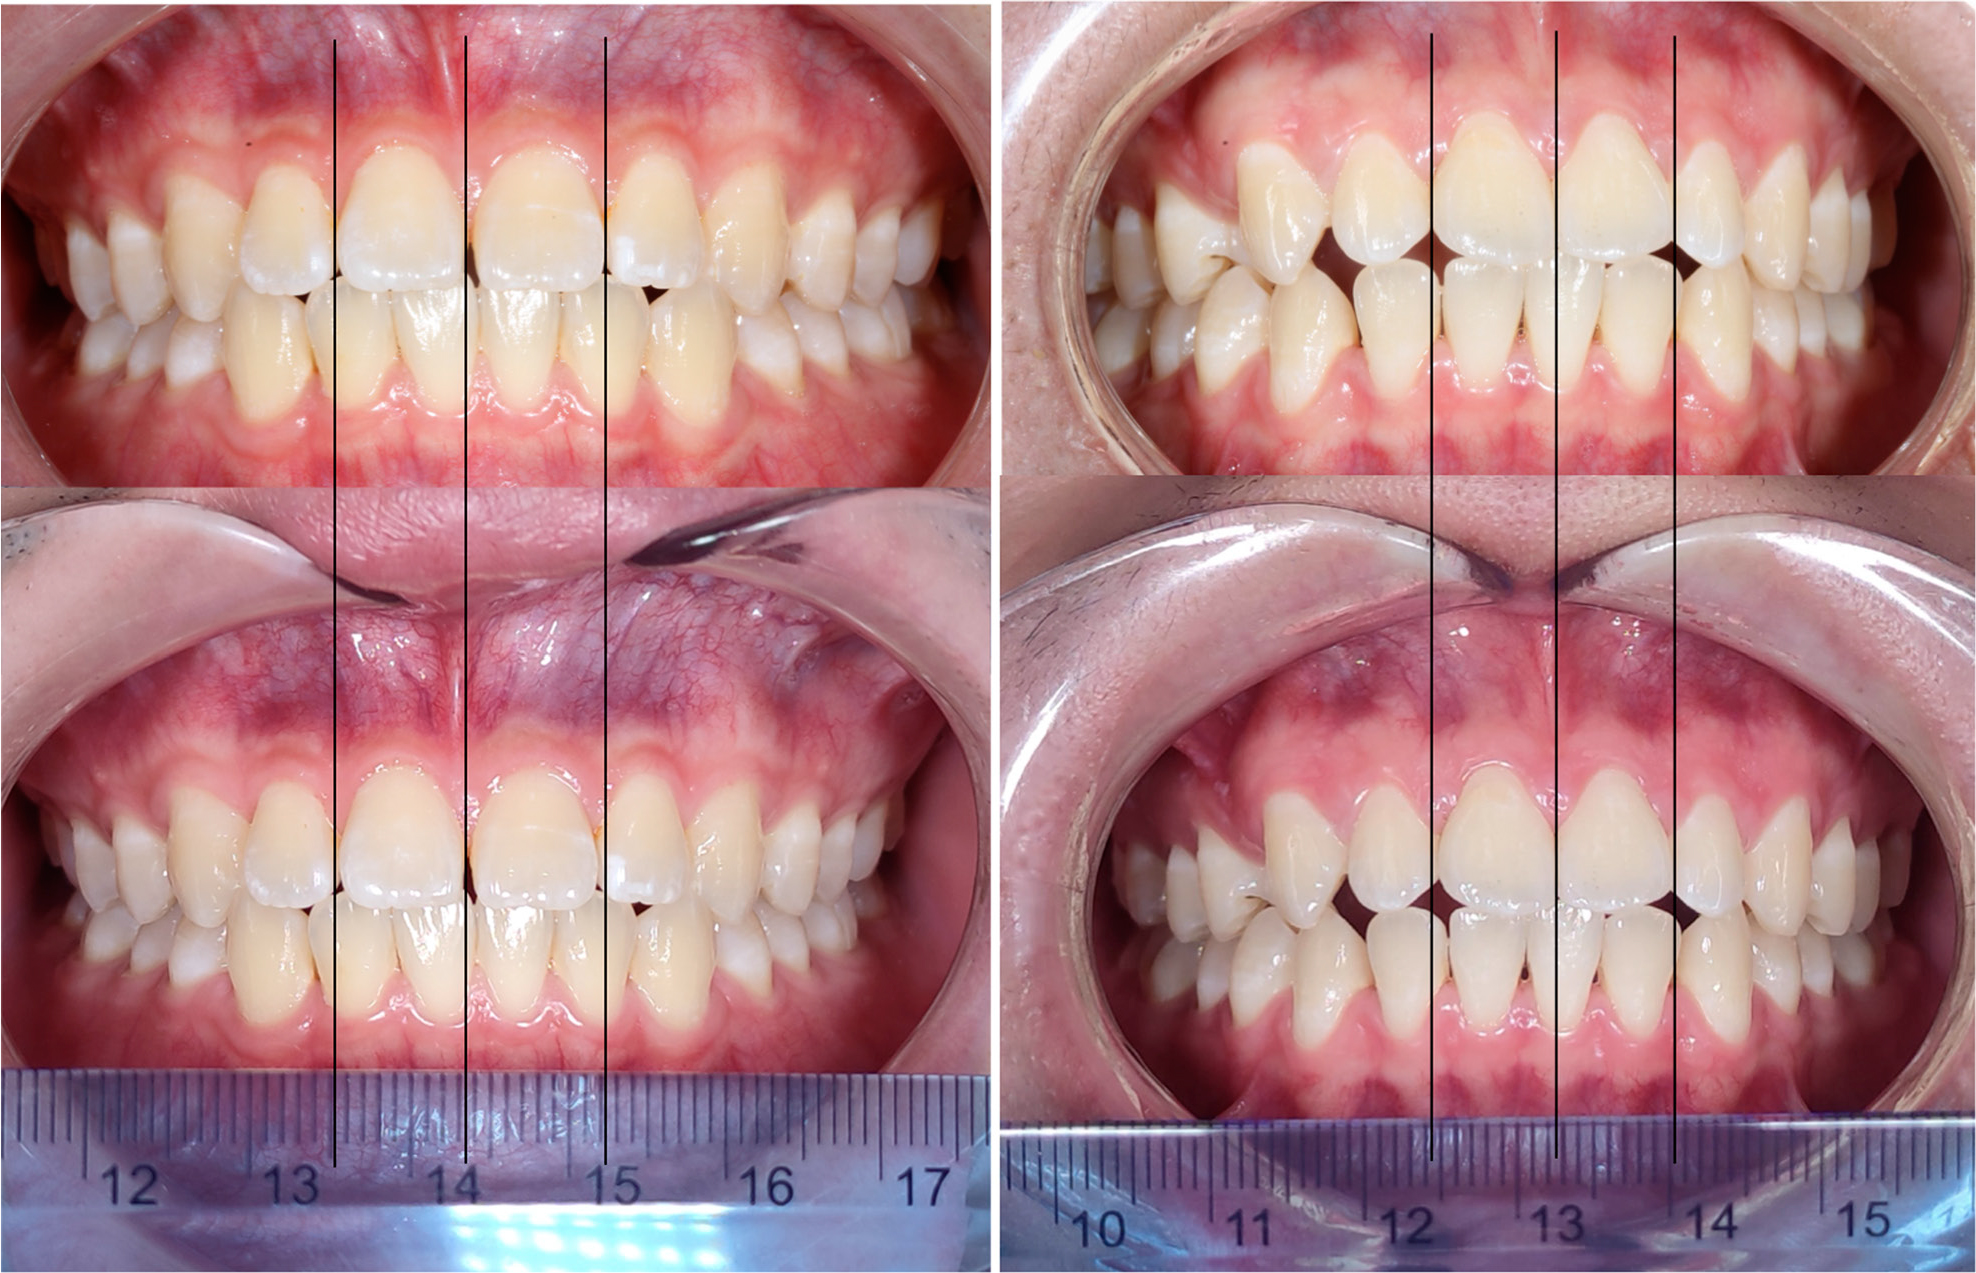
Figure 4.
Example of the visual comparison of the intraoral photographs. The vertical lines represent the upper incisor widths in the photographs taken with the DSLR camera (top) as the gold standard.
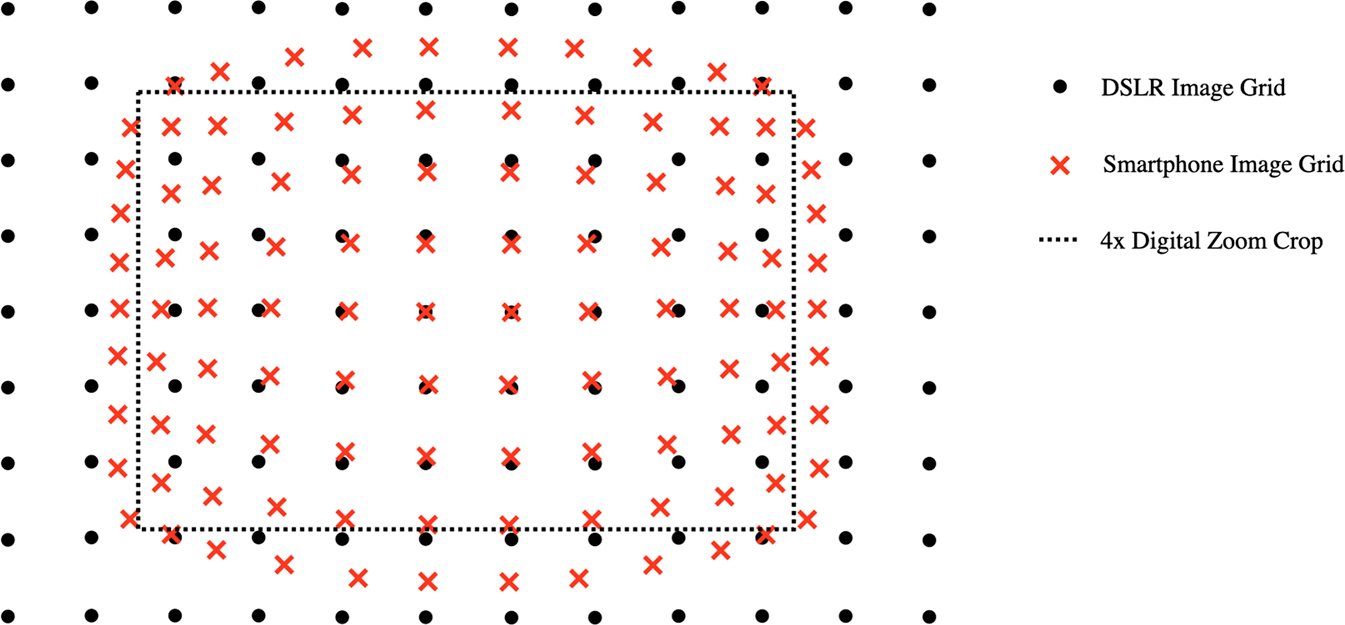
Figure 5.
Illustration of barrel distortion in smartphone photography compared to a DSLR camera.