
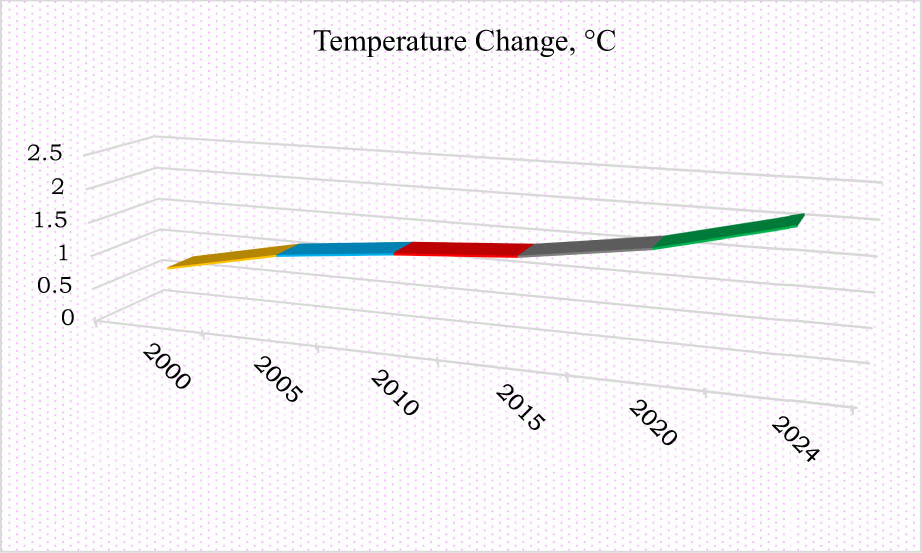
Figure 1
Global temperature change, for 2000–2024 period. *Authors’ own calculations from the data harvested from www.fao.org/faostat/en/#home.
Table 1
Continent-wise cattle and buffalo population (total animals)
| Year | Africa | Asia | America | Oceania | Europe |
|---|---|---|---|---|---|
| 1990 | 194,461,462 | 543,256,103 | 434,094,447 | 31,867,546 | 243,626,856 |
| 1995 | 209,040,633 | 603,495,095 | 462,049,705 | 35,778,156 | 178,342,381 |
| 2000 | 235,761,589 | 601,164,319 | 461,798,457 | 37,352,572 | 148,141,414 |
| 2005 | 262,776,648 | 606,923,879 | 512,917,721 | 38,010,888 | 131,608,857 |
| 2010 | 302,079,098 | 630,676,151 | 510,596,248 | 37,345,103 | 124,838,782 |
| 2015 | 339,296,400 | 637,740,623 | 514,049,211 | 37,960,108 | 122,369,705 |
| 2020 | 376,910,683 | 669,663,981 | 532,610,534 | 34,030,931 | 116,634,605 |
| 2023 | 391,835,619 | 689,142,758 | 552,510,960 | 39,896,472 | 111,819,335 |
| % Change 1990–2023 | 101.50 | 26.85 | 27.28 | 25.19 | −54.10 |
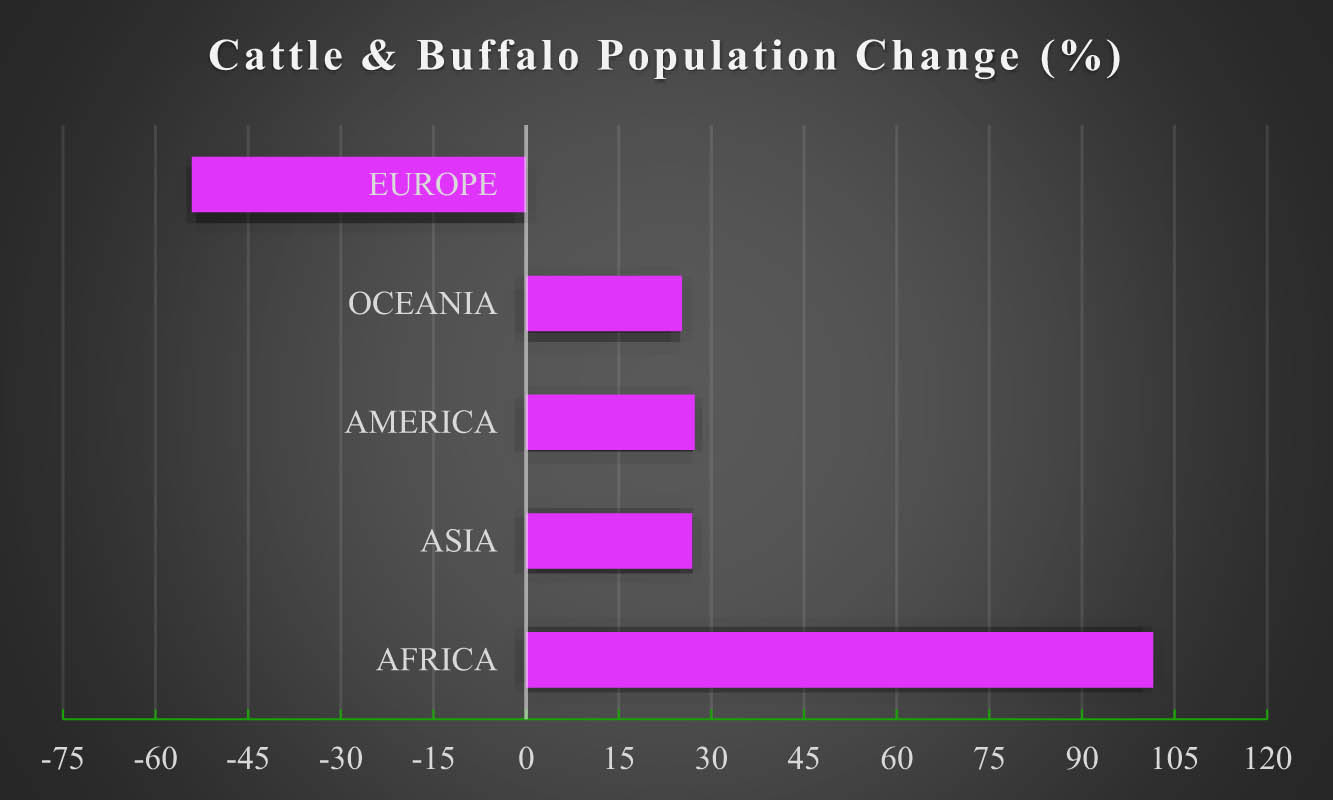
Figure 2
Continent-wise cattle and buffalo population change (%), for 1990–2023 period. *Authors’ own calculations from the data harvested from www.fao.org/faostat/en/#home.
Table 2
Continent-wise sheep and goat population (total animals)
| Year | Africa | Asia | America | Oceania | Europe |
|---|---|---|---|---|---|
| 1990 | 389,938,993 | 700,196,765 | 160,909,944 | 231,083,798 | 317,410,193 |
| 1995 | 422,945,894 | 827,073,460 | 137,228,166 | 171,888,081 | 198,492,194 |
| 2000 | 496,653,240 | 867,842,202 | 124,105,017 | 163,215,826 | 167,875,835 |
| 2005 | 577,650,449 | 927,484,139 | 127,613,295 | 144,865,129 | 155,884,965 |
| 2010 | 671,865,640 | 939,959,216 | 125,119,312 | 104,576,798 | 147,633,522 |
| 2015 | 768,403,048 | 1031,936,482 | 119,088,485 | 104,056,291 | 147,769,653 |
| 2020 | 913,018,780 | 1100,192,344 | 122,098,953 | 94,017,602 | 139,742,434 |
| 2023 | 958,333,257 | 1139,873,420 | 120,410,673 | 101,013,518 | 131,423,660 |
| % Change 1990–2023 | 145.76 | 62.79 | −25.17 | −56.29 | −58.60 |
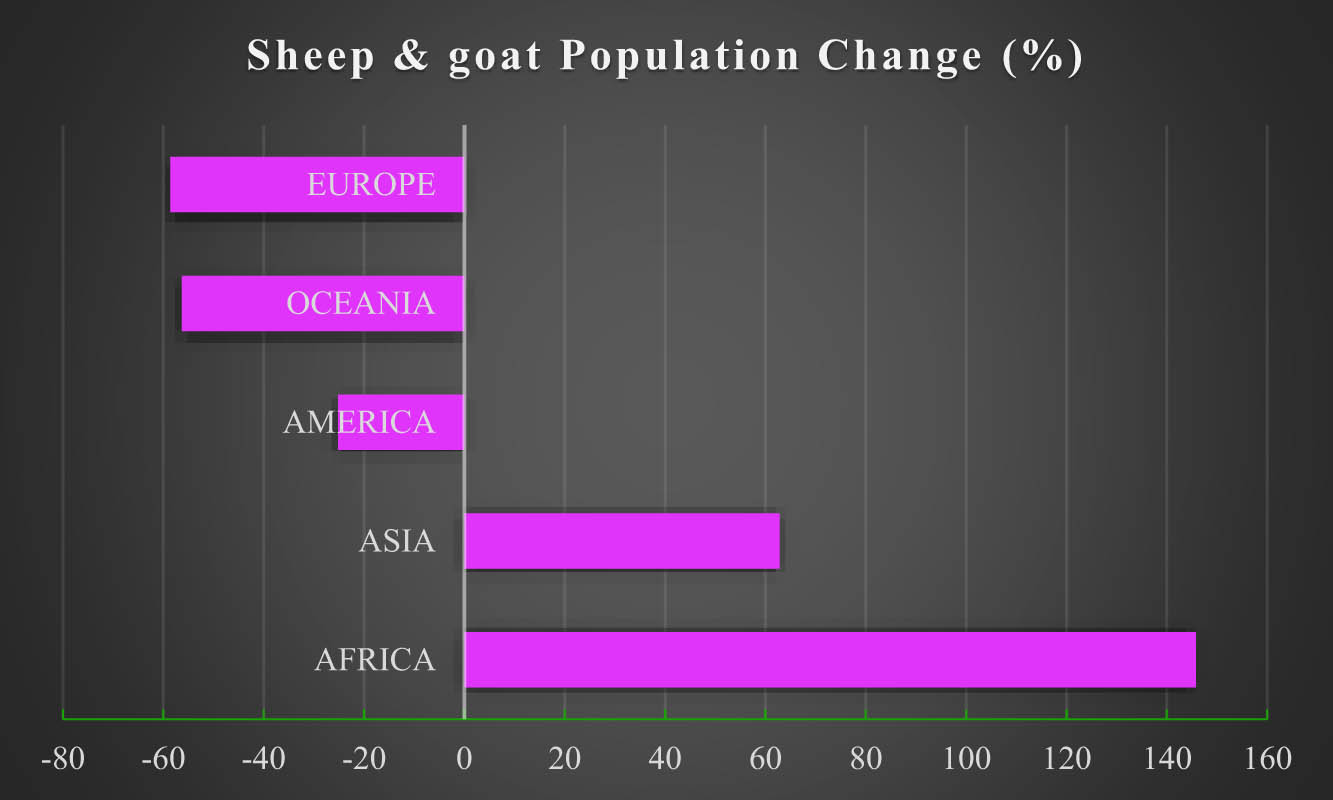
Figure 3
Continent-wise sheep and goat population change (%), for 1990–2023 period. *Authors’ own calculations from the data harvested from www.fao.org/faostat/en/#home.
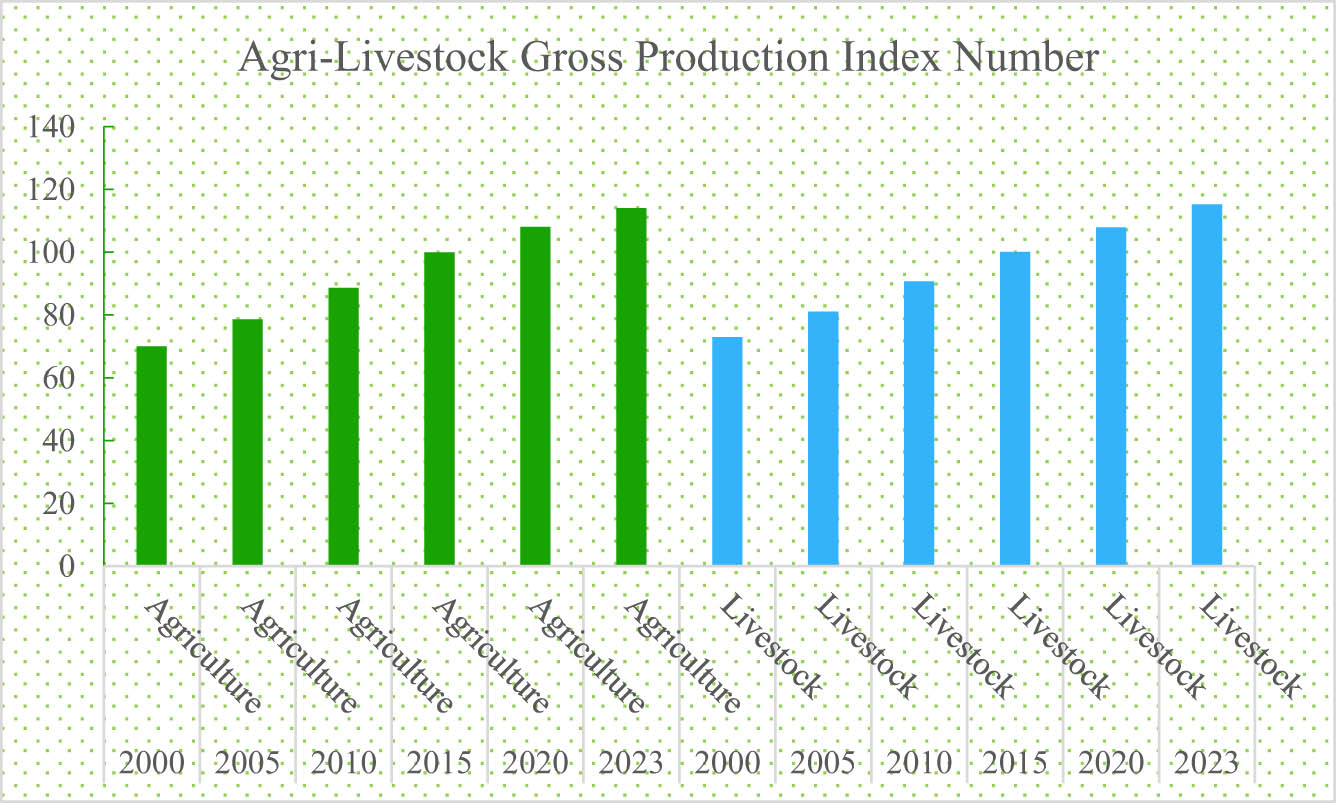
Figure 4
Global gross production from agriculture and livestock sector, for 2000–2023 period. *Authors’ own calculations from the data harvested from www.fao.org/faostat/en/#home.
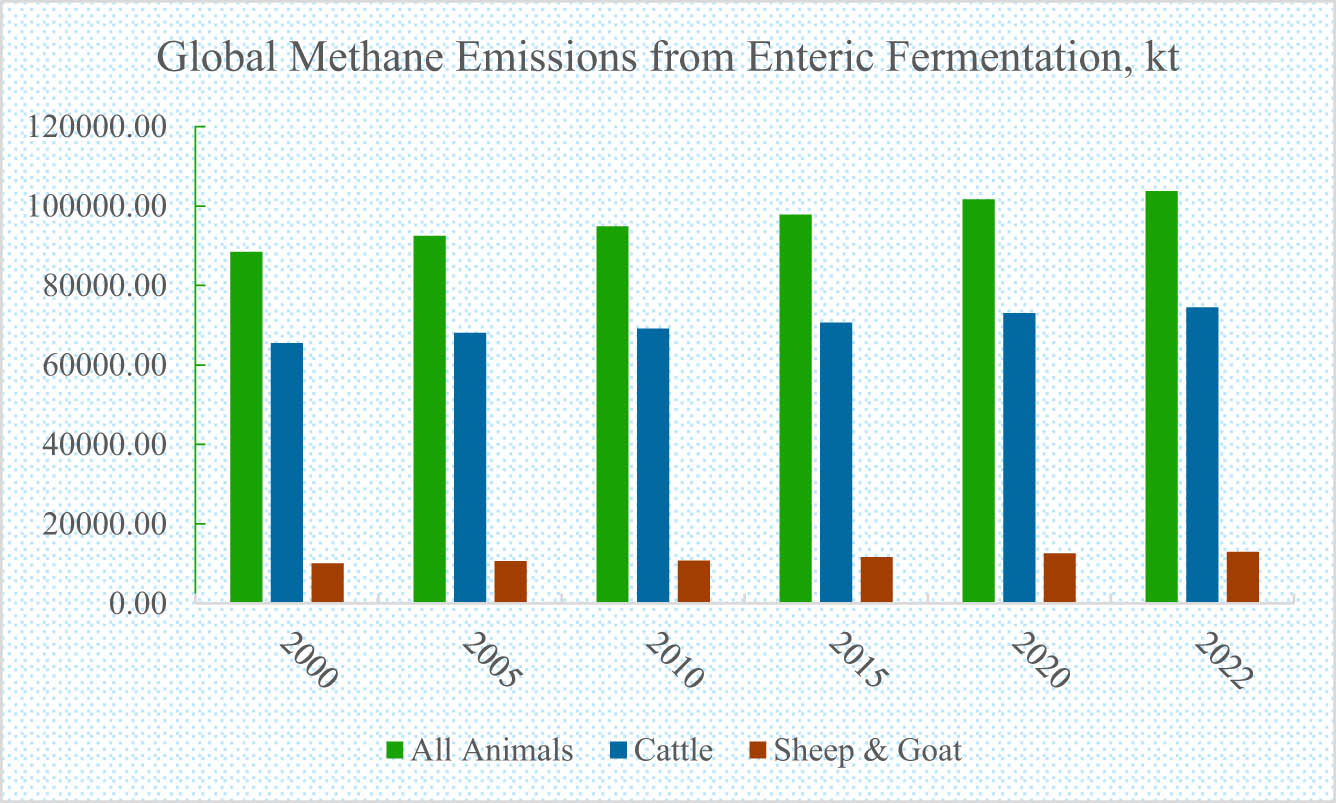
Figure 5
Methane emissions from enteric fermentation (kt), for 2000–2022 period. *Authors’ own calculations from the data harvested from www.fao.org/faostat/en/#home.
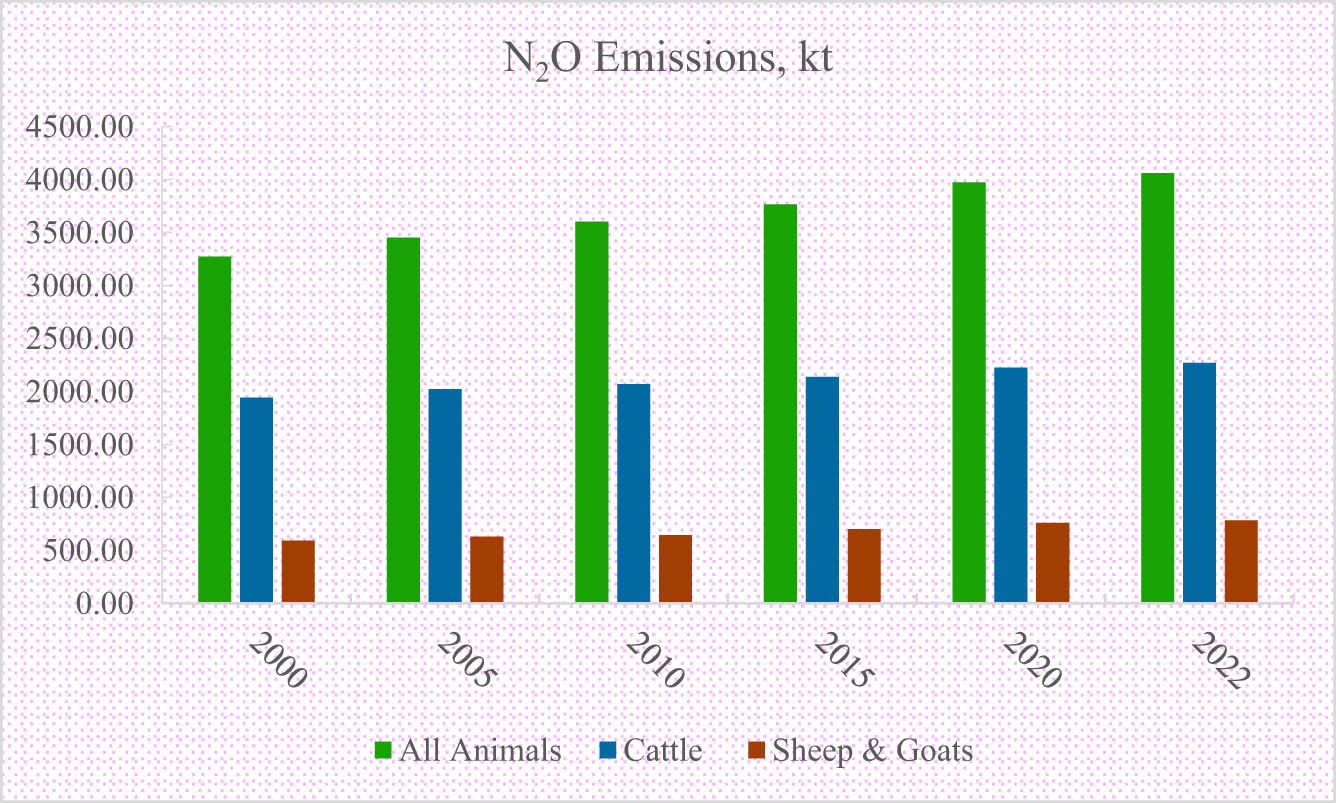
Figure 6
N2O emissions (kt), for 2000–2022 period. *Authors’ own calculations from the data harvested from www.fao.org/faostat/en/#home.
Table 3
Methane and N2O emissions (kt) from the poultry sector
| Year | Broiler | Layer | Broiler | Layer |
|---|---|---|---|---|
| CH4 emissions, kt | N2O emissions, kt | |||
| 2000 | 163.17 | 291.01 | 108.85 | 89.71 |
| 2005 | 199.23 | 332.42 | 134.43 | 103.09 |
| 2010 | 241.05 | 345.90 | 162.71 | 117.46 |
| 2015 | 270.81 | 369.69 | 176.50 | 128.31 |
| 2020 | 328.96 | 384.05 | 212.74 | 146.66 |
| 2022 | 346.64 | 376.47 | 225.33 | 141.25 |
| % Change 2000–2022 | 112.44 | 29.37 | 107.00 | 57.46 |
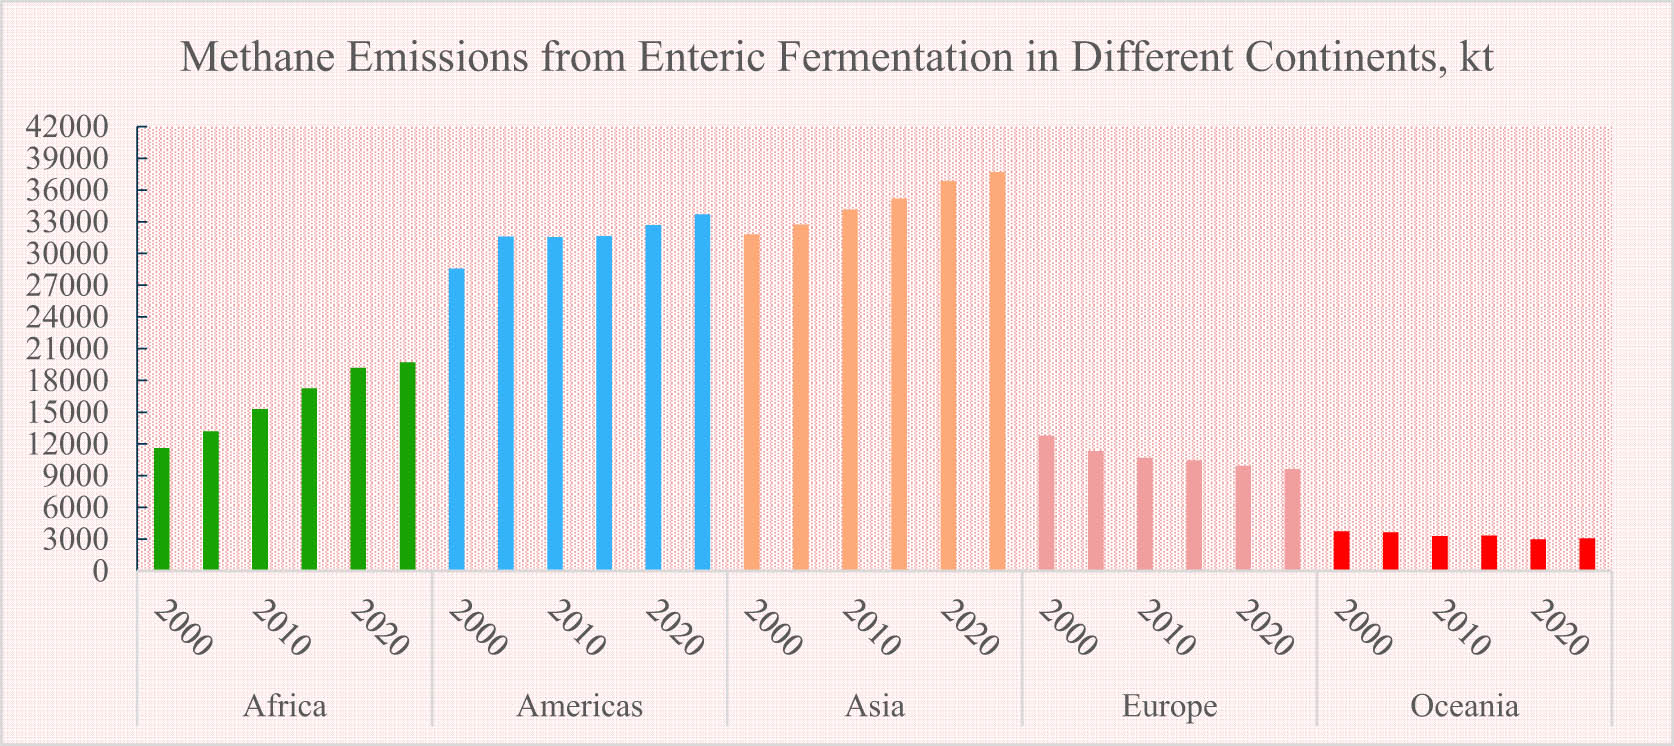
Figure 7
Continent-wise methane emissions from enteric fermentation (kt), for 2000–2022 period. *Authors’ own calculations from the data harvested from www.fao.org/faostat/en/#home.
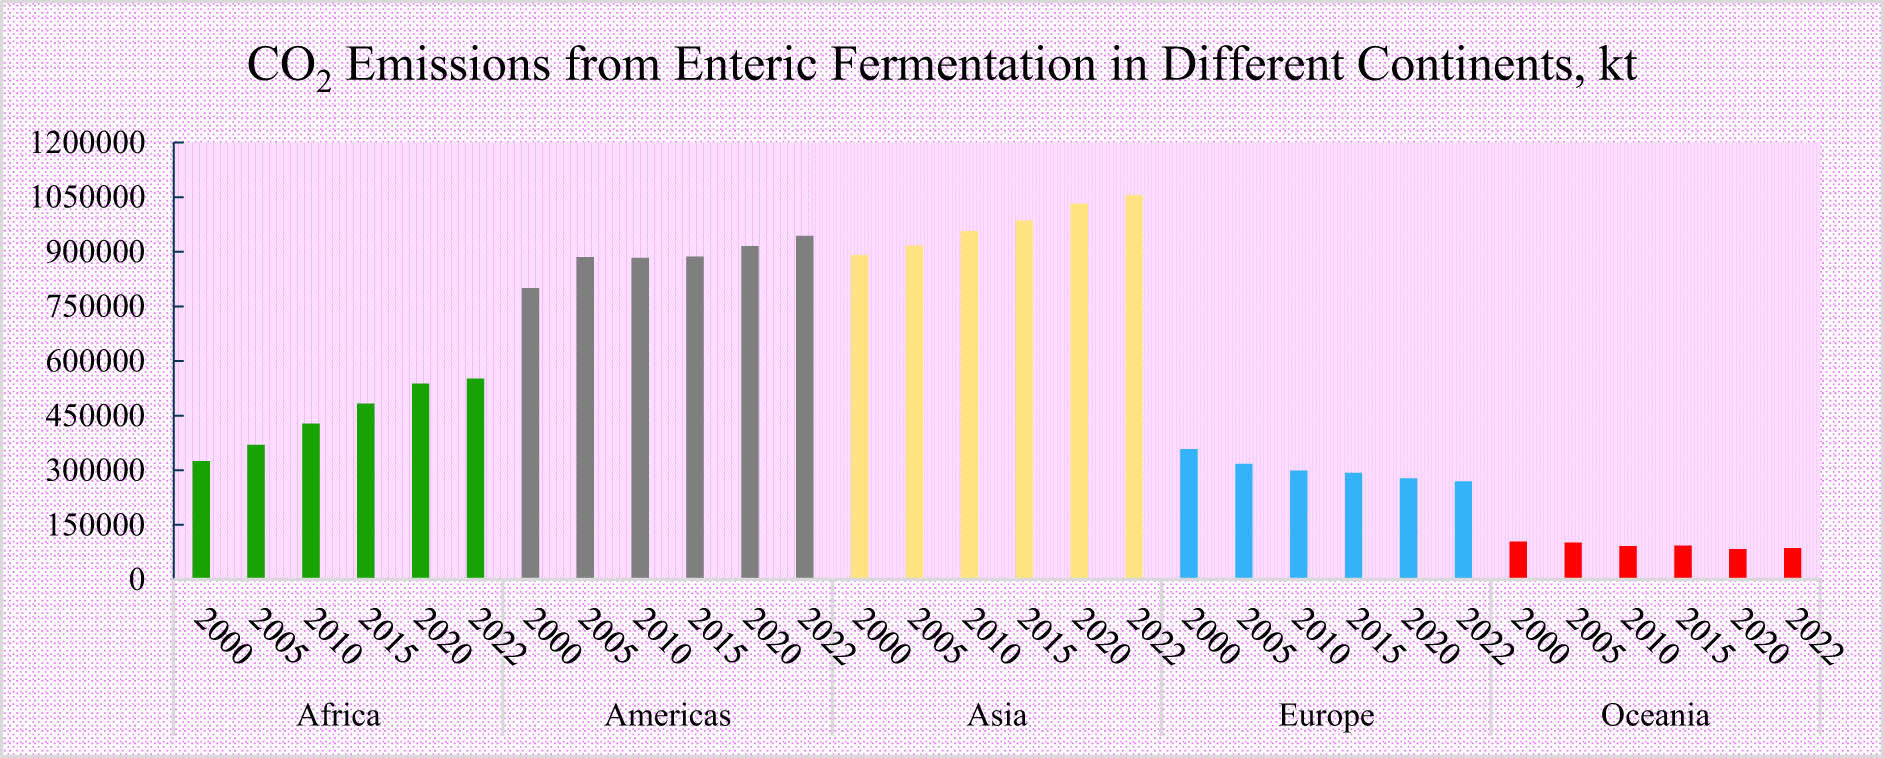
Figure 8
Continent-wise CO2 emissions from enteric fermentation (kt), for 2000–2022 period. *Authors’ own calculations from the data harvested from www.fao.org/faostat/en/#home.
Table 4
GHG emissions from crops, agriculture, and other allied production sectors (kt) in Africa
| Year | Crop residue | Agricultural soils | Rice cultivation | Manure management | Waste disposal | Food transport | Food processing | Food packaging | Energy |
|---|---|---|---|---|---|---|---|---|---|
| N2O, kt | CH4, kt | ||||||||
| 1990 | 21.15 | 419.11 | 693.08 | 360.34 | 3871.44 | 2.5003 | 0.1452 | 2.63 | 15224.28 |
| 1995 | 22.75 | 453.16 | 825.64 | 391.90 | 4358.45 | 3.01 | 0.60 | 0.76 | 19625.54 |
| 2000 | 24.61 | 516.07 | 917.66 | 446.46 | 4681.77 | 3.43 | 0.46 | 0.78 | 21068.18 |
| 2005 | 31.49 | 590.93 | 1052.08 | 506.21 | 4962.02 | 4.05 | 0.51 | 1.44 | 20504.38 |
| 2010 | 35.46 | 683.43 | 1247.52 | 588.96 | 5265.30 | 5.46 | 0.54 | 2.46 | 19507.85 |
| 2015 | 39.61 | 767.97 | 1411.99 | 676.04 | 5522.51 | 7.04 | 1.01 | 1.80 | 19478.53 |
| 2020 | 44.11 | 877.55 | 1685.66 | 768.24 | 5776.45 | 7.53 | 1.36 | 2.34 | 18745.38 |
| 2022 | 45.24 | 885.63 | 1721.25 | 791.79 | 5824.57 | 7.96 | 1.51 | 1.83 | 18869.09 |
| % Change 1990–2022 | 113.90 | 111.31 | 148.35 | 119.73 | 50.45 | 218.36 | 940.01 | −30.38 | 23.94 |
Table 5
GHG emissions from crops, agriculture, and other allied production sectors (kt) in America
| Year | Crop residue | Agricultural soils | Rice cultivation | Manure management | Waste disposal | Food transport | Food processing | Food packaging | Energy |
|---|---|---|---|---|---|---|---|---|---|
| N2O, kt | CH4, kt | ||||||||
| 1990 | 97.94 | 981.66 | 1089.71 | 1950.65 | 7253.23 | 27.99 | 27.37 | 12.11 | 18712.61 |
| 1995 | 97.26 | 1034.58 | 1240.20 | 2003.76 | 7761.87 | 31.76 | 13.54 | 6.28 | 19329.71 |
| 2000 | 112.92 | 1066.09 | 1224.12 | 2016.72 | 8214.11 | 35.16 | 14.98 | 5.51 | 20714.35 |
| 2005 | 126.82 | 1170.39 | 1302.66 | 2126.25 | 8351.54 | 39.35 | 17.90 | 5.85 | 20867.07 |
| 2010 | 140.79 | 1224.84 | 1308.42 | 2161.98 | 9367.80 | 42.40 | 24.17 | 6.78 | 20961.2 |
| 2015 | 162.78 | 1271.21 | 1127.15 | 2231.45 | 9295.97 | 45.06 | 18.00 | 6.16 | 20953.59 |
| 2020 | 174.24 | 1379.09 | 1164.29 | 2374.39 | 9417.24 | 38.93 | 17.58 | 4.44 | 18461.67 |
| 2022 | 172.84 | 1395.16 | 1019.11 | 2372.56 | 9395.68 | 43.10 | 15.87 | 4.37 | 19230.33 |
| % Change 1990–2022 | 76.46 | 42.12 | −6.48 | 21.63 | 29.54 | 53.98 | −42.02 | −63.89 | 2.77 |
Table 6
GHG emissions from crops, agriculture, and other allied production sectors (kt) in Asia
| Year | Crop residue | Agricultural soils | Rice cultivation | Manure management | Waste disposal | Food transport | Food processing | Food packaging | Energy |
|---|---|---|---|---|---|---|---|---|---|
| N2O, kt | CH4, kt | ||||||||
| 1990 | 181.30 | 1333.94 | 19973.83 | 2756.69 | 16300.11 | 14.54 | 158.05 | 62.93 | 36265.77 |
| 1995 | 194.98 | 1590.90 | 20325.16 | 3194.67 | 18171.91 | 19.03 | 195.20 | 88.00 | 40801.57 |
| 2000 | 204.01 | 1644.59 | 20880.00 | 3299.90 | 19295.38 | 23.20 | 133.12 | 69.34 | 43188.99 |
| 2005 | 217.49 | 1818.59 | 20853.86 | 3532.77 | 20210.41 | 29.96 | 241.99 | 145.13 | 54476.02 |
| 2010 | 238.16 | 2009.19 | 21554.62 | 3833.76 | 21175.73 | 38.88 | 314.30 | 179.42 | 64115.12 |
| 2015 | 259.03 | 2107.46 | 21296.87 | 3990.49 | 21978.71 | 49.86 | 242.72 | 181.62 | 70228.74 |
| 2020 | 271.29 | 2197.22 | 21456.09 | 3925.43 | 22540.25 | 51.21 | 118.55 | 158.13 | 72923.66 |
| 2022 | 275.83 | 2174.70 | 21397.51 | 4055.13 | 22565.37 | 53.89 | 121.06 | 164.57 | 79611.33 |
| % Change 1990–2022 | 52.14 | 63.03 | 7.13 | 47.10 | 38.44 | 270.53 | -23.40 | 161.49 | 119.52 |
Table 7
GHG emissions from crops, agriculture, and other allied production sectors (kt) in Europe
| Year | Crop residue | Agricultural soils | Rice cultivation | Manure management | Waste disposal | Food transport | Food processing | Food packaging | Energy |
|---|---|---|---|---|---|---|---|---|---|
| N2O, kt | CH4, kt | ||||||||
| 1990 | 99.44 | 829.14 | 381.78 | 3904.12 | 4418.23 | 19.73 | 17.73 | 3.14 | 23787.26 |
| 1995 | 75.02 | 566.03 | 235.49 | 3111.10 | 4557.98 | 18.43 | 28.79 | 4.21 | 15735.68 |
| 2000 | 75.02 | 519.62 | 259.49 | 2797.01 | 5525.86 | 18.84 | 29.45 | 3.34 | 14094.74 |
| 2005 | 80.18 | 501.18 | 252.60 | 2626.59 | 5208.25 | 18.62 | 31.92 | 4.16 | 14925.06 |
| 2010 | 75.52 | 497.13 | 301.24 | 2554.72 | 4789.83 | 18.70 | 25.33 | 4.84 | 15087.47 |
| 2015 | 93.38 | 530.49 | 274.85 | 2547.75 | 4784.83 | 17.99 | 19.23 | 5.31 | 15201.98 |
| 2020 | 95.62 | 538.76 | 269.35 | 2507.65 | 4266.08 | 16.82 | 18.47 | 5.27 | 15865.19 |
| 2022 | 97.02 | 497.75 | 225.60 | 2412.27 | 4268.73 | 18.46 | 19.34 | 5.88 | 16139.85 |
| % Change 1990–2022 | −2.43 | −39.97 | −40.91 | −38.21 | −3.38 | −6.44 | 9.04 | 86.71 | −32.15 |
Table 8
GHG emissions from crops, agriculture and other allied production sectors (kt) in Oceania
| Year | Crop residue | Agricultural soils | Rice cultivation | Manure management | Waste disposal | Food transport | Food processing | Food packaging | Energy |
|---|---|---|---|---|---|---|---|---|---|
| N2O, kt | CH4, kt | ||||||||
| 1990 | 5.12 | 144.69 | 34.91 | 289.14 | 154.94 | 2.12 | 2.08 | 0.80 | 994.071 |
| 1995 | 3.71 | 137.20 | 41.91 | 301.90 | 188.58 | 2.36 | 2.14 | 0.76 | 1099.23 |
| 2000 | 7.40 | 146.63 | 43.06 | 316.81 | 198.97 | 2.60 | 2.38 | 0.89 | 1263.82 |
| 2005 | 7.49 | 144.46 | 17.38 | 328.05 | 211.13 | 2.65 | 2.30 | 0.71 | 1460.82 |
| 2010 | 7.39 | 130.85 | 6.73 | 316.84 | 218.54 | 2.62 | 2.53 | 0.91 | 1647.51 |
| 2015 | 7.98 | 139.12 | 22.70 | 330.21 | 221.46 | 2.61 | 1.75 | 0.38 | 1611.08 |
| 2020 | 6.01 | 135.58 | 2.36 | 305.79 | 228.68 | 2.16 | 1.65 | 0.41 | 1455.41 |
| 2022 | 11.42 | 145.50 | 20.62 | 311.90 | 229.48 | 2.06 | 1.50 | 0.41 | 1292.79 |
| % Change 1990–2022 | 122.83 | 0.55 | −40.94 | 7.87 | 48.11 | −2.81 | −27.49 | −48.61 | 30.05 |
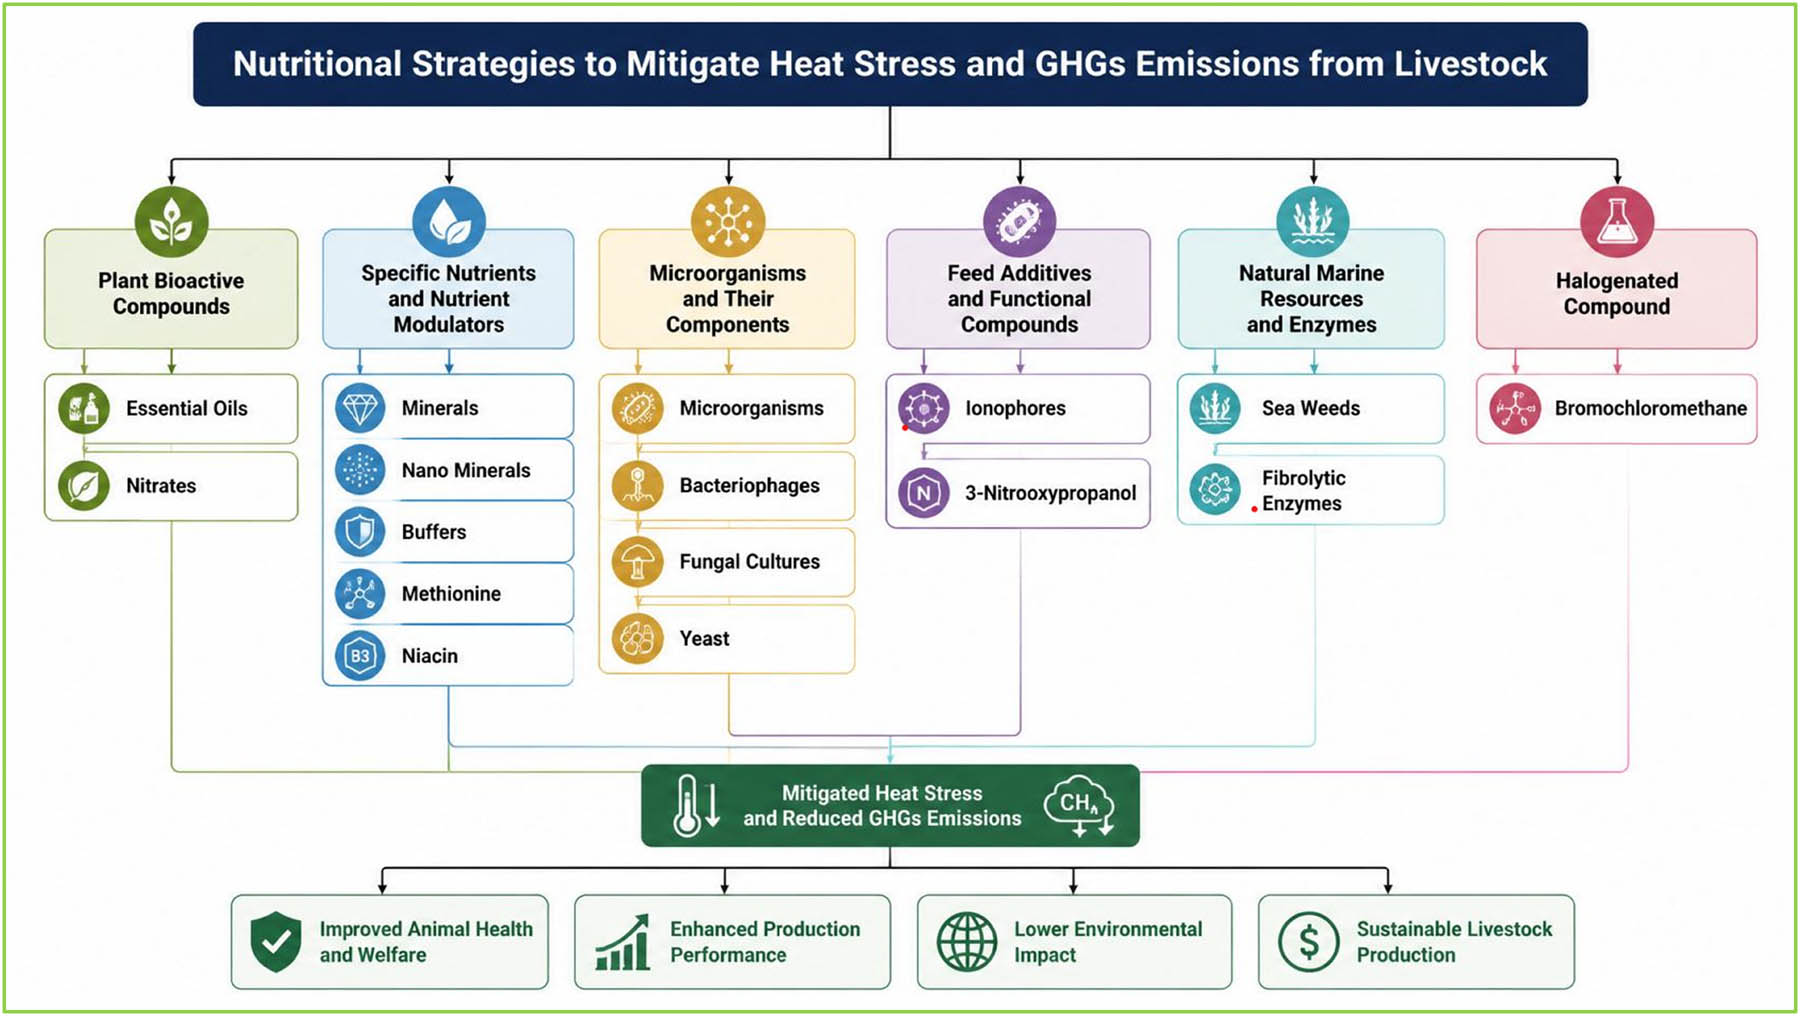
Figure 9
Heat stress, greenhouse gas emissions and some nutritional interventions in ruminants.