
1. Introduction
The world currently faces growing scarcity of food, land, and water. The Intergovernmental Panel on Climate Change (IPCC) projects a further rise in global temperatures of 1.5–4°C by 2050 (IPCC: Intergovernmental Panel on Climate Change, 2021). This inevitable warming, along with the extreme climatic events it brings – such as heatwaves, extreme temperature and humidity, high temperature-humidity index (THI) conditions, and abrupt rainfall or flooding – will negatively affect the agri-livestock sector, which provides food and other essential resources (Rojas-Downing et al., 2017; Wankar et al., 2021). To meet ever-increasing human food demand, more than 70% of total agricultural land is now used to rear livestock to produce milk, meat, and eggs (Frona et al., 2019; United Nations, 2019). Rapid urbanisation, population growth, and industrialisation have shifted societies from agrarian to industrial, technology-driven economies, driving economic growth alongside further depletion of natural resources (Flachowsky et al., 2017).
Livestock are reared either extensively or intensively. Extensive systems constantly expose animals to harsh weather and climatic conditions, triggering thermoregulatory mechanisms that maintain homeothermy and survival (Yadav et al., 2016; Collier et al., 2018). Of all climatic variables, extreme temperature, humidity, and their combination (THI) impose the most severe heat stress, resulting in morbidity, production and reproduction losses, and even mortality (Carvajal et al., 2021; Thornton et al., 2021). Heat stress is now a major constraint on animal production systems worldwide; not only tropical regions but also temperate and colder ones are increasingly affected, leading to a sharp decline in the supply of animal-derived foods (Lees et al., 2019; Wankar et al., 2021, 2024; World Economic Forum, 2024; McNicol et al., 2024).
Ruminants are among the most efficient livestock species, converting tough, inedible plant matter into high-quality animal protein, such as milk and meat. Their specialised, microbiome-rich stomach ferments plant fibre (cellulose, hemicellulose, and lignin) into volatile fatty acids (VFAs) through microbial digestion (Buccioni et al., 2015; Min et al., 2022; Wang et al., 2025). This anaerobic fermentation also generates by-products such as CO2, CH4, and N2O, accounting for gross energy losses of 7–15% (Eugène et al., 2008); subsequently, anthropogenic gases are emitted from ruminant dung and waste disposal (Gerber et al., 2013; Wang et al., 2021). Ruminants are therefore considered a significant source of greenhouse gases (GHGs) and often blamed for global warming and climate change, although their overall share remains small compared with other sectors, notably within agriculture itself (FAO: Food and Agriculture Organization of the United Nations, 2023; Li et al., 2024; Crippa et al., 2025).
Curbing GHG emissions from ruminants became a global priority after the FAO synthesis report “Livestock’s Long Shadow” was published (Steinfeld et al., 2006). Two decades later, however, evidence shows that other sectors, including energy, industry, construction, mining, and transportation, emit far more GHGs and have a much greater impact on global warming (Lamb et al., 2021). The 2015 Paris Agreement, the 2021 climate framework of the European Union (EU), and a recent 2024 international convention all agree that proper legislation, rigorous sectoral analysis, and strict implementation are the only ways to reduce anthropogenic emissions and reach the “zero carbon” goal by 2050 (Höhne et al., 2020; Crippa et al., 2025). Accurately estimating GHG emissions also matters, since carbon credits for livestock vary considerably across the value chain before reaching the consumer (Höglund-Isaksson et al., 2020). Tools such as life cycle assessment (LCA) and GHG inventories are widely used to measure anthropogenic emissions, but several aspects need refinement for a complete and accurate picture of sectoral emissions (Nugrahaeningtyas et al., 2024).
Because global warming, GHG emissions, climate change, and animal production are all interlinked, the livestock sector must focus on reducing GHGs while sustainably increasing production (Booth et al., 2023; Wankar & Gade, 2026). Many strategies target microbial fermentation to reduce CH4 emissions, while others aim to curb both CH4 and N2O from dung and waste. Adjusting dietary fibre or fat content and adding specific supplements have shown promising results in reducing GHG emissions while improving production (Eugène et al., 2008; Conte et al., 2018; Jago et al., 2023; Ramos-Morales et al., 2026). However, regional, managerial, and economic conditions vary widely across regions and breeds. Given this background, the following were set as the main objectives for this review: (1) understand current global sectoral GHG inventories vis-à-vis the climate change context; (2) assess livestock sector contributions across continents; and (3) discuss effective nutritional strategies for reducing heat stress and GHG emissions in ruminants.
2. Current global GHG emissions scenario: Are ruminants really the culprit?
Global anthropogenic emissions arise mainly from five sectors: energy; manufacturing industries; building and construction; transport; and agriculture and forestry (Lamb et al., 2021). The sharp rise in GHGs since World War II reflects surging power and fuel consumption together with growth in transport and manufacturing. At 50.1%, the power sector is the largest contributor of CO2 emissions, followed by industry and manufacturing (31.9%) and transport (7.1%). Fuel harvesting (49.6%) and agriculture and waste management (46.8%) are the leading sources of CH4 emissions, while N2O emissions are mainly accounted for by agriculture (58.9%) and power generation (15.9%) (Crippa et al., 2025). It is thus clear that livestock and agriculture are not the dominant contributors of GHGs, despite often being held responsible for global warming and climate change (FAO: Food and Agriculture Organization of the United Nations, 2024; Hur et al., 2024).
Two recent comprehensive analyses report that, since the start of the 21st century, more than 71% of total GHG emissions have come from China, the United States, India, Russia, Brazil, the EU, and other non-OECD nations – countries that also show the highest industrial growth, construction activity, fuel exploration, energy consumption, and population growth (Crippa et al., 2025; Xu et al., 2025). A small number of industrialised nations thus account for most of the GHG emissions, while poorer and developing countries are often blamed instead, even though emissions from China and India have genuinely risen during this period (Liu et al., 2019; Dhakal et al., 2022; Xu et al., 2025).
It is a common misconception that global GHG emissions rise linearly with livestock numbers, as suggested by the FAO’s “Livestock’s Long Shadow” report (Steinfeld et al., 2006). In reality, growth in livestock numbers is accompanied by corresponding growth in land and fertiliser use, cropped and irrigated land, transportation, processing, supply chains, and waste management, all of which contribute to anthropogenic emissions (Carrera et al., 2021; AOSTAT: Food and Agriculture Organization of the United Nations, 2022; UNFCCC: United Nations Framework Convention on Climate Change, 2023).
Two methods are commonly used to assess livestock GHG emissions: LCA and GHG inventories. LCA offers a comprehensive assessment of emissions from raw materials to final product (Muralikrishna & Manickam, 2017), but it is complex and prone to inaccurate reporting, over-compensation, and sectoral overlap (FAO: Food and Agriculture Organization of the United Nations, 2019; Nugrahaeningtyas et al., 2024). GHG inventories estimate total territorial emissions and can also evaluate emission cycles from livestock production (Park et al., 2022); yet a more accurate system for monitoring and measuring GHG emissions is needed (Höglund-Isaksson et al., 2020).
The Paris Agreement’s 2015 goals for sustainable food production, including cutting industrial emissions and reducing GHGs from agri-livestock systems, are complicated by significant economic disparities and differing long-term development priorities across nations (Höhne et al., 2020). The EU similarly committed in 2021 to major transitions in energy, transport, and agriculture to reach zero emissions by 2030. In another convention in 2024, 107 nations pledged net-zero GHG emissions by 2050–2060 through legally binding sectoral strategies (Crippa et al., 2025). Collective efforts have already reduced global GHG emissions in some sectors, though others still need optimisation; the emissions report by Crippa et al. (2025) and climatetrace.org (2026) contain details in this regard. Even in the agriculture and livestock sector, where the overall share remains small, targeted measures are still needed to curb CH4 and N2O emissions (Ritchie, 2019; United Nations Environment Programme and Climate and Clean Air Coalition, 2021; Hur et al., 2024).
3. Climate change and understanding the role of the agri-livestock sector in GHG emissions
The IPCC projects global temperatures will rise by 1.5–4°C by 2050 (IPCC, 2021). Figure 1 tracks global temperature change from 2000 to 2024 and shows that warming accelerated markedly over the last two decades. Cattle and buffalo populations have steadily increased across Africa, Asia, Oceania, and the Americas, while declining in Europe (Table 1 and Figure 2).
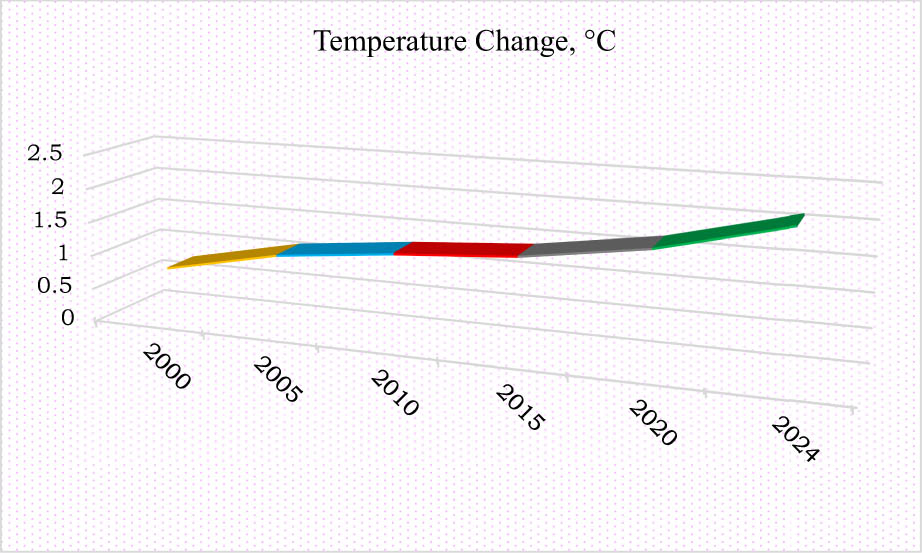
Figure 1
Global temperature change, for 2000–2024 period. *Authors’ own calculations from the data harvested from www.fao.org/faostat/en/#home.
Table 1
Continent-wise cattle and buffalo population (total animals)
| Year | Africa | Asia | America | Oceania | Europe |
|---|---|---|---|---|---|
| 1990 | 194,461,462 | 543,256,103 | 434,094,447 | 31,867,546 | 243,626,856 |
| 1995 | 209,040,633 | 603,495,095 | 462,049,705 | 35,778,156 | 178,342,381 |
| 2000 | 235,761,589 | 601,164,319 | 461,798,457 | 37,352,572 | 148,141,414 |
| 2005 | 262,776,648 | 606,923,879 | 512,917,721 | 38,010,888 | 131,608,857 |
| 2010 | 302,079,098 | 630,676,151 | 510,596,248 | 37,345,103 | 124,838,782 |
| 2015 | 339,296,400 | 637,740,623 | 514,049,211 | 37,960,108 | 122,369,705 |
| 2020 | 376,910,683 | 669,663,981 | 532,610,534 | 34,030,931 | 116,634,605 |
| 2023 | 391,835,619 | 689,142,758 | 552,510,960 | 39,896,472 | 111,819,335 |
| % Change 1990–2023 | 101.50 | 26.85 | 27.28 | 25.19 | −54.10 |
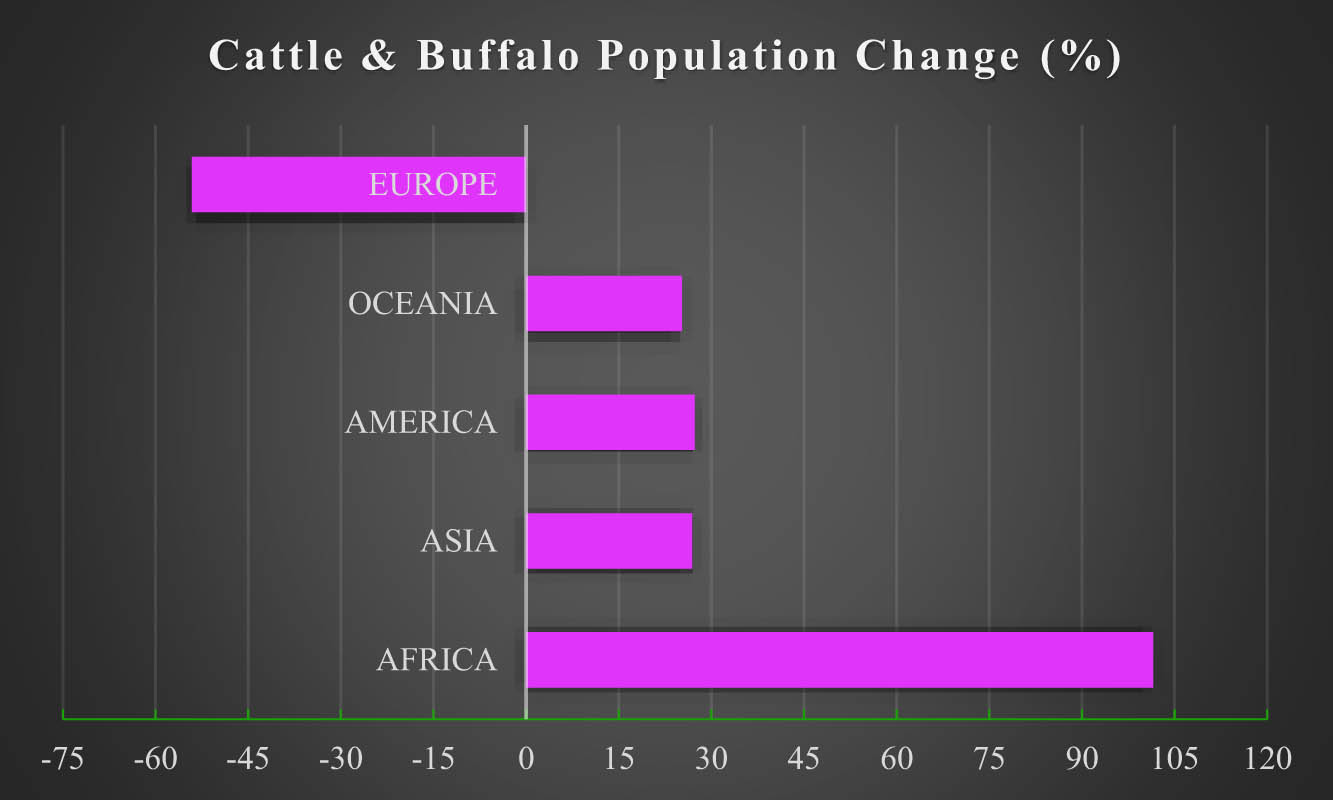
Figure 2
Continent-wise cattle and buffalo population change (%), for 1990–2023 period. *Authors’ own calculations from the data harvested from www.fao.org/faostat/en/#home.
Sheep and goat populations increased only in Africa and Asia, while the Americas, Europe, and Oceania showed a negative trend in this regard (Table 2 and Figure 3). Notably, ruminant populations have grown substantially in the tropical and subtropical regions of Africa and Asia over the past three to four decades; these regions are now the world’s top milk and beef producers. This sustainable growth likely reflects improved feeding and management practices, along with the natural heat resilience of tropical breeds (McNicol et al., 2024).
Table 2
Continent-wise sheep and goat population (total animals)
| Year | Africa | Asia | America | Oceania | Europe |
|---|---|---|---|---|---|
| 1990 | 389,938,993 | 700,196,765 | 160,909,944 | 231,083,798 | 317,410,193 |
| 1995 | 422,945,894 | 827,073,460 | 137,228,166 | 171,888,081 | 198,492,194 |
| 2000 | 496,653,240 | 867,842,202 | 124,105,017 | 163,215,826 | 167,875,835 |
| 2005 | 577,650,449 | 927,484,139 | 127,613,295 | 144,865,129 | 155,884,965 |
| 2010 | 671,865,640 | 939,959,216 | 125,119,312 | 104,576,798 | 147,633,522 |
| 2015 | 768,403,048 | 1031,936,482 | 119,088,485 | 104,056,291 | 147,769,653 |
| 2020 | 913,018,780 | 1100,192,344 | 122,098,953 | 94,017,602 | 139,742,434 |
| 2023 | 958,333,257 | 1139,873,420 | 120,410,673 | 101,013,518 | 131,423,660 |
| % Change 1990–2023 | 145.76 | 62.79 | −25.17 | −56.29 | −58.60 |
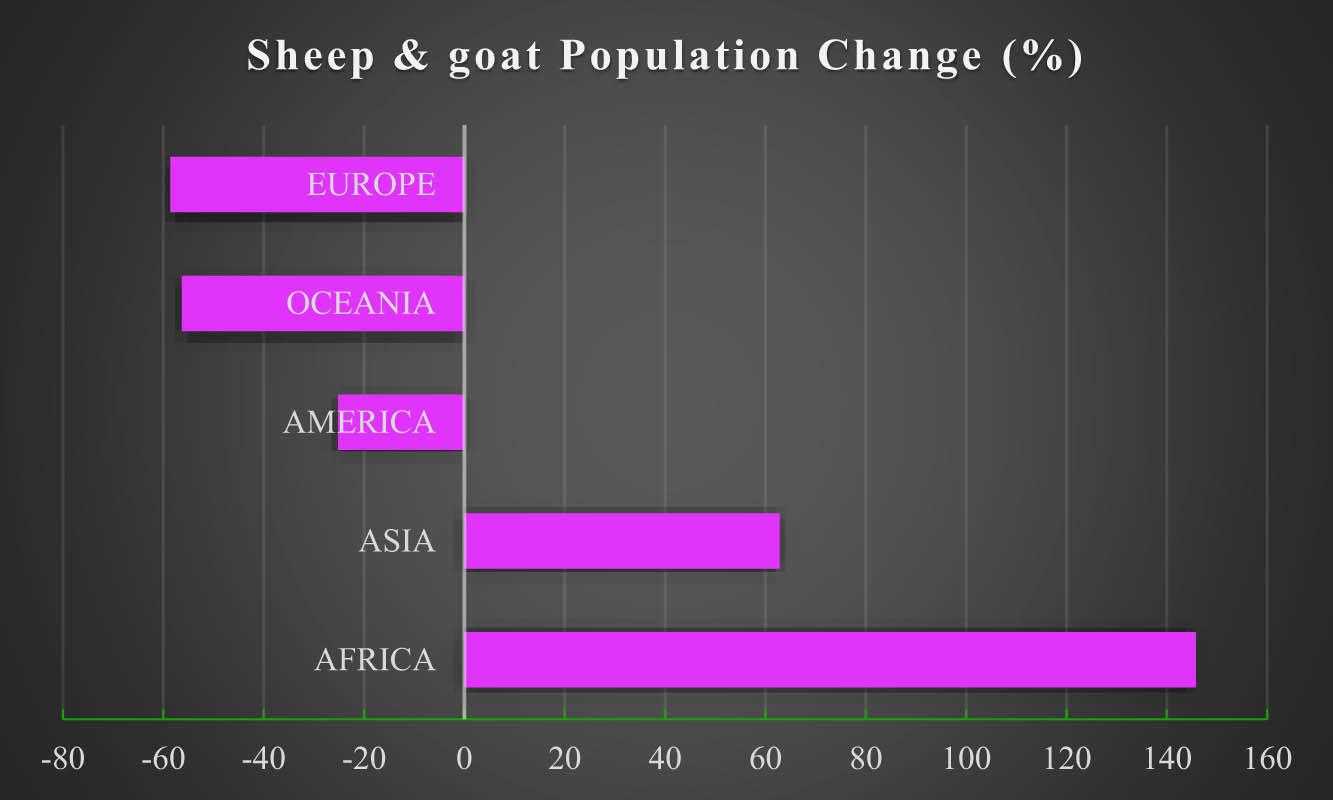
Figure 3
Continent-wise sheep and goat population change (%), for 1990–2023 period. *Authors’ own calculations from the data harvested from www.fao.org/faostat/en/#home.
Both the agriculture and livestock sectors have grown steadily from 1990 to 2023, as shown by rising gross production values (Figure 4). This growth is driven largely by industrialisation, urbanisation, population growth, and rising consumer demand for animal products. Given the growing human and livestock populations, allocating and using natural resources sustainably for both will be a major future challenge.
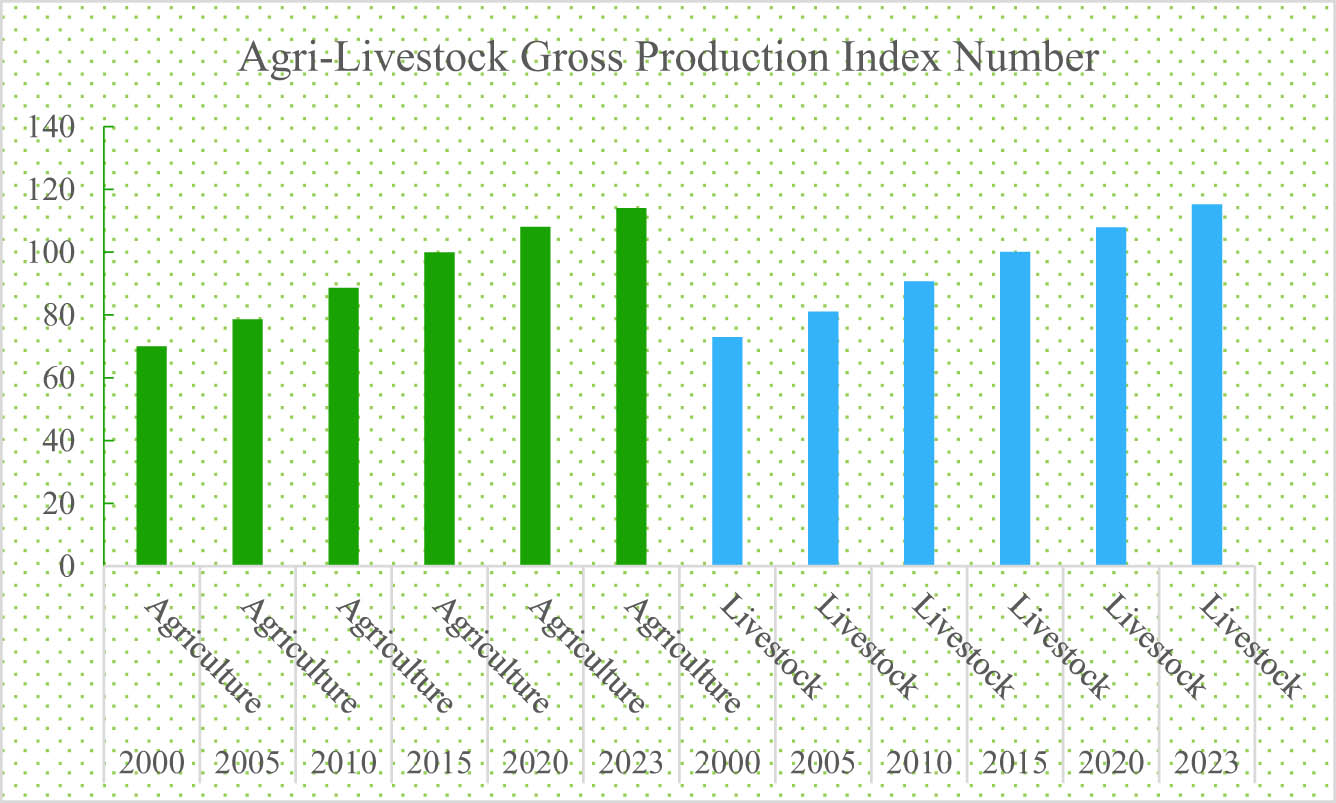
Figure 4
Global gross production from agriculture and livestock sector, for 2000–2023 period. *Authors’ own calculations from the data harvested from www.fao.org/faostat/en/#home.
Ruminants are routinely blamed for climate change and global warming because microbial fermentation releases CO2 and N2O. Livestock sector emissions (Gt) are projected to contribute only 73 CO2 out of the total estimated emissions of 1346.60 CO2 by 2050 (Lu et al., 2022; World Consumption of Meat, 2023). Even so, the ruminant share remains small relative to total industrial, vehicular, and agricultural emissions. Large ruminants, such as cattle and buffalo, emit more GHGs than smaller species, such as sheep and goats, which convert plant matter more efficiently. Figure 5 shows that, over 22 years, CH4 emissions rose only modestly for cattle (13.67%) but considerably more for sheep and goats (29%), although cattle still dominate total emissions. Similarly, N2O from ruminal fermentation and manure rose by 24.08% over the same period (Lan et al., 2024a, 2024b); the increase was smaller for cattle (16.91%) than for sheep and goats (31.90%) (Figure 6).
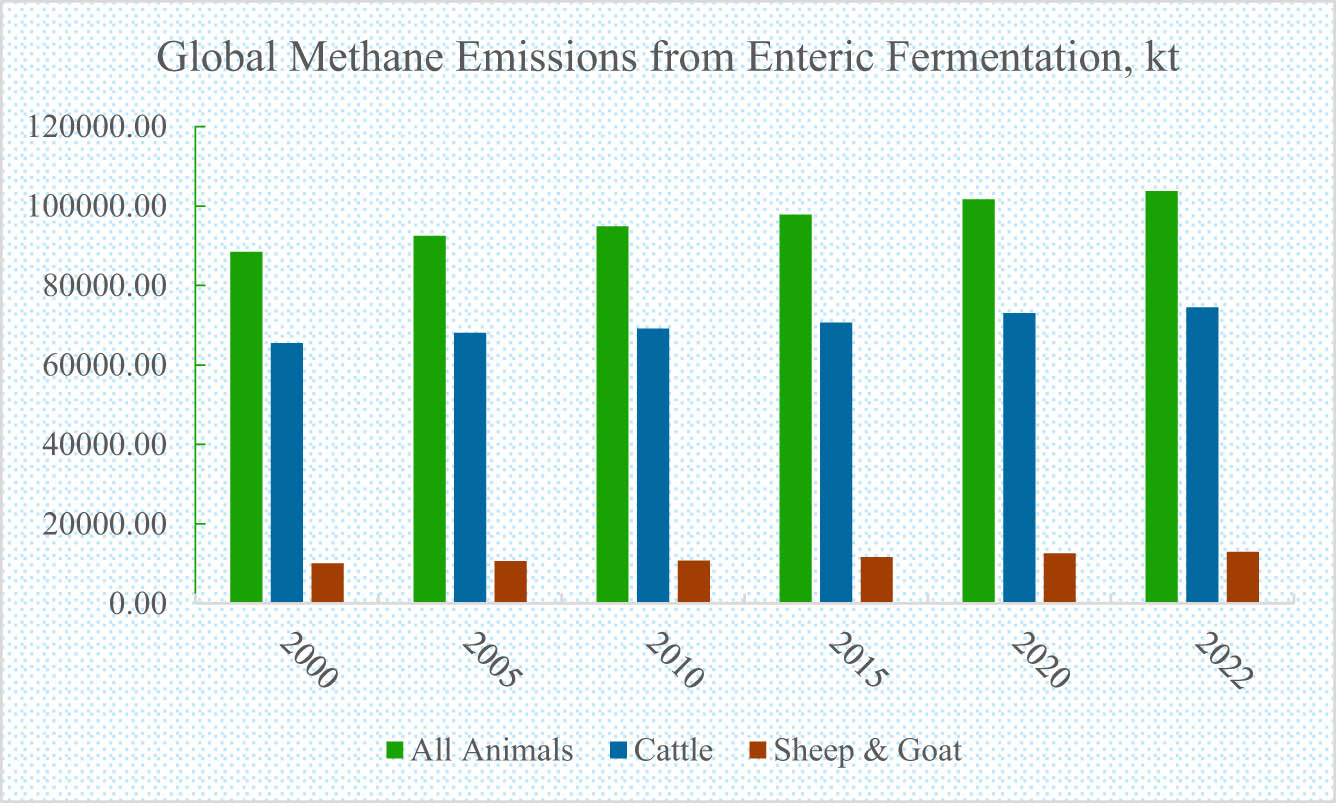
Figure 5
Methane emissions from enteric fermentation (kt), for 2000–2022 period. *Authors’ own calculations from the data harvested from www.fao.org/faostat/en/#home.
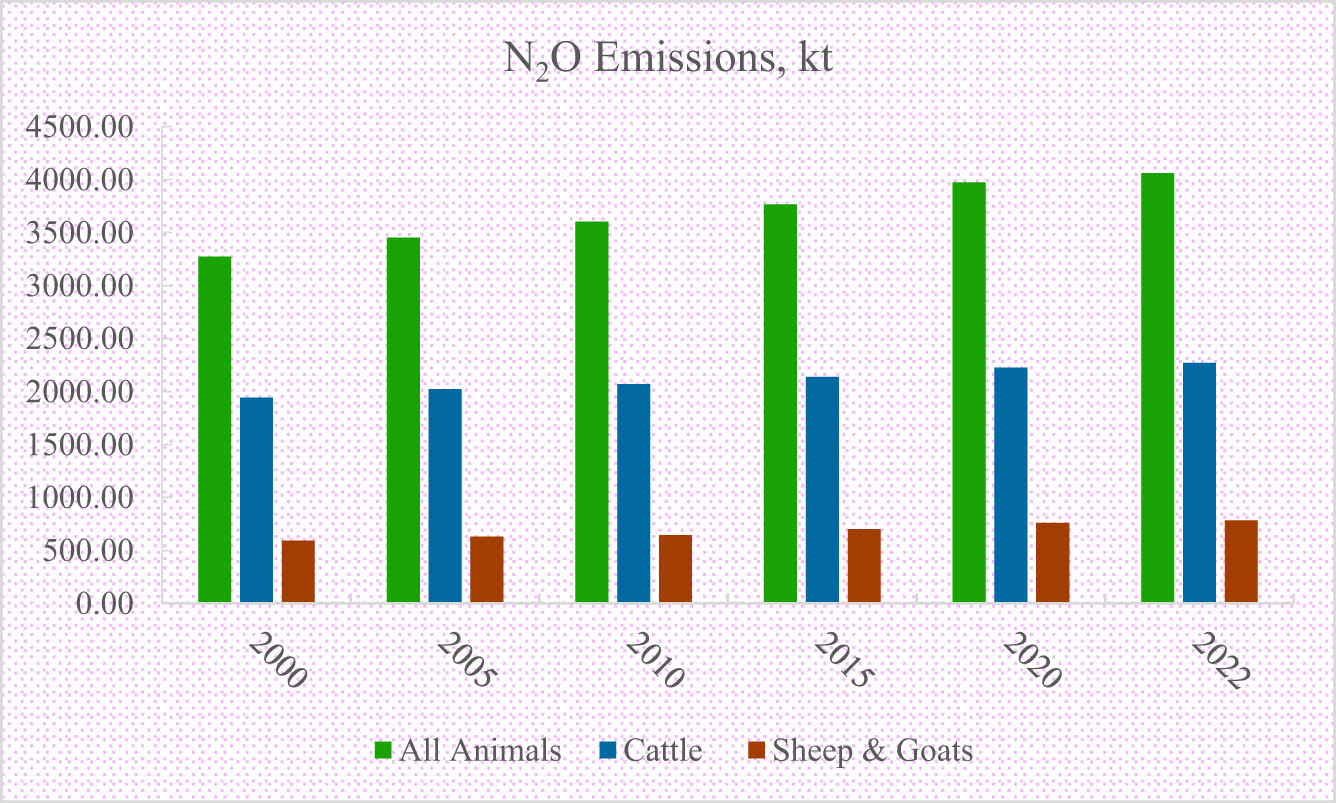
Figure 6
N2O emissions (kt), for 2000–2022 period. *Authors’ own calculations from the data harvested from www.fao.org/faostat/en/#home.
Poultry is also a substantial source of CH4 and N2O. As demand for meat and animal products grows, commercial poultry production and its associated emissions are rising as well (Ritchie, 2019). Table 3 shows a marked increase in poultry CH4 and N2O emissions over the last two to three decades compared with those of ruminants (Figures 5 and 6). Continent-specific CH4 and CO2 emissions are shown in Figures 7 and 8; the Americas are proportionally the top CH4 and CO2 emitters, followed closely by Asia and Africa, while Europe and Oceania show declining or stable trends. This pattern becomes clearer when compared with ruminant population growth (Figures 2 and 3): Asia and Africa show substantial livestock growth, whereas the other continents show little or no growth in this regard. Nevertheless, the high-producing American, Oceanic, and European breeds still emit disproportionately more CO2 and CH4, contributing significantly to total GHG inventories.
Table 3
Methane and N2O emissions (kt) from the poultry sector
| Year | Broiler | Layer | Broiler | Layer |
|---|---|---|---|---|
| CH4 emissions, kt | N2O emissions, kt | |||
| 2000 | 163.17 | 291.01 | 108.85 | 89.71 |
| 2005 | 199.23 | 332.42 | 134.43 | 103.09 |
| 2010 | 241.05 | 345.90 | 162.71 | 117.46 |
| 2015 | 270.81 | 369.69 | 176.50 | 128.31 |
| 2020 | 328.96 | 384.05 | 212.74 | 146.66 |
| 2022 | 346.64 | 376.47 | 225.33 | 141.25 |
| % Change 2000–2022 | 112.44 | 29.37 | 107.00 | 57.46 |
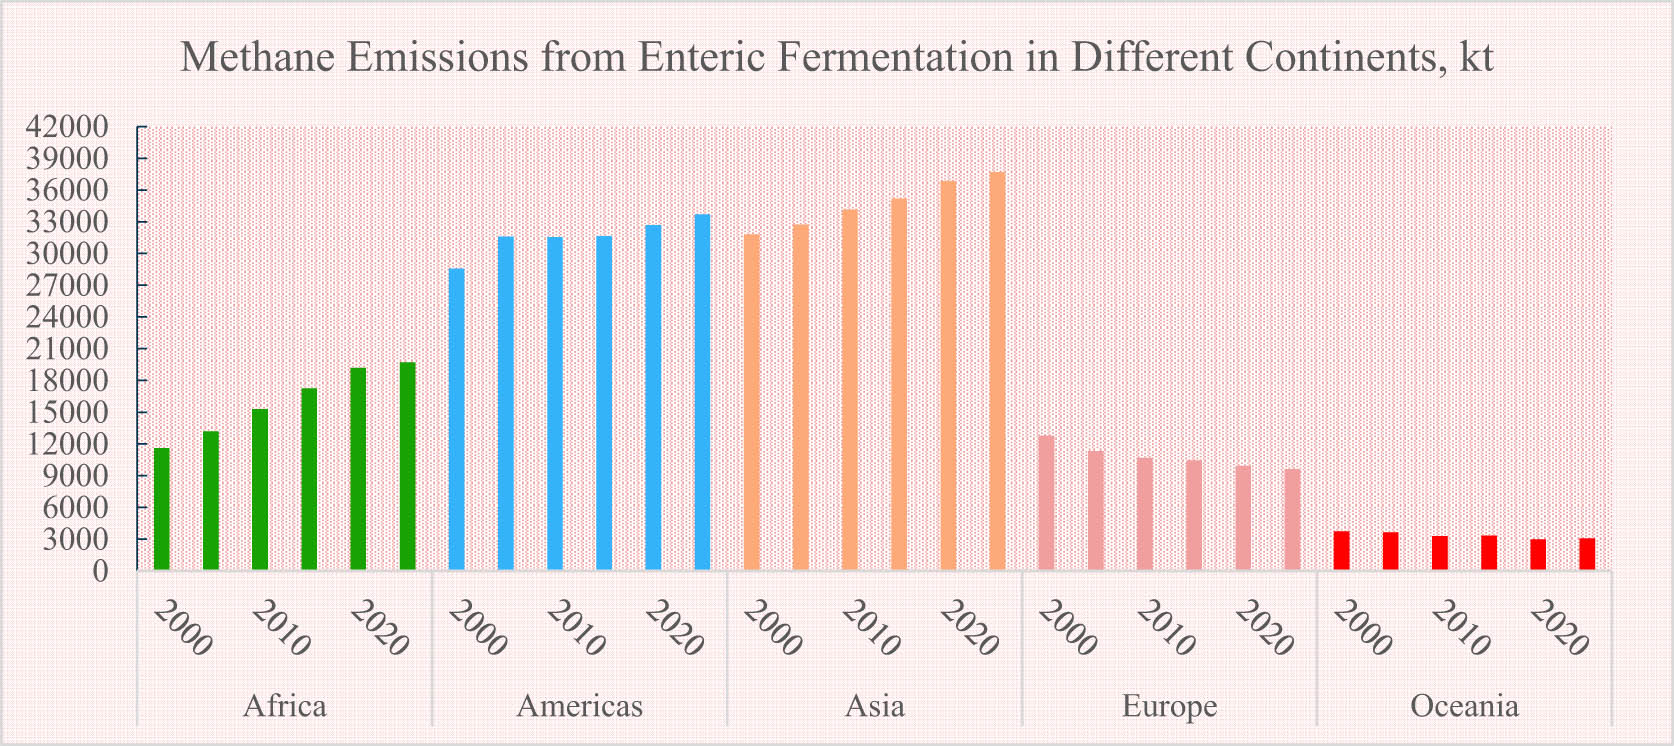
Figure 7
Continent-wise methane emissions from enteric fermentation (kt), for 2000–2022 period. *Authors’ own calculations from the data harvested from www.fao.org/faostat/en/#home.
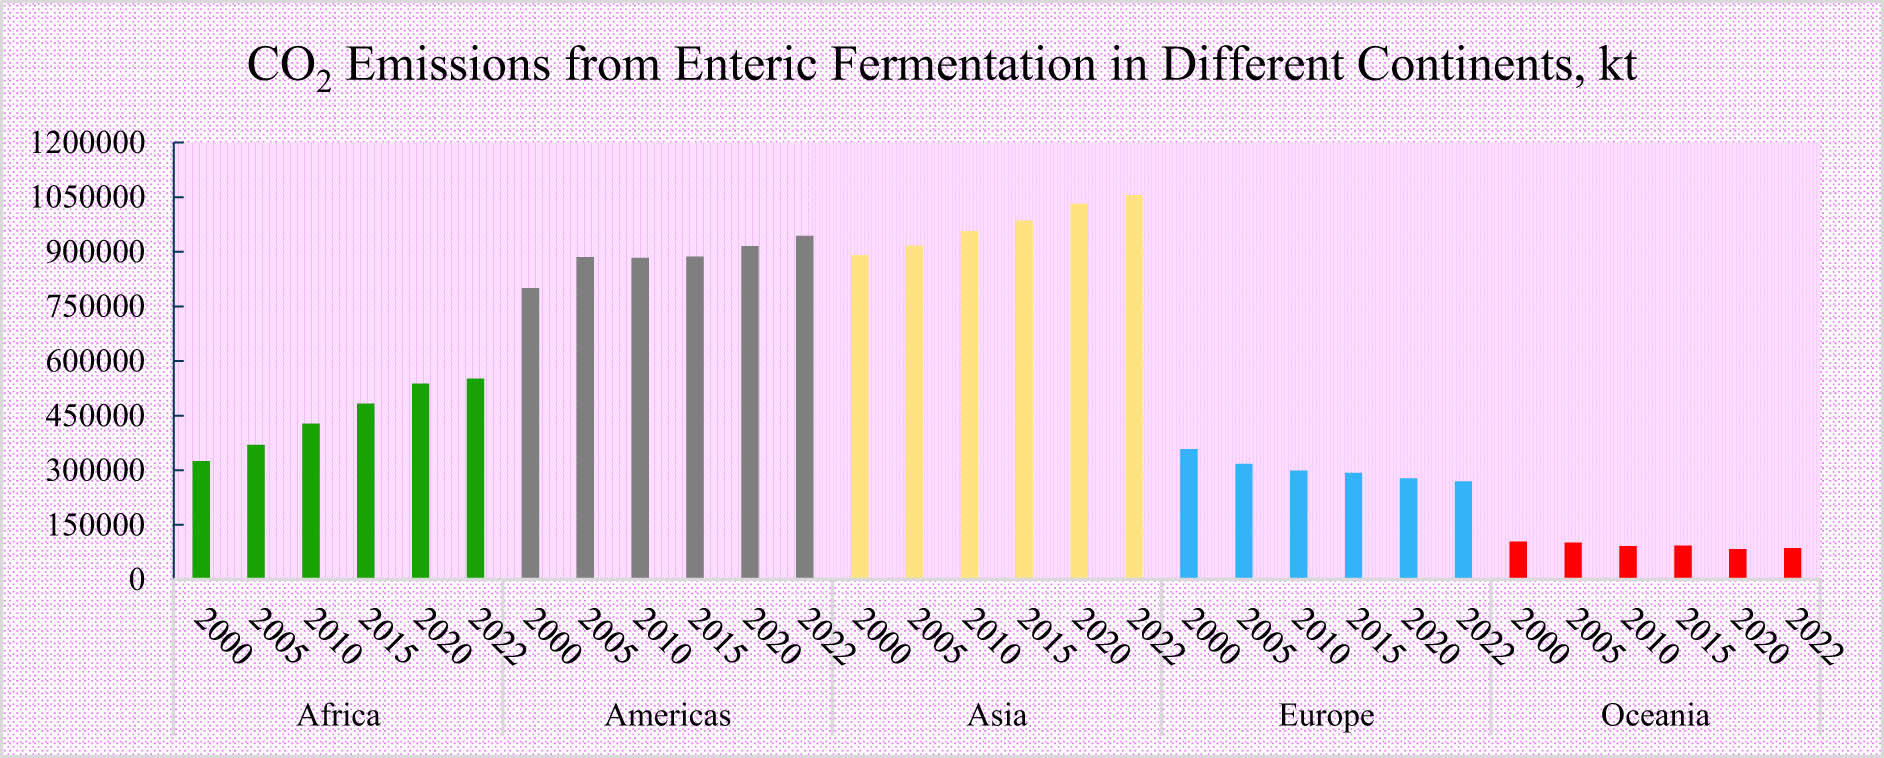
Figure 8
Continent-wise CO2 emissions from enteric fermentation (kt), for 2000–2022 period. *Authors’ own calculations from the data harvested from www.fao.org/faostat/en/#home.
Tables 4–8 present continent-specific GHG emissions from agricultural land and related operations. N2O emissions from soils and crop residues are highest in Africa, followed by Oceania, Asia, and the Americas, while the EU shows a declining trend. CH4 emissions from rice production and manure management are also highest in Africa, followed by Asia and the Americas, with almost none from Oceania and the EU. The EU shows no CH4 emissions from waste disposal, while other regions contribute modestly. For food processing and transport, the Americas, Oceania, and the EU are the most efficient; Asia is improving over time, and Africa remains the largest contributor of GHGs. Asia and the EU are the main sources of CH4 from food packaging, while the Americas, Oceania, and Africa show none. Asia is also the largest energy consumer and emitter linked to food operations, with other regions contributing little (Tables 4–8).
Table 4
GHG emissions from crops, agriculture, and other allied production sectors (kt) in Africa
| Year | Crop residue | Agricultural soils | Rice cultivation | Manure management | Waste disposal | Food transport | Food processing | Food packaging | Energy |
|---|---|---|---|---|---|---|---|---|---|
| N2O, kt | CH4, kt | ||||||||
| 1990 | 21.15 | 419.11 | 693.08 | 360.34 | 3871.44 | 2.5003 | 0.1452 | 2.63 | 15224.28 |
| 1995 | 22.75 | 453.16 | 825.64 | 391.90 | 4358.45 | 3.01 | 0.60 | 0.76 | 19625.54 |
| 2000 | 24.61 | 516.07 | 917.66 | 446.46 | 4681.77 | 3.43 | 0.46 | 0.78 | 21068.18 |
| 2005 | 31.49 | 590.93 | 1052.08 | 506.21 | 4962.02 | 4.05 | 0.51 | 1.44 | 20504.38 |
| 2010 | 35.46 | 683.43 | 1247.52 | 588.96 | 5265.30 | 5.46 | 0.54 | 2.46 | 19507.85 |
| 2015 | 39.61 | 767.97 | 1411.99 | 676.04 | 5522.51 | 7.04 | 1.01 | 1.80 | 19478.53 |
| 2020 | 44.11 | 877.55 | 1685.66 | 768.24 | 5776.45 | 7.53 | 1.36 | 2.34 | 18745.38 |
| 2022 | 45.24 | 885.63 | 1721.25 | 791.79 | 5824.57 | 7.96 | 1.51 | 1.83 | 18869.09 |
| % Change 1990–2022 | 113.90 | 111.31 | 148.35 | 119.73 | 50.45 | 218.36 | 940.01 | −30.38 | 23.94 |
Table 5
GHG emissions from crops, agriculture, and other allied production sectors (kt) in America
| Year | Crop residue | Agricultural soils | Rice cultivation | Manure management | Waste disposal | Food transport | Food processing | Food packaging | Energy |
|---|---|---|---|---|---|---|---|---|---|
| N2O, kt | CH4, kt | ||||||||
| 1990 | 97.94 | 981.66 | 1089.71 | 1950.65 | 7253.23 | 27.99 | 27.37 | 12.11 | 18712.61 |
| 1995 | 97.26 | 1034.58 | 1240.20 | 2003.76 | 7761.87 | 31.76 | 13.54 | 6.28 | 19329.71 |
| 2000 | 112.92 | 1066.09 | 1224.12 | 2016.72 | 8214.11 | 35.16 | 14.98 | 5.51 | 20714.35 |
| 2005 | 126.82 | 1170.39 | 1302.66 | 2126.25 | 8351.54 | 39.35 | 17.90 | 5.85 | 20867.07 |
| 2010 | 140.79 | 1224.84 | 1308.42 | 2161.98 | 9367.80 | 42.40 | 24.17 | 6.78 | 20961.2 |
| 2015 | 162.78 | 1271.21 | 1127.15 | 2231.45 | 9295.97 | 45.06 | 18.00 | 6.16 | 20953.59 |
| 2020 | 174.24 | 1379.09 | 1164.29 | 2374.39 | 9417.24 | 38.93 | 17.58 | 4.44 | 18461.67 |
| 2022 | 172.84 | 1395.16 | 1019.11 | 2372.56 | 9395.68 | 43.10 | 15.87 | 4.37 | 19230.33 |
| % Change 1990–2022 | 76.46 | 42.12 | −6.48 | 21.63 | 29.54 | 53.98 | −42.02 | −63.89 | 2.77 |
Table 6
GHG emissions from crops, agriculture, and other allied production sectors (kt) in Asia
| Year | Crop residue | Agricultural soils | Rice cultivation | Manure management | Waste disposal | Food transport | Food processing | Food packaging | Energy |
|---|---|---|---|---|---|---|---|---|---|
| N2O, kt | CH4, kt | ||||||||
| 1990 | 181.30 | 1333.94 | 19973.83 | 2756.69 | 16300.11 | 14.54 | 158.05 | 62.93 | 36265.77 |
| 1995 | 194.98 | 1590.90 | 20325.16 | 3194.67 | 18171.91 | 19.03 | 195.20 | 88.00 | 40801.57 |
| 2000 | 204.01 | 1644.59 | 20880.00 | 3299.90 | 19295.38 | 23.20 | 133.12 | 69.34 | 43188.99 |
| 2005 | 217.49 | 1818.59 | 20853.86 | 3532.77 | 20210.41 | 29.96 | 241.99 | 145.13 | 54476.02 |
| 2010 | 238.16 | 2009.19 | 21554.62 | 3833.76 | 21175.73 | 38.88 | 314.30 | 179.42 | 64115.12 |
| 2015 | 259.03 | 2107.46 | 21296.87 | 3990.49 | 21978.71 | 49.86 | 242.72 | 181.62 | 70228.74 |
| 2020 | 271.29 | 2197.22 | 21456.09 | 3925.43 | 22540.25 | 51.21 | 118.55 | 158.13 | 72923.66 |
| 2022 | 275.83 | 2174.70 | 21397.51 | 4055.13 | 22565.37 | 53.89 | 121.06 | 164.57 | 79611.33 |
| % Change 1990–2022 | 52.14 | 63.03 | 7.13 | 47.10 | 38.44 | 270.53 | -23.40 | 161.49 | 119.52 |
Table 7
GHG emissions from crops, agriculture, and other allied production sectors (kt) in Europe
| Year | Crop residue | Agricultural soils | Rice cultivation | Manure management | Waste disposal | Food transport | Food processing | Food packaging | Energy |
|---|---|---|---|---|---|---|---|---|---|
| N2O, kt | CH4, kt | ||||||||
| 1990 | 99.44 | 829.14 | 381.78 | 3904.12 | 4418.23 | 19.73 | 17.73 | 3.14 | 23787.26 |
| 1995 | 75.02 | 566.03 | 235.49 | 3111.10 | 4557.98 | 18.43 | 28.79 | 4.21 | 15735.68 |
| 2000 | 75.02 | 519.62 | 259.49 | 2797.01 | 5525.86 | 18.84 | 29.45 | 3.34 | 14094.74 |
| 2005 | 80.18 | 501.18 | 252.60 | 2626.59 | 5208.25 | 18.62 | 31.92 | 4.16 | 14925.06 |
| 2010 | 75.52 | 497.13 | 301.24 | 2554.72 | 4789.83 | 18.70 | 25.33 | 4.84 | 15087.47 |
| 2015 | 93.38 | 530.49 | 274.85 | 2547.75 | 4784.83 | 17.99 | 19.23 | 5.31 | 15201.98 |
| 2020 | 95.62 | 538.76 | 269.35 | 2507.65 | 4266.08 | 16.82 | 18.47 | 5.27 | 15865.19 |
| 2022 | 97.02 | 497.75 | 225.60 | 2412.27 | 4268.73 | 18.46 | 19.34 | 5.88 | 16139.85 |
| % Change 1990–2022 | −2.43 | −39.97 | −40.91 | −38.21 | −3.38 | −6.44 | 9.04 | 86.71 | −32.15 |
Table 8
GHG emissions from crops, agriculture and other allied production sectors (kt) in Oceania
| Year | Crop residue | Agricultural soils | Rice cultivation | Manure management | Waste disposal | Food transport | Food processing | Food packaging | Energy |
|---|---|---|---|---|---|---|---|---|---|
| N2O, kt | CH4, kt | ||||||||
| 1990 | 5.12 | 144.69 | 34.91 | 289.14 | 154.94 | 2.12 | 2.08 | 0.80 | 994.071 |
| 1995 | 3.71 | 137.20 | 41.91 | 301.90 | 188.58 | 2.36 | 2.14 | 0.76 | 1099.23 |
| 2000 | 7.40 | 146.63 | 43.06 | 316.81 | 198.97 | 2.60 | 2.38 | 0.89 | 1263.82 |
| 2005 | 7.49 | 144.46 | 17.38 | 328.05 | 211.13 | 2.65 | 2.30 | 0.71 | 1460.82 |
| 2010 | 7.39 | 130.85 | 6.73 | 316.84 | 218.54 | 2.62 | 2.53 | 0.91 | 1647.51 |
| 2015 | 7.98 | 139.12 | 22.70 | 330.21 | 221.46 | 2.61 | 1.75 | 0.38 | 1611.08 |
| 2020 | 6.01 | 135.58 | 2.36 | 305.79 | 228.68 | 2.16 | 1.65 | 0.41 | 1455.41 |
| 2022 | 11.42 | 145.50 | 20.62 | 311.90 | 229.48 | 2.06 | 1.50 | 0.41 | 1292.79 |
| % Change 1990–2022 | 122.83 | 0.55 | −40.94 | 7.87 | 48.11 | −2.81 | −27.49 | −48.61 | 30.05 |
4. Climate change and the impact of heat stress on livestock systems
The findings of numerous extensive research describe the negative impact of climate change and heat stress on livestock. Our understanding of the animal-stress relationship has grown, but in ruminants, the underlying mechanisms remain complex and only partly understood. Distributed globally, ruminant systems are exposed to widely varying weather and climatic conditions. When environmental temperature exceeds the thermoneutral zone, animals expend energy to maintain a stable core body temperature (Collier & Gebremedhin, 2015). The THI remains a useful and widely used tool for assessing heat stress severity: a THI of 68–72 is considered mild, 72–78 moderate, 78–89 extreme, and above 96 fatal (Zimbelman et al., 2009).
High environmental temperature, humidity, or high THI, combined with the animal’s own metabolic heat, gradually accumulates and activates heat-loss mechanisms such as conduction, convection, and radiation. When these are no longer sufficient, animals switch to evaporative cooling, sweating, panting, and gular flutter (Collier et al., 2018; Wankar et al., 2019). While evaporative cooling lowers core body temperature, it is energetically costly and reduces the energy available for growth and production. Native breeds show superior physiological and genetic adaptation compared to crossbreeds and cope with heat stress relatively well, although production still declines (Wankar et al., 2024). Because of higher metabolic heat generation, high-yielding, crossbred, and purebred dairy cattle are affected more severely by heat stress than beef cattle, low-to-average yielders, sheep, goats, and native swine and poultry (Ammer et al., 2018; Lees et al., 2019).
Under acute or chronic heat stress, animals immediately reduce feed intake to limit metabolic heat generation, shifting their energy balance. This reduction is especially pronounced in ruminants, since ruminal fermentation is a major source of metabolic heat and accounts for 7–15% of gross energy loss (Eugène et al., 2008). Lower feed intake further depletes energy reserves, pushing animals into a negative energy balance and reducing production (Bernabucci et al., 2010; Marchesini et al., 2018). Meanwhile, water intake increases, as most livestock rely on evaporative cooling, which entails spending more water. Higher water intake alongside lower feed intake is therefore the classic sign of acute or chronic heat stress. This reduced intake, combined with poorer digestibility and nutrient utilisation (West, 1999), is the main driver of falling milk, meat, and egg production.
Behavioural changes such as standing rather than lying, seeking shade, reduced activity, lying in the shade, isolating from the group, and irritability are also common. Physiological indices shift quickly as well: respiration rate rises, and circulatory adjustments redirect blood flow to the skin to support evaporative cooling. These changes are mediated by the nervous, enzymatic, and endocrine systems (Charmandari et al., 2005; Vaidya et al., 2026). Catecholamines and cortisol, which are key stress-adaptation hormones, rise initially before declining, whereas thyroid hormones decrease, causing a reduction in metabolic heat production. Furthermore, lipids, non-esterified fatty acids, and triglycerides are mobilised as alternative energy substrates. Both acute and sustained heat stress also trigger a broad cellular response involving heat shock proteins (HSPs) and antioxidant activation to scavenge free radicals (Lallawmkimi et al., 2013; Yatoo et al., 2014). Taken together, these behavioural, physiological, metabolic, endocrine, and molecular changes help animals survive stressful periods by channelling energy towards homeostasis and homeothermy, but at the cost of significant production losses (Collier & Gebremedhin, 2015; Collier et al., 2018).
5. Nutritional approaches for ameliorating heat stress and GHG emissions
Many strategies can reduce the impact of heat stress on livestock or curb anthropogenic gas emissions, although not all are feasible in the long term, widely applicable, or economically viable. Popular approaches include introducing thermotolerant native or crossbred animals, modifying shelters to improve the micro- and/or macro-environment, building environmentally controlled (EC) sheds, and adjusting feeding and grazing schedules. The use of artificial intelligence (AI) and machine learning to monitor animal welfare, stress, production, health, and GHG emissions is also gaining traction, particularly in developed countries (Ciliberti et al., 2025). Which strategies work best depends on the region, national economy, climate, herd size, and production purpose; EC sheds are common in poultry but remain costly for cattle and are used mainly in highly developed nations and intensive farming systems, whereas AI is easier to implement in broiler management than in grazing livestock systems.
Feed accounts for roughly 60–70% of total production costs, and animal growth and performance depend directly on nutrient quality and utilisation. The inclusion of local plant matter and alternative feeds is known to improve performance and production, and some of these ingredients may directly or indirectly reduce heat stress and GHG emissions. The quality of micronutrients, macronutrients, and other bioactive components drives performance by supporting immune function, altering ruminal fermentation patterns, and enabling better use of energy for production (Islam et al., 2021). The following sections outline nutritional interventions for reducing heat stress and GHG emissions, focusing specifically on ruminants.
6. Addition of supplements and modification of fermentation pathways: the direct approach
6.1. Dietary fibre
Ruminal fermentation of dietary fibre generates substantial heat that must be dissipated. In animals exposed to high temperatures or high THI values, reducing structural fibre – cellulose, hemicellulose, and lignin – from about 18% to 12% of dry matter and replacing it with concentrates helps lower ruminal heat production (West, 1999; Baumgard & Rhoads, 2012; Conte et al., 2018). The inclusion of concentrates at 35% or 60% of the diet has been shown to reduce CH4 production and ruminal heat generation (Aguerre et al., 2011; Mikuła et al., 2022; Xie et al., 2025), and reduced feed intake also lowers fermentation heat (Kamal et al., 2018; Becker et al., 2020).
Fibre cannot be eliminated entirely, since it remains the primary energy source for ruminants; it should therefore stay below 18–19% even under high environmental temperatures (Atrian & Shahryar, 2012). Where available, fresh legumes and high-quality forage, along with reduced acid detergent fibre and/or neutral detergent fibre, can meaningfully shift microbial fermentation and lower heat production (Vlaming et al., 2008; Kulkarni et al., 2021; Jago et al., 2023). Harvesting forage at an earlier growth stage, when structural fibre content is lower, is another way to improve palatability, boost digestibility, and reduce both metabolic heat and gaseous emissions during heat stress (Beauchemin et al., 2008; Pragna et al., 2018).
6.2. Dietary fats and oils
Fat makes up only a small share of typical ruminant diets, coming mainly from concentrates or targeted supplementation. In moderate amounts, added fat helps alleviate heat stress; 3–5% dietary fat has been shown to reduce metabolic heat production (Arndt et al., 2022), provided fibre levels are reduced correspondingly (Oke et al., 2021). Rumen-undegradable fats and oils are generally more beneficial than degradable ones, since they bypass the rumen without disrupting the microbial community while still supplying energy (Zhang et al., 2021). This helps maintain milk yield, since thermoregulatory maintenance requirements can rise by 25–30% in dairy animals under heat stress (NRC: National Research Council, 2007; Collier et al., 2018). Various fatty oils have also been shown to lower methanogenic activity, heat increment, and CO2/CH4 output while conserving energy in sheep, goats, dairy cattle, and beef cattle (Grainger et al., 2008; Grainger & Beauchemin, 2011; Beauchemin et al., 2009; Mavrommatis et al., 2021).
6.3. Dietary protein
Adequate protein, mostly from concentrates, is essential for growth and production, but protein metabolism generates additional heat, so high protein levels are not advisable during heat stress. In ruminants, protein is broken down into amino acids and ultimately ammonia during fermentation, making excess high-quality protein wasteful (Huber et al., 1994). Rumen-undegradable protein is preferable, since it is digested gradually in the abomasum and used more efficiently (Conte et al., 2018). Alternative low-cost protein sources such as nitrates and urea can also replace some dietary protein while helping reduce CH4 emissions and heat generation when fed in moderate amounts (Lee & Beauchemin, 2014).
6.4. Bioactive plant compounds and essential oils
These compounds act on the fermentation process and ruminal microflora to reduce metabolic heat (Patra, 2012), mainly by activating or suppressing specific microbial groups or metabolites, which lowers CO2 and CH4 output (Iqbal et al., 2008; Toprak, 2015). Key plant metabolites that reduce methanogenesis include tannins, saponins, flavonoids, and other terpenoids (Tiemann et al., 2008; Sahebi Ala et al., 2021). Several studies report CH4 reductions by up to 28–50% following supplementation with these bioactive compounds (Grainger et al., 2009; Kataria, 2015; Alves et al., 2017); however, at higher doses, they can disrupt fermentation, reduce nutrient availability, or become toxic (Hristov et al., 2013).
Plant oils similarly show potent anti-methanogenic activity, altering microbial fermentation and ruminal heat generation. Garlic, clove, peppermint, eucalyptus, and origanum oils have all demonstrated anti-methanogenic effects at appropriate doses (Patra, 2012). A detailed assessment of plant compounds and essential oils that reduce CH4 and CO2 production is beyond the scope of this review but is available in Kumar et al. (2023).
6.5. Yeast, seaweed, and other microorganisms
These additives stabilise ruminal pH and modulate the microflora, providing benefits during heat stress. Yeast supplementation reduces oxidative stress, supports cellular homeothermy, and improves nutrient digestibility (Smith et al., 1997; Abdelbagi et al., 2021). Yeast at 120 or 240 g/day/animal has also been shown to lower core body temperature directly, improving thermoregulatory balance and optimising milk production in dairy cattle (Zhu et al., 2016). Chelated mineral-enriched yeast is similarly gaining popularity for its higher bioavailability and rapid antioxidative effect in heat-stressed animals (Bao et al., 2007). Yeast supplementation also reduces CH4 production directly, confirming its anti-methanogenic properties in ruminants (Newbold & Rode, 2006; Lobo & Faciola, 2021). Various seaweeds show similar anti-methanogenic effects: red, brown, and green seaweed supplementation has reduced CH4 production by up to 50–80% in dairy and beef cattle while improving production efficiency (Li et al., 2016; Abbott et al., 2020; Roque et al., 2021; Meo-Filho et al., 2024; Ahmad et al., 2025).
Microorganisms such as propionic acid bacteria and acetogens compete with protozoa and methanogenic species, including Methanobrevibacter ruminantium, Methanobrevibacter millerae, and Methanobacterium formicicum, for metabolic substrates and energy, acting as hydrogen acceptors that favour propionate production (Stein et al., 2006; Ungerfeld, 2015). Propionibacterium shifts the molar proportions of VFAs towards propionate, an anti-methanogenic VFA and important energy substrate in ruminants (Lehloenya et al., 2008; Vyas et al., 2014; Chen et al., 2020). Acetogens likewise act as alternative hydrogen and CO2 sinks, making less CO2 available for methanogens (Fonty et al., 2007).
6.6. Electrolytes and minerals
Heat stress alters general metabolism and acid–base balance, affecting essential cellular functions. Evaporative cooling through sweating and panting significantly depletes body electrolytes, leading to metabolic alkalosis or acidosis (Wijffels et al., 2013). Potassium is the electrolyte lost in the largest amounts during hyperthermia, alongside smaller amounts of sodium and magnesium. Alkaline diets high in potassium and sodium help reduce heat stress directly and maintain acid–base balance and water balance (Singh et al., 2021).
Many minerals support normal enzyme, protein, and immune function, helping ameliorate heat stress at the cellular level. Zinc, copper, chromium, and selenium are among the most important and should be supplemented accordingly (Soltan, 2010; Manimaran et al., 2024); zinc (Sheikh et al., 2015; Manimaran et al., 2024), selenium (Chauhan et al., 2012), and chromium (AL-Saiady et al., 2004) are all known to improve antioxidant status and immune function in heat-stressed animals.
Chelated or nano-mineral forms are absorbed and utilised more effectively than inorganic forms (Feng et al., 2009; Wang et al., 2010). Their small size allows rapid distribution within cells, making them more effective at reducing oxidative stress (Rosi & Mirkin, 2005), alongside benefits for immunity, feed efficiency, growth performance, and antibacterial activity (Yang & Sun, 2006; Rajendran et al., 2013).
6.7. Antioxidants
Heat stress disrupts cellular homeostasis and increases free radical production, raising oxidative stress and damaging cellular components (Liu et al., 2016). A range of enzymes, proteins, minerals, and vitamins – including superoxide dismutase, glutathione peroxidase, catalase, albumin, l-cysteine, homocysteine, melatonin, protein sulfhydryl groups, ascorbic acid, Glutathione (GSH), uric acid, α-tocopherol, β-carotene, pyruvate, and retinol – continuously neutralise free radicals and reduce cellular hyperthermia (Brewer, 2011). Superoxide dismutase, glutathione peroxidase, and catalase are considered the most potent, with higher activity recorded during heat stress in livestock (Yatoo et al., 2014). Supplementing these antioxidants through feed reduces free radical damage as well as lipid peroxidation, preserving cell membrane integrity and function (Kumar et al., 2010; Dunshea et al., 2019; Al-Sultan et al., 2019).
6.8. Betaine and gamma-aminobutyric acid
Betaine, a naturally occurring derivative of glycine, has potent antioxidative, anti-stress, and osmoprotectant effects (Mishra et al., 2020). Supplementing 15 g/day/head reduces heat stress in dairy cows by lowering metabolic heat generation (Loxton et al., 2007), improving gut function, lowering emissions, and increasing nutrient utilisation (Matthews & Southern, 2000). In meat animals, betaine supplementation increases feed intake and growth rate even during heat stress (Cronje, 2005; DiGiacomo et al., 2012), partly by dampening the HSP-driven stress cascade activated during hyperthermia (Sheikh-Hamad et al., 1994).
Betaine and gamma-aminobutyric acid (GABA) is a neurotransmitter that acts on the central nervous system, modulating hypothalamic pathways involved in temperature regulation, thereby reducing metabolic heat generation and core body temperature (DiMicco & Zaretsky, 2007). Supplementing GABA at 40 mg/kg/animal improves feed efficiency, lowers body temperature, and increases milk production in heat-stressed dairy cows (Cheng et al., 2014). These results are promising, but further research is still needed before GABA can be established as a routine anti-heat-stress supplement. Figure 9 summarises the most effective nutritional approaches for reducing GHG production and heat stress in ruminants.
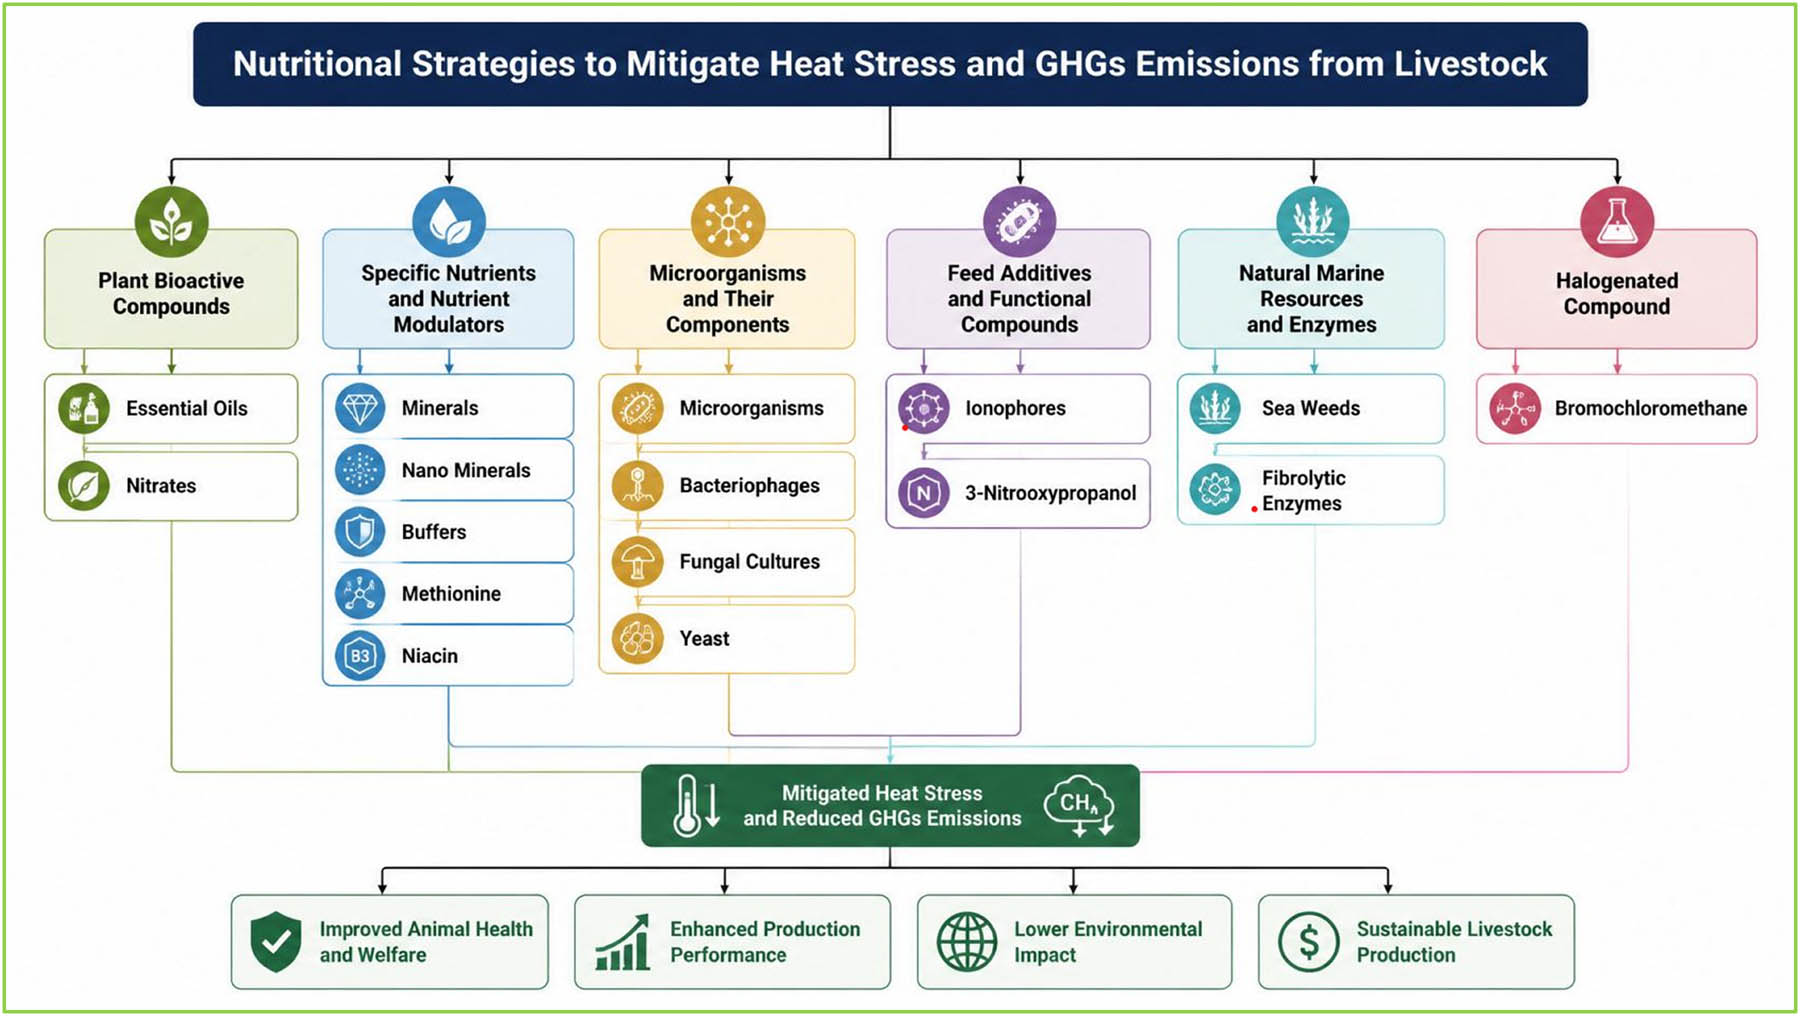
Figure 9
Heat stress, greenhouse gas emissions and some nutritional interventions in ruminants.
7. Other strategies to reduce dung and farm GHG emissions: The supportive approach
Dung management is another major farm operation, and storage conditions, duration, method, ambient temperature, and processing all influence emissions (Hermansen & Kristensen, 2011; Dağlıoğlu et al., 2024). Proper processing and disposal of manure can significantly reduce its carbon footprint (Chadwick et al., 2011; Lou et al., 2024; Zanon et al., 2025); India alone contributes an estimated 120.44 thousand tonnes of CO2 and 0.08 thousand tonnes of N2O from manure each year (Sharma et al., 2011), illustrating the scale of emissions globally. Several effective strategies for reducing the carbon footprint of dung and waste are discussed below.
7.1. Storage, covering, and cooling of dung and waste
Prolonged storage of dung under high temperatures increases GHG emissions by creating favourable anaerobic conditions (Dağlıoğlu et al., 2024); thus, dung should be removed frequently and stored away from animal housing. Covering liquid manure is more effective at reducing CH4 and N2O emissions than open storage, since it also limits odour and preserves aerobic conditions that slow microbial fermentation (Guarino et al., 2006; Petersen et al., 2013). Spreading manure across soil or pasture, ideally as slurry rather than solid waste, is another effective strategy (Chianese et al., 2009); however, leftover forage should not be left covering stored slurry, since it adds fermentable substrate and increases emissions (Amon et al., 2006). Cooling manure below 15°C is a simple, effective way to cut CH4 and N2O emissions and is now common practice in advanced, intensive dairy farms (Rennie et al., 2018).
7.2. Anaerobic digestion and composting of dung and organic waste
Converting organic waste into biogas is one of the most effective, eco-friendly ways to cut GHG emissions (Aguirre-Villegas & Larson, 2017). Large dairy operations generate substantial organic biomass and manure that can power the same farm cleanly (Da Costa Gomez, 2013; Bhatia, 2015); biogas systems require minimal space and resources, are cost-effective, and provide sustainable clean energy (Teng et al., 2014). Composting manure and waste in pits or ditches, whether solid or liquid, is another practical way to reduce emissions (Pattey et al., 2005; Zhang et al., 2024), while also converting organic waste into nutrient-rich biomass usable as fertiliser, improving farm sanitation and pathogen control, and further reducing CH4 and N2O emissions (Hoeksma et al., 2012). Together, biomass and biogas production reduce emissions while returning carbon to the soil–plant–animal cycle more sustainably.
7.3. Organic farming and soil conservation
Chemical-free crop and livestock production is regaining popularity, particularly in developed nations, yielding more nutrient-dense products free of pesticide, hormone, and antibiotic residues (Reganold & Wachter, 2016; Jumoke et al., 2024). These systems repeatedly recycle nutrients within the farm, reducing both GHG emissions and environmental impact (Reganold & Wachter, 2016).
Carbon trapping and conversion of organic biomass can meaningfully improve soil quality and nutrient availability for plants and animals alike (Lal, 2015; Statistics, 2020). Higher soil erosion and extensive chemical fertiliser use are both linked to greater GHG emissions (Teague et al., 2013), and agricultural land has reportedly lost more than 70% of its original carbon mass, deepening global reliance on chemical inputs for production (Delgado et al., 2011). Practices such as leaving residual plant matter and manure on the soil, avoiding tillage, and controlling fertiliser use all improve soil organic matter, supporting crop and fodder growth while reducing the sector’s carbon footprint (Pimentel et al., 2005; Batjes, 2014; Wang et al., 2023).
7.4. Mixed agroecosystems
Raising crops, fodder, and livestock together in semi-extensive or pasture-based systems can significantly improve soil health, animal welfare, production, and waste management while reducing the overall carbon footprint (Delgado et al., 2011). Mixed ecosystems have existed for generations and remain central to many cultures, economies, and agri-food systems, offering a natural way to curb GHG emissions (Teague et al., 2013; Ripple et al., 2014). Rotational grazing further improves soil organic matter and microbial diversity, supporting carbon sequestration and CH4 oxidation in the soil (Bardgett & McAlister, 1999; Jamali et al., 2014).
8. Conclusion
Producing more food efficiently is the central challenge of the climate change era. As demand for animal products continues to rise, the livestock sector must find practical ways to offset the impact of heat stress while scaling up production sustainably. Among the available interventions, nutritional management stands out as the most feasible and immediately actionable route to protecting animal welfare and production. Adjusting feed composition and adding targeted micronutrients, feed additives, plant or synthetic compounds, and prebiotics and probiotics can measurably improve digestion, metabolism, and nutrient use while directly alleviating both heat stress and GHG output in ruminants. Precise, well-targeted nutritional strategies therefore offer a realistic path to reducing anthropogenic emissions and heat stress simultaneously. This review also highlights a persistent gap between developed and developing economies in both production efficiency and emissions performance across the agri-livestock sector as well as other sectors. Closing that gap will require more than better animal nutrition; every sector, not just livestock, must optimise production and commit to enforceable climate policy if a genuinely carbon-neutral future is to be achieved.
8.1. Data analysis
All the data were freely available at www.fao.org/faostat/en/#home. The raw data were harvested in January 2026, curated, and analysed. Microsoft Excel was used to calculate the changes in all parameters under study, and the formula is as follows:
% Change = .
In all tables and figures, the same formula is used to evaluate the % change on a timescale.
Acknowledgments
The authors express sincere acknowledgements to all online platforms and international agencies, which made the data available.
Funding information
Authors state no funding involved.
Authors contributions
All authors accept the responsibility for the entire content of the manuscript and consented to its submission to the journal and approve the final form of the manuscript. A.K.W., and N.E.G. conceptualised and drafted the original manuscript. T.A.S., and M.M.V. performed the statistical analysis and data interpretation. P.M.K., and S.A.D. developed and analysed the figures and tables. A.K.W., and N.E.G. revised and finalized the manuscript. A.K.W. submitted and handled all the revisions till the final accepted form of the manuscript on all authors behalf.
Conflict of interest statement
The authors declare no potential conflict of interest.