
Table 1
Water parameters (mean value ± SD) in the control and experimental groups
| Parameter | Control | A1 | A2 | A3 |
|---|---|---|---|---|
| Temp. (°C) | 20.63 ± 0.17 | 20.53 ± 0.15 | 20.61 ± 0.10 | 20.65 ± 0.17 |
| O2 (mg/l) | 6.91 ± 0.67 | 6.83 ± 0.51 | 6.74 ± 0.49 | 6.89 ± 0.60 |
| pH | 7.22 ± 0.09 | 7.08 ± 0.14 | 7.11 ± 0.13 | 7.14 ± 0.12 |
| NH3 (mg/l) | 0.01 ± 0.00 | 0.01 ± 0.00 | 0.01 ± 0.00 | 0.01 ± 0.00 |
| NO2 − (mg/l) | 0.12 ± 0.14 | 0.14 ± 0.31 | 0.23 ± 0.38 | 0.27 ± 0.41 |
| NO3 − (mg/l) | 4.86 ± 2.57 | 4.86 ± 3.23 | 5.36 ± 3.32 | 4.71 ± 2.79 |
| GH (dGH) | 4.14 ± 0.36 | 4.21 ± 0.43 | 4.43 ± 0.65 | 4.14 ± 0.36 |
| KH (dKH) | 3.00 ± 0.00 | 3.00 ± 0.00 | 3.00 ± 0.00 | 3.00 ± 0.00 |
GH – general hardness; KH – carbonate hardness.
Table 2
Haematological parameters after 7 days of exposure to ACS AQUAQULTURE preparations (mean value ± SD)
| Parameter | Control | A1 | A2 | A3 |
|---|---|---|---|---|
| RBC (106/µL) | 1.36 ± 0.16 | 1.21 ± 0.30 | 1.21 ± 0.19 | 1.24 ± 0.11 |
| Ht (%) | 25.28 ± 2.26 | 25.45 ± 2.05 | 26.68 ± 2.11 | 25.43 ± 4.18 |
| Hb (g/dl) | 6.59 ± 0.49 | 6.75 ± 0.58 | 6.96 ± 0.51 | 6.83 ± 1.12 |
| MCV (fl) | 188.83 ± 30.47 | 219.58 ± 44.71 | 225.55 ± 40.01 | 205.99 ± 29.54 |
| MCH (pg) | 49.04 ± 5.50 | 58.32 ± 12.40 | 59.07 ± 12.28 | 55.34 ± 7.88 |
| MCHC (g/dl) | 26.14 ± 1.39 | 26.53 ± 0.72 | 26.13 ± 1.49 | 26.91 ± 1.73 |
| WBC (103/µL) | 24.10 ± 3.92 | 27.05 ± 4.87 | 23.98 ± 3.21 | 23.23 ± 2.70 |
No statistically significant differences occurred.
RBC – red blood cell count; Ht – haematocrit value; Hb – haemoglobin concentration; MCV – mean corpuscular volume; MCH – mean corpuscular haemoglobin; MCHC – mean corpuscular haemoglobin concentration; WBC – white blood cell count.
Table 3
Haematological parameters after 14 days of exposure to ACS AQUAQULTURE preparations (mean value ± SD)
| Parameter | Control | A1 | A2 | A3 |
|---|---|---|---|---|
| RBC (106/µL) | 1.39 ± 0.18 | 1.31 ± 0.22 | 1.47 ± 0.27 | 1.44 ± 0.26 |
| Ht (%) | 25.00 ± 2.90 | 25.75 ± 1.95 | 25.18 ± 1.64 | 24.75 ± 1.98 |
| Hb (g/dl) | 7.00 ± 1.06 | 7.02 ± 0.52 | 6.55 ± 0.39 | 6.65 ± 0.48 |
| MCV (fl) | 181.58 ± 26.64 | 202.24 ± 39.06 | 175.94 ± 33.13 | 177.83 ± 39.37 |
| MCH (pg) | 50.91 ± 9.50 | 55.40 ± 12.42 | 45.77 ± 8.62 | 48.08 ± 11.83 |
| MCHC (g/dl) | 27.92 ± 1.49A | 27.32 ± 1.56AB | 26.04 ± 1.13B | 26.92 ± 1.08AB |
| WBC (103/µL) | 23.48 ± 5.96 | 23.15 ± 4.25 | 24.13 ± 2.92 | 24.33 ± 5.26 |
Different letters in a row indicate that the corresponding values are statistically significantly different (p adj < 0.05).
RBC – red blood cell count; Ht – haematocrit value; Hb – haemoglobin concentration; MCV – mean corpuscular volume; MCH – mean corpuscular haemoglobin; MCHC – mean corpuscular haemoglobin concentration; WBC – white blood cell count.
Table 4
Haematopoietic parameters in common carp (Cyprinus carpio) after 7 days of exposure to ACS AQUAQULTURE preparations (mean value ± SD)
| Parameter | Control | A1 | A2 | A3 |
|---|---|---|---|---|
| Early blast cells (%) | 6.72 ± 1.23 | 6.40 ± 1.65 | 6.08 ± 2.55 | 6.68 ± 1.52 |
| Neutrophilic cells (%) | 14.30 ± 2.87 | 13.80 ± 3.29 | 14.72 ± 2.88 | 13.66 ± 2.79 |
| Neutrophilic myelocytes (%) | 5.28 ± 2.48 | 5.06 ± 1.73 | 6.12 ± 3.71 | 4.52 ± 2.10 |
| Neutrophilic metamyelocytes (%) | 4.56 ± 3.87 | 4.34 ± 2.90 | 4.42 ± 1.80 | 4.62 ± 2.63 |
| Band neutrophils (%) | 2.24 ± 1.68 | 2.14 ± 1.03 | 1.98 ± 0.97 | 2.24 ± 1.23 |
| Segmented neutrophils (%) | 2.22 ± 1.07 | 2.26 ± 1.01 | 2.20 ± 1.51 | 2.28 ± 1.05 |
| Monocytoid cells (%) | 1.26 ± 0.68 | 1.38 ± 0.24 | 1.16 ± 0.51 | 1.30 ± 0.34 |
| Promonocytes (%) | 0.54 ± 0.40 | 0.64 ± 0.51 | 0.66 ± 0.46 | 0.66 ± 0.43 |
| Monocytes (%) | 0.72 ± 0.59 | 0.74 ± 0.37 | 0.50 ± 0.38 | 0.64 ± 0.35 |
| Lymphoid cells (%) | 62.14 ± 5.06 | 62.68 ± 4.61 | 61.10 ± 5.27 | 62.20 ± 4.32 |
| Prolymphocytes (%) | 2.16 ± 2.59 | 2.40 ± 1.01 | 1.98 ± 1.01 | 3.16 ± 2.99 |
| Lymphocytes (%) | 58.90 ± 7.62 | 59.18 ± 4.43 | 58.10 ± 4.90 | 57.56 ± 6.73 |
| Proplasmocytes (%) | 0.38 ± 0.45 | 0.46 ± 0.41 | 0.52 ± 0.45 | 0.76 ± 0.47 |
| Plasmocytes (%) | 0.70 ± 0.54 | 0.64 ± 0.46 | 0.50 ± 0.44 | 0.72 ± 0.29 |
| Erythroid cells (%) | 5.86 ± 0.87 | 5.68 ± 1.24 | 5.82 ± 1.83 | 5.08 ± 1.39 |
| Basophilic erythroblasts (%) | 0.80 ± 0.66 | 1.04 ± 1.05 | 1.12 ± 0.73 | 1.08 ± 0.84 |
| Polychromatophilic erythroblasts (%) | 1.08 ± 0.59 | 0.80 ± 0.66 | 1.18 ± 0.82 | 0.70 ± 0.40 |
| Orthochromatic erythroblasts (%) | 0.96 ± 0.59 | 0.36 ± 0.37 | 0.86 ± 0.68 | 0.64 ± 0.62 |
| Erythrocytes (%) | 1.52 ± 0.88 | 2.04 ± 1.71 | 1.32 ± 0.71 | 1.40 ± 0.52 |
| Juvenile erythrocytes (%) | 1.50 ± 0.71 | 1.44 ± 0.84 | 1.34 ± 0.74 | 1.26 ± 0.67 |
| Basophilic cells (%) | 3.68 ± 1.18 | 4.58 ± 1.04 | 4.14 ± 2.05 | 5.00 ± 1.52 |
| Basophilic progranulocytes (%) | 0.94 ± 0.65 | 1.08 ± 0.83 | 1.20 ± 1.15 | 1.38 ± 0.99 |
| Basophilic metagranulocytes (%) | 0.78 ± 0.82 | 1.26 ± 0.85 | 0.94 ± 1.03 | 1.62 ± 0.77 |
| Juvenile basophils (%) | 0.94 ± 0.53 | 1.34 ± 1.02 | 1.14 ± 0.93 | 0.74 ± 0.57 |
| Basophils (%) | 1.02 ± 0.53 | 0.90 ± 0.52 | 0.86 ± 0.50 | 1.26 ± 0.27 |
| Eosinophils (%) | 0.22 ± 0.24 | 0.08 ± 0.14 | 0.08 ± 0.10 | 0.14 ± 0.13 |
| Thrombocytes (%) | 3.94 ± 2.18 | 3.44 ± 1.81 | 4.48 ± 1.42 | 3.68 ± 1.87 |
| Unclassified (%) | 1.88 ± 0.94 | 1.96 ± 1.22 | 2.42 ± 1.53 | 2.26 ± 1.15 |
No statistically significant differences occurred.
Table 5
Haematopoietic parameters in common carp (Cyprinus carpio) after 14 days of exposure to ACS AQUAQULTURE preparations (mean value ± SD)
| Parameter | Control | A1 | A2 | A3 |
|---|---|---|---|---|
| Early blast cells (%) | 6.28 ± 1.46 | 5.74 ± 1.62 | 5.98 ± 1.53 | 6.04 ± 1.48 |
| Neutrophilic cells (%) | 15.62 ± 3.17 | 13.88 ± 2.74 | 13.78 ± 2.86 | 14.88 ± 3.54 |
| Neutrophilic myelocytes (%) | 5.26 ± 2.82 | 4.70 ± 1.75 | 5.92 ± 3.12 | 4.74 ± 2.17 |
| Neutrophilic metamyelocytes (%) | 5.96 ± 2.97 | 4.98 ± 2.77 | 3.84 ± 2.48 | 4.66 ± 2.13 |
| Band neutrophils (%) | 2.18 ± 0.75 | 2.12 ± 0.85 | 2.44 ± 1.29 | 2.76 ± 0.88 |
| Segmented neutrophils (%) | 2.22 ± 1.14 | 2.08 ± 0.97 | 1.58 ± 0.77 | 2.72 ± 1.13 |
| Monocytoid cells (%) | 1.50 ± 0.43 | 1.02 ± 0.49 | 1.08 ± 0.27 | 1.20 ± 0.25 |
| Promonocytes (%) | 0.74 ± 0.54 | 0.58 ± 0.36 | 0.46 ± 0.45 | 0.54 ± 0.35 |
| Monocytes (%) | 0.76 ± 0.39 | 0.44 ± 0.23 | 0.62 ± 0.38 | 0.66 ± 0.37 |
| Lymphoid cells (%) | 60.44 ± 3.60 | 63.44 ± 4.83 | 64.58 ± 4.58 | 62.04 ± 5.03 |
| Prolymphocytes (%) | 2.40 ± 1.00 | 1.98 ± 1.88 | 1.64 ± 1.15 | 2.08 ± 1.77 |
| Lymphocytes (%) | 56.94 ± 4.06 | 59.88 ± 4.24 | 61.36 ± 4.33 | 58.48 ± 4.12 |
| Proplasmocytes (%) | 0.48 ± 0.47 | 0.86 ± 0.66 | 0.98 ± 0.77 | 0.86 ± 0.57 |
| Plasmocytes (%) | 0.62 ± 0.57 | 0.72 ± 0.38 | 0.60 ± 0.34 | 0.62 ± 0.38 |
| Erythroid cells (%) | 5.02 ± 1.04 | 5.58 ± 1.05 | 5.02 ± 1.60 | 5.38 ± 1.70 |
| Basophilic erythroblasts (%) | 1.00 ± 0.57 | 0.66 ± 0.63 | 0.52 ± 0.51 | 0.68 ± 0.52 |
| Polychromatophilic erythroblasts (%) | 0.76 ± 0.74 | 0.76 ± 0.84 | 0.82 ± 0.61 | 0.70 ± 0.58 |
| Orthochromatic erythroblasts (%) | 0.52 ± 0.43 | 0.78 ± 0.63 | 0.92 ± 0.66 | 0.88 ± 0.62 |
| Erythrocytes (%) | 1.62 ± 0.79 | 1.68 ± 0.69 | 1.50 ± 0.85 | 1.58 ± 0.92 |
| Juvenile erythrocytes (%) | 1.12 ± 0.81 | 1.70 ± 0.74 | 1.26 ± 0.85 | 1.54 ± 0.85 |
| Basophilic cells (%) | 5.26 ± 2.41 | 4.18 ± 1.41 | 4.54 ± 1.85 | 5.00 ± 2.23 |
| Basophilic progranulocytes (%) | 1.68 ± 1.26 | 0.92 ± 0.65 | 1.34 ± 1.31 | 1.38 ± 1.11 |
| Basophilic metagranulocytes (%) | 1.32 ± 1.23 | 1.24 ± 0.84 | 1.24 ± 1.04 | 1.40 ± 1.02 |
| Juvenile basophils (%) | 1.10 ± 0.58 | 1.06 ± 1.24 | 0.92 ± 0.76 | 1.08 ± 0.75 |
| Basophils (%) | 1.16 ± 0.35 | 0.96 ± 0.62 | 1.04 ± 0.79 | 1.14 ± 0.77 |
| Eosinophils (%) | 0.10 ± 0.11 | 0.10 ± 0.14 | 0.08 ± 0.14 | 0.12 ± 0.17 |
| Thrombocytes (%) | 3.94 ± 1.86 | 3.56 ± 1.53 | 2.76 ± 1.39 | 2.76 ± 1.51 |
| Unclassified (%) | 1.84 ± 1.28 | 2.50 ± 1.85 | 2.18 ± 0.99 | 2.58 ± 2.20 |
No statistically significant differences occurred.
Table 6
Plasma biochemical parameters after 7 days of exposure to ACS AQUAQULTURE preparations (mean value ± SD)
| Parameter | Control | A1 | A2 | A3 |
|---|---|---|---|---|
| Glu (mmol/l) | 4.41 ± 1.03 | 4.25 ± 1.21 | 4.90 ± 1.31 | 4.95 ± 1.38 |
| TP (g/l) | 22.53 ± 1.51 | 23.63 ± 2.35 | 21.24 ± 2.86 | 21.79 ± 3.22 |
| Tg (mmol/l) | 1.74 ± 0.25 | 1.65 ± 0.23 | 1.64 ± 0.17 | 1.55 ± 0.21 |
| AST (U/l) | 114.42 ± 31.16 | 138.52 ± 59.80 | 162.55 ± 55.70 | 149.96 ± 54.83 |
| ALP (U/l) | 127.00 ± 52.51 | 134.80 ± 70.53 | 132.50 ± 69.23 | 122.90 ± 57.85 |
No statistically significant differences occurred.
Glu – glucose; TP – total protein; Tg – triglycerides; AST – aspartate aminotransferase; ALP – alkaline phosphatase.
Table 7
Plasma biochemical parameters after 14 days of exposure to ACS AQUAQULTURE preparations (mean value ± SD)
| Parameter | Control | A1 | A2 | A3 |
|---|---|---|---|---|
| Glu (mmol/l) | 4.74 ± 0.83 | 3.63 ± 0.84 | 4.43 ± 0.74 | 3.89 ± 0.77 |
| TP (g/l) | 22.48 ± 2.36 AB | 22.81 ± 1.97 A | 20.45 ± 3.15 AB | 20.01 ± 2.09 B |
| Tg (mmol/l) | 1.68 ± 0.30 | 1.63 ± 0.20 | 1.51 ± 0.26 | 1.45 ± 0.34 |
| AST (U/l) | 115.49 ± 30.35 | 109.15 ± 24.98 | 93.13 ± 11.15 | 103.07 ± 21.92 |
| ALP (U/l) | 160.50 ± 28.91 | 150.50 ± 99.80 | 140.70 ± 92.47 | 195.30 ± 99.08 |
Different letters in a row indicate that the corresponding values are statistically significantly different (p adj < 0.05).
Glu – glucose; TP – total protein; Tg – triglycerides; AST – aspartate aminotransferase; ALP – alkaline phosphatase.
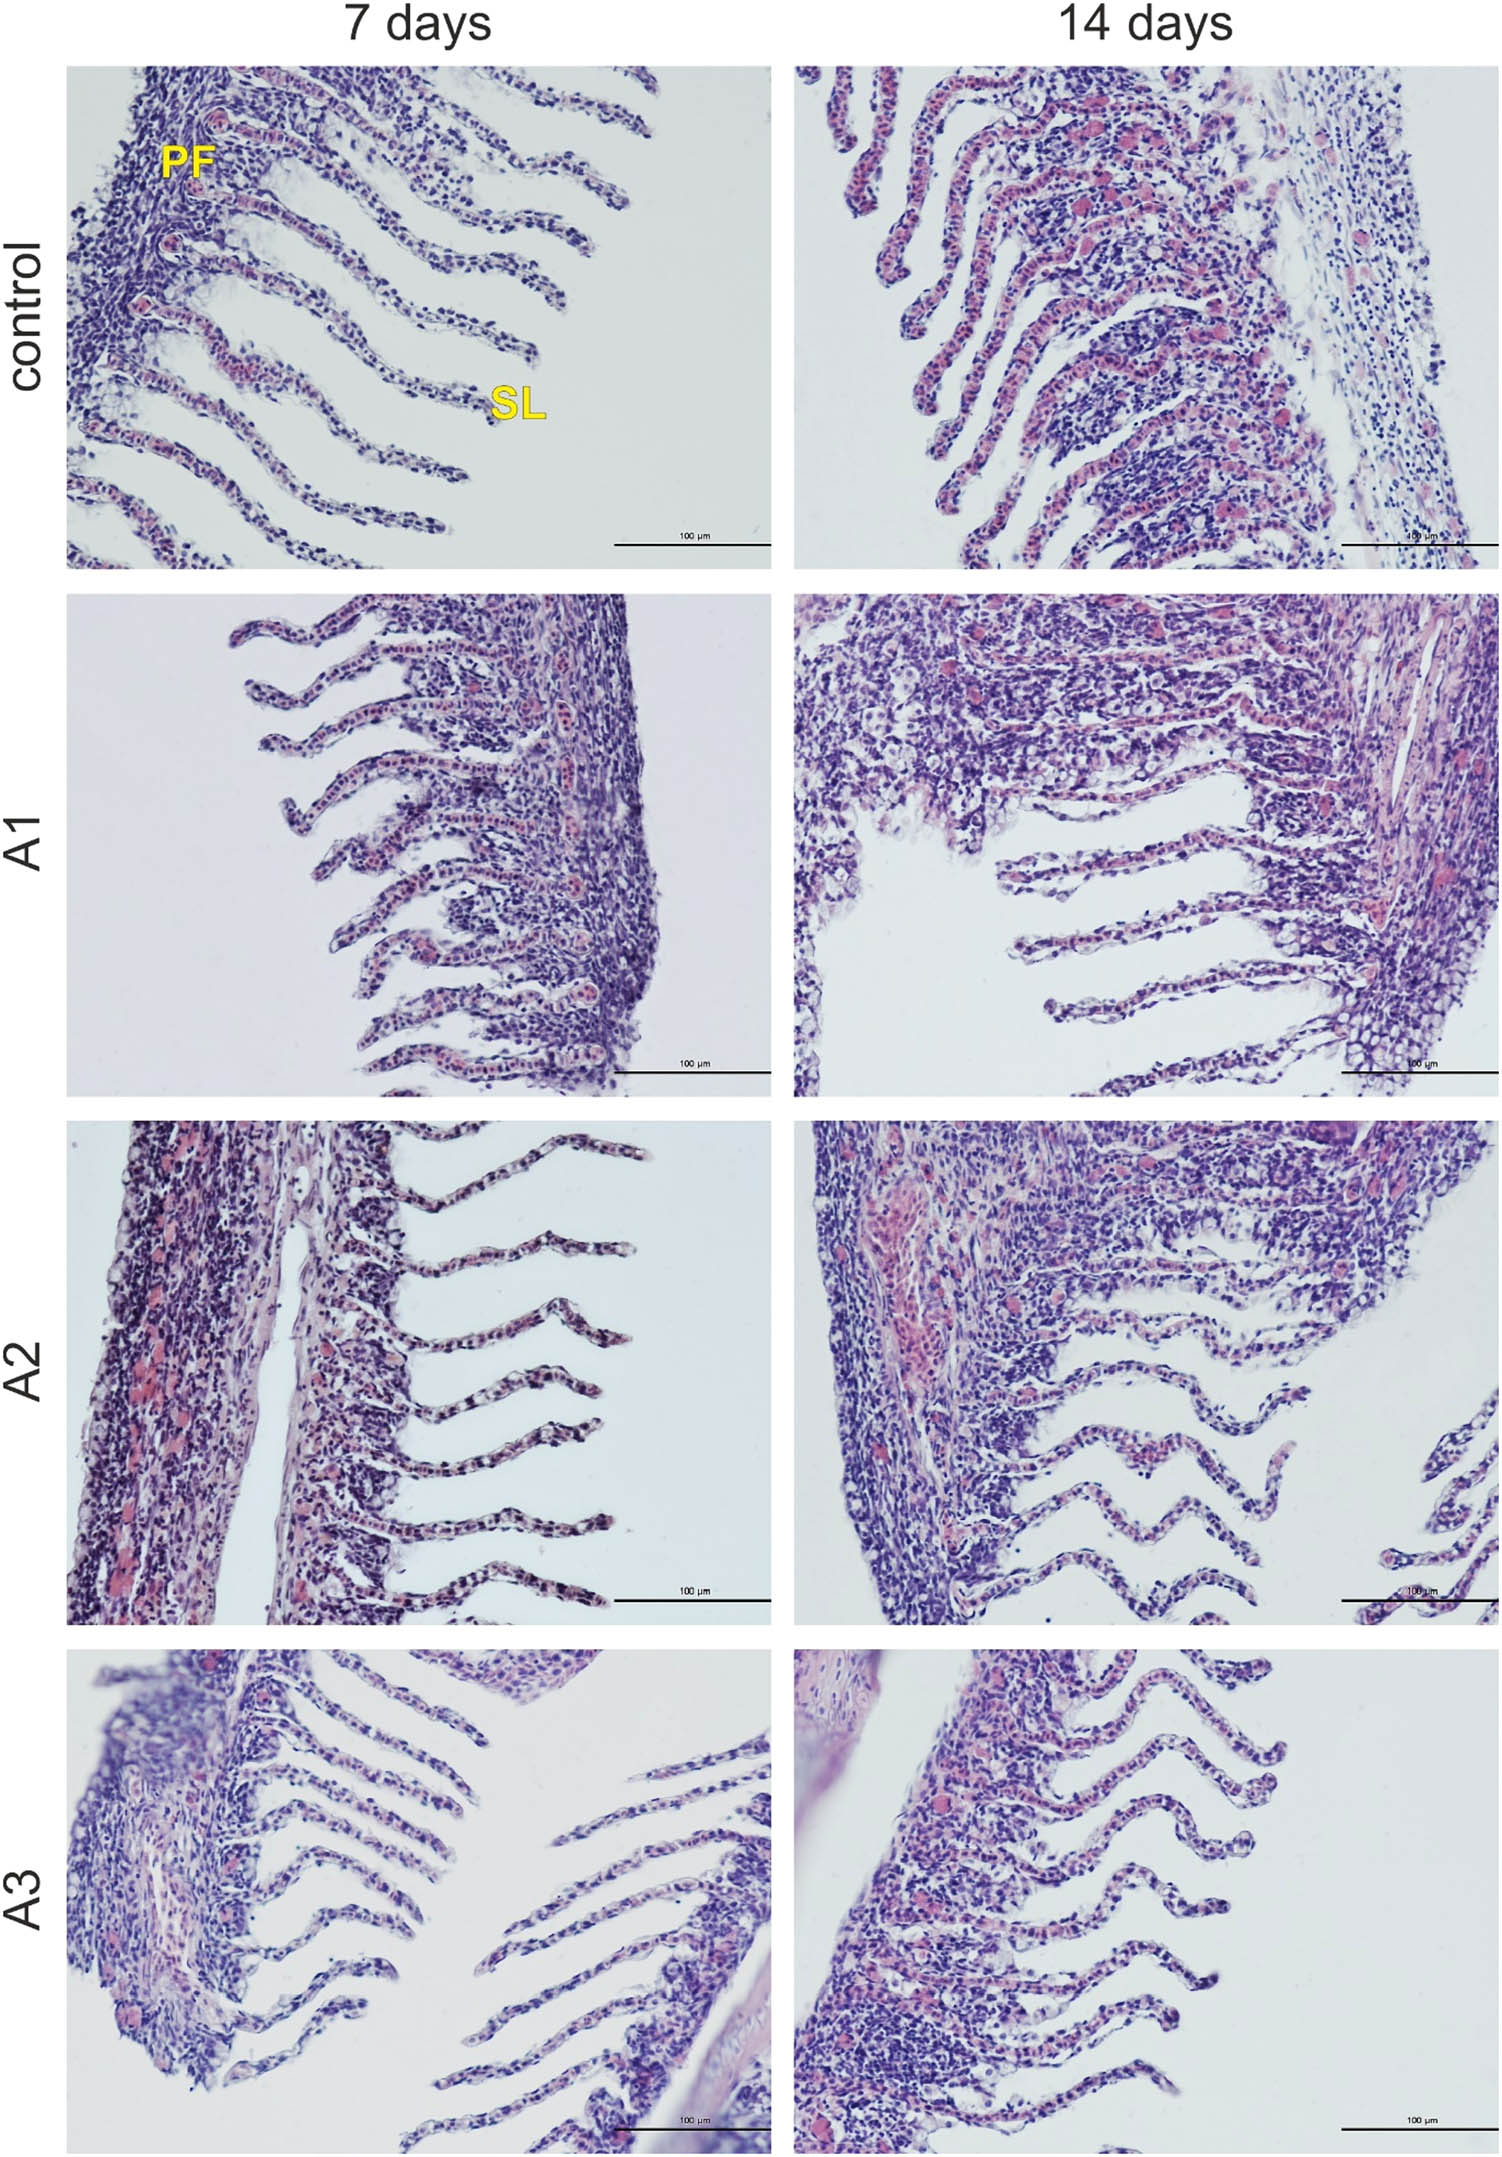
Figure 1
Photomicrographs of the gills of the common carp in the control and experimental groups. PF – primary filament; SL – secondary lamellae. H + E staining. Scale bars: 100 μm.
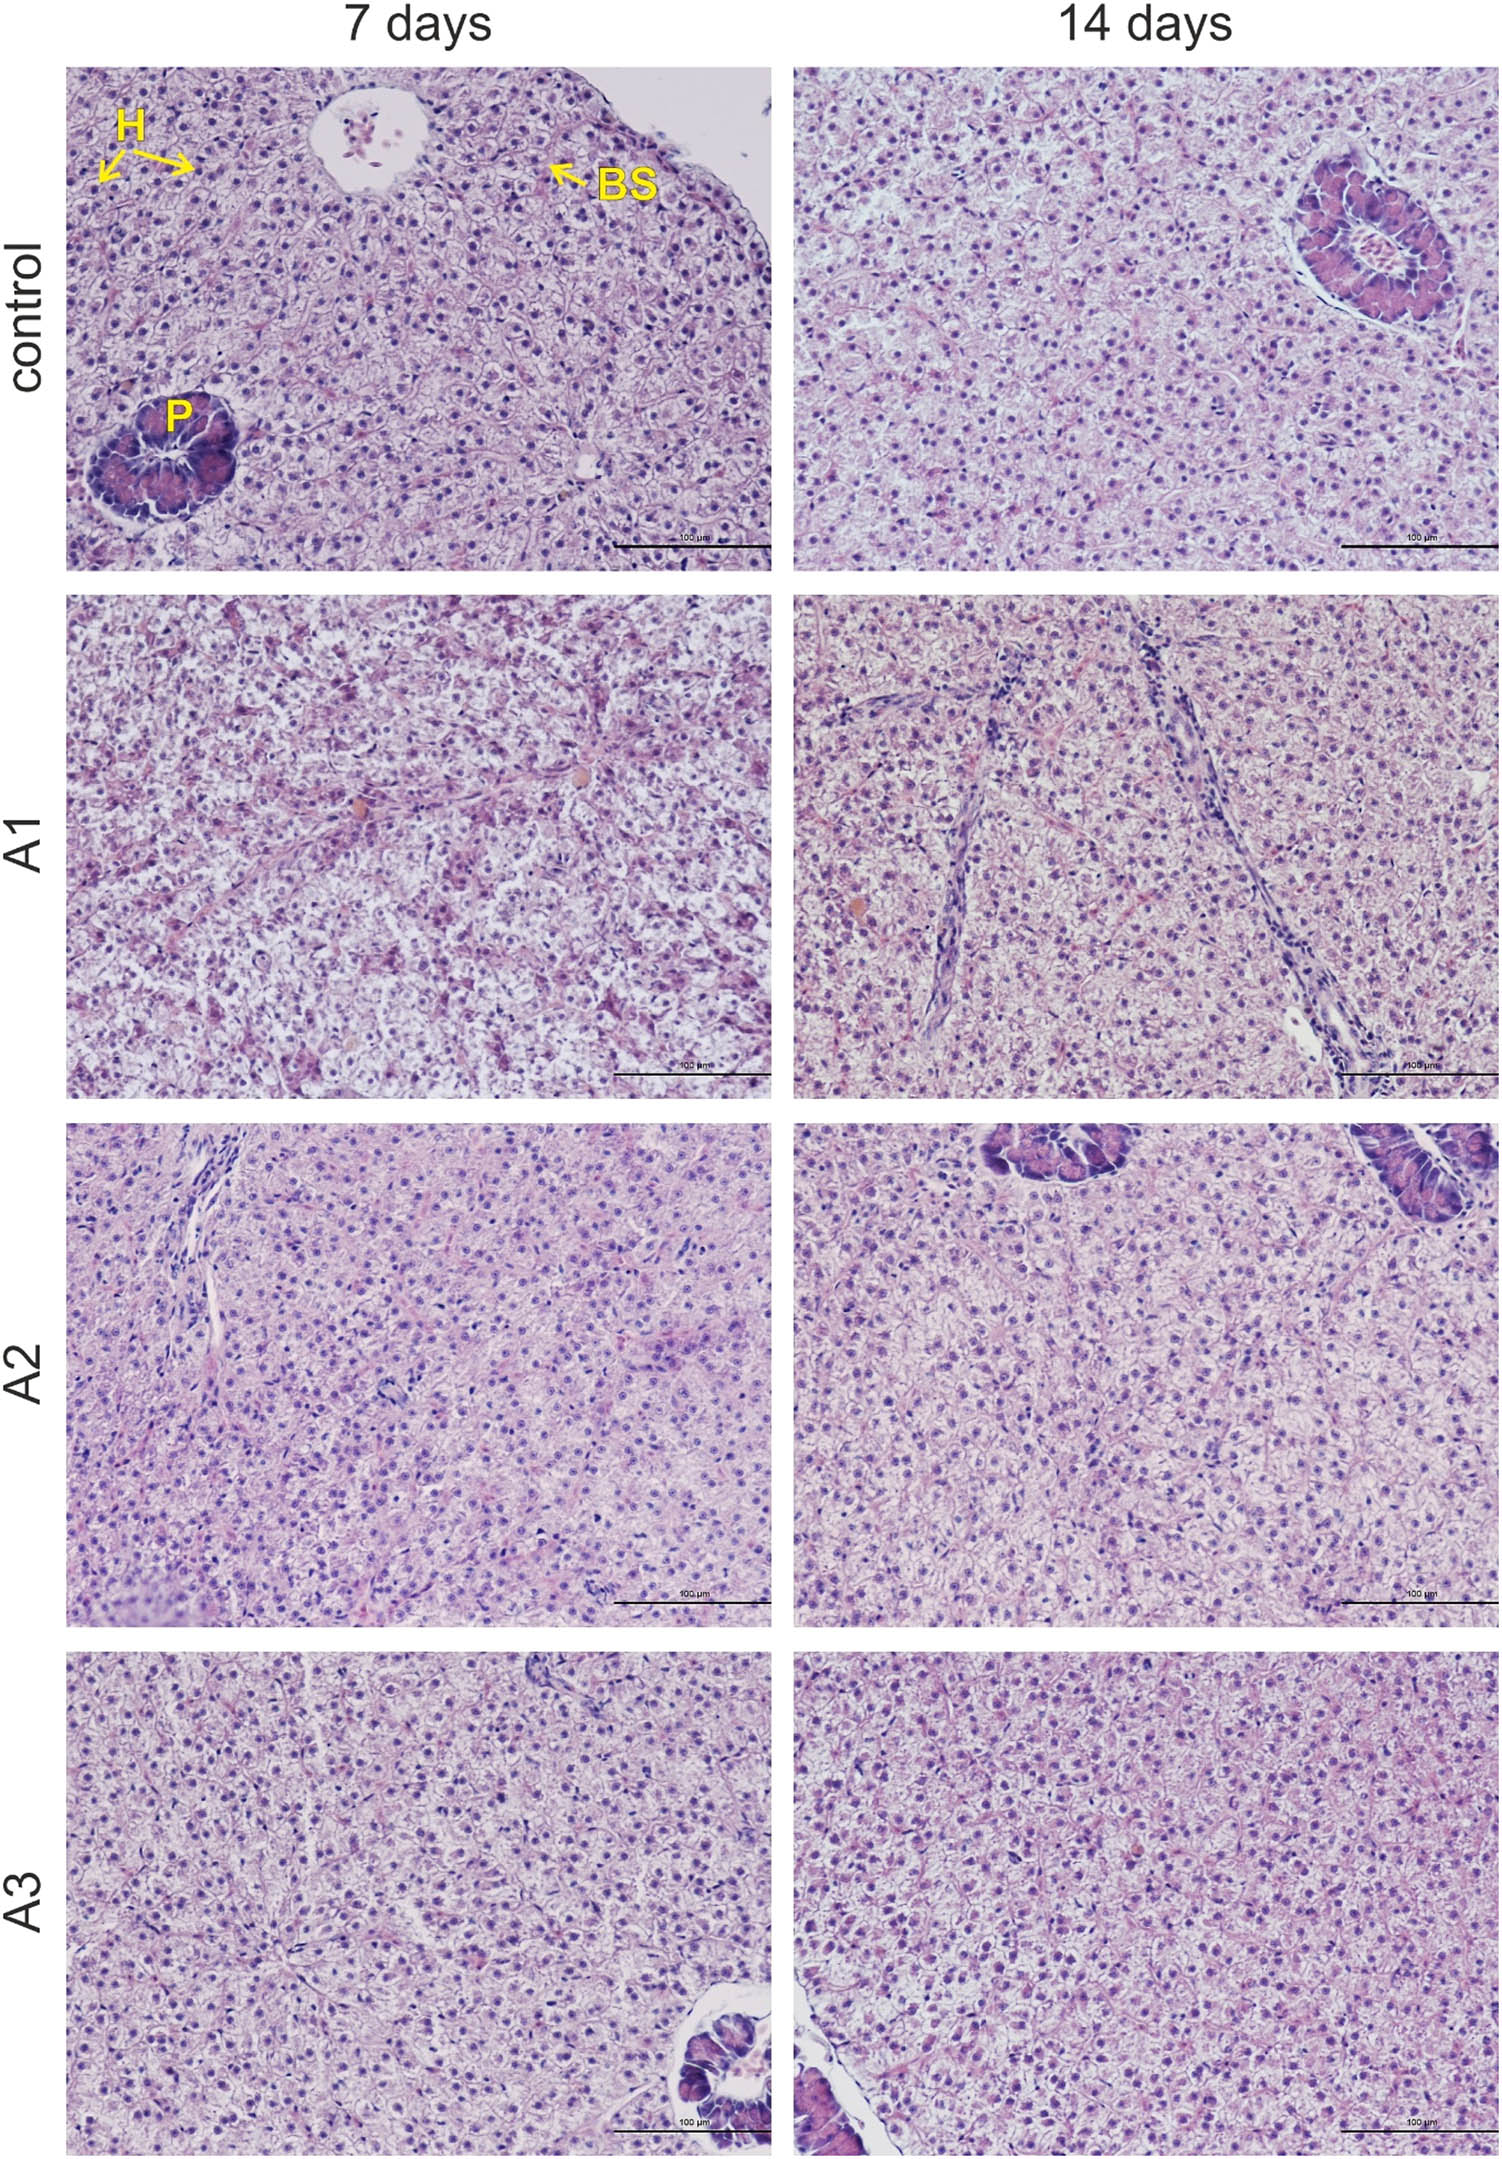
Figure 2
Photomicrographs of the livers of the common carp in the control and experimental groups. H – hepatocytes; BS – blood sinusoid; P – pancreas. H + E staining. Scale bars: 100 μm.
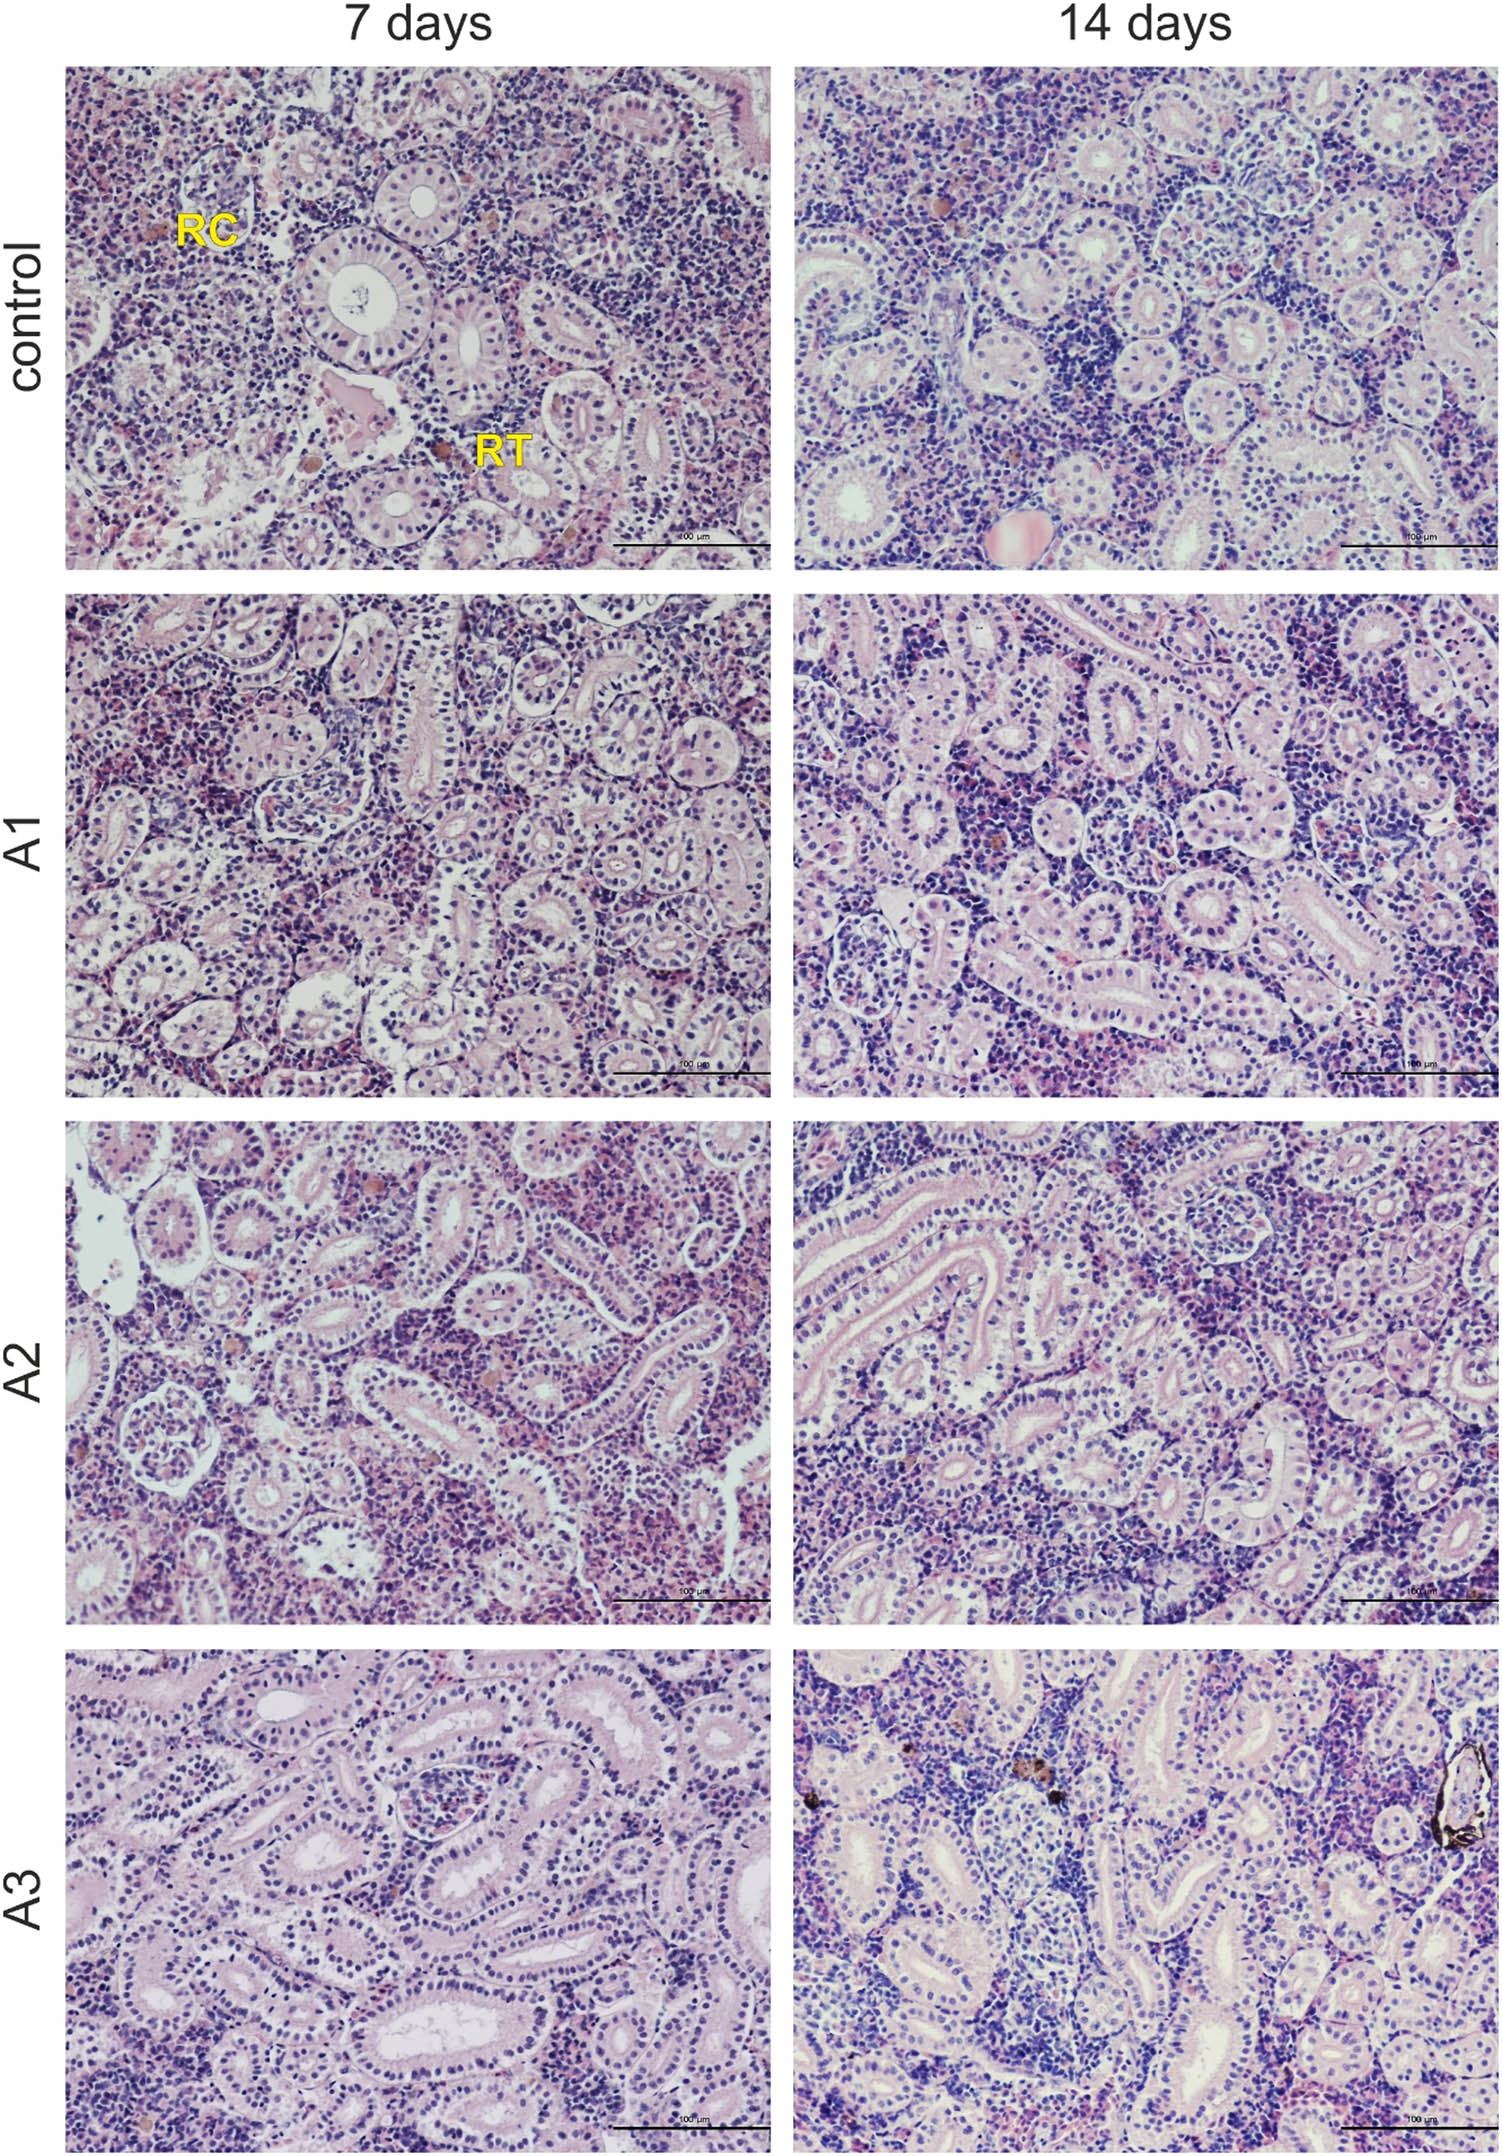
Figure 3
Photomicrographs of the trunk kidneys of the common carp in the control and experimental groups. RC – renal corpuscle; RT – renal tubule. H + E staining. Scale bars: 100 μm.
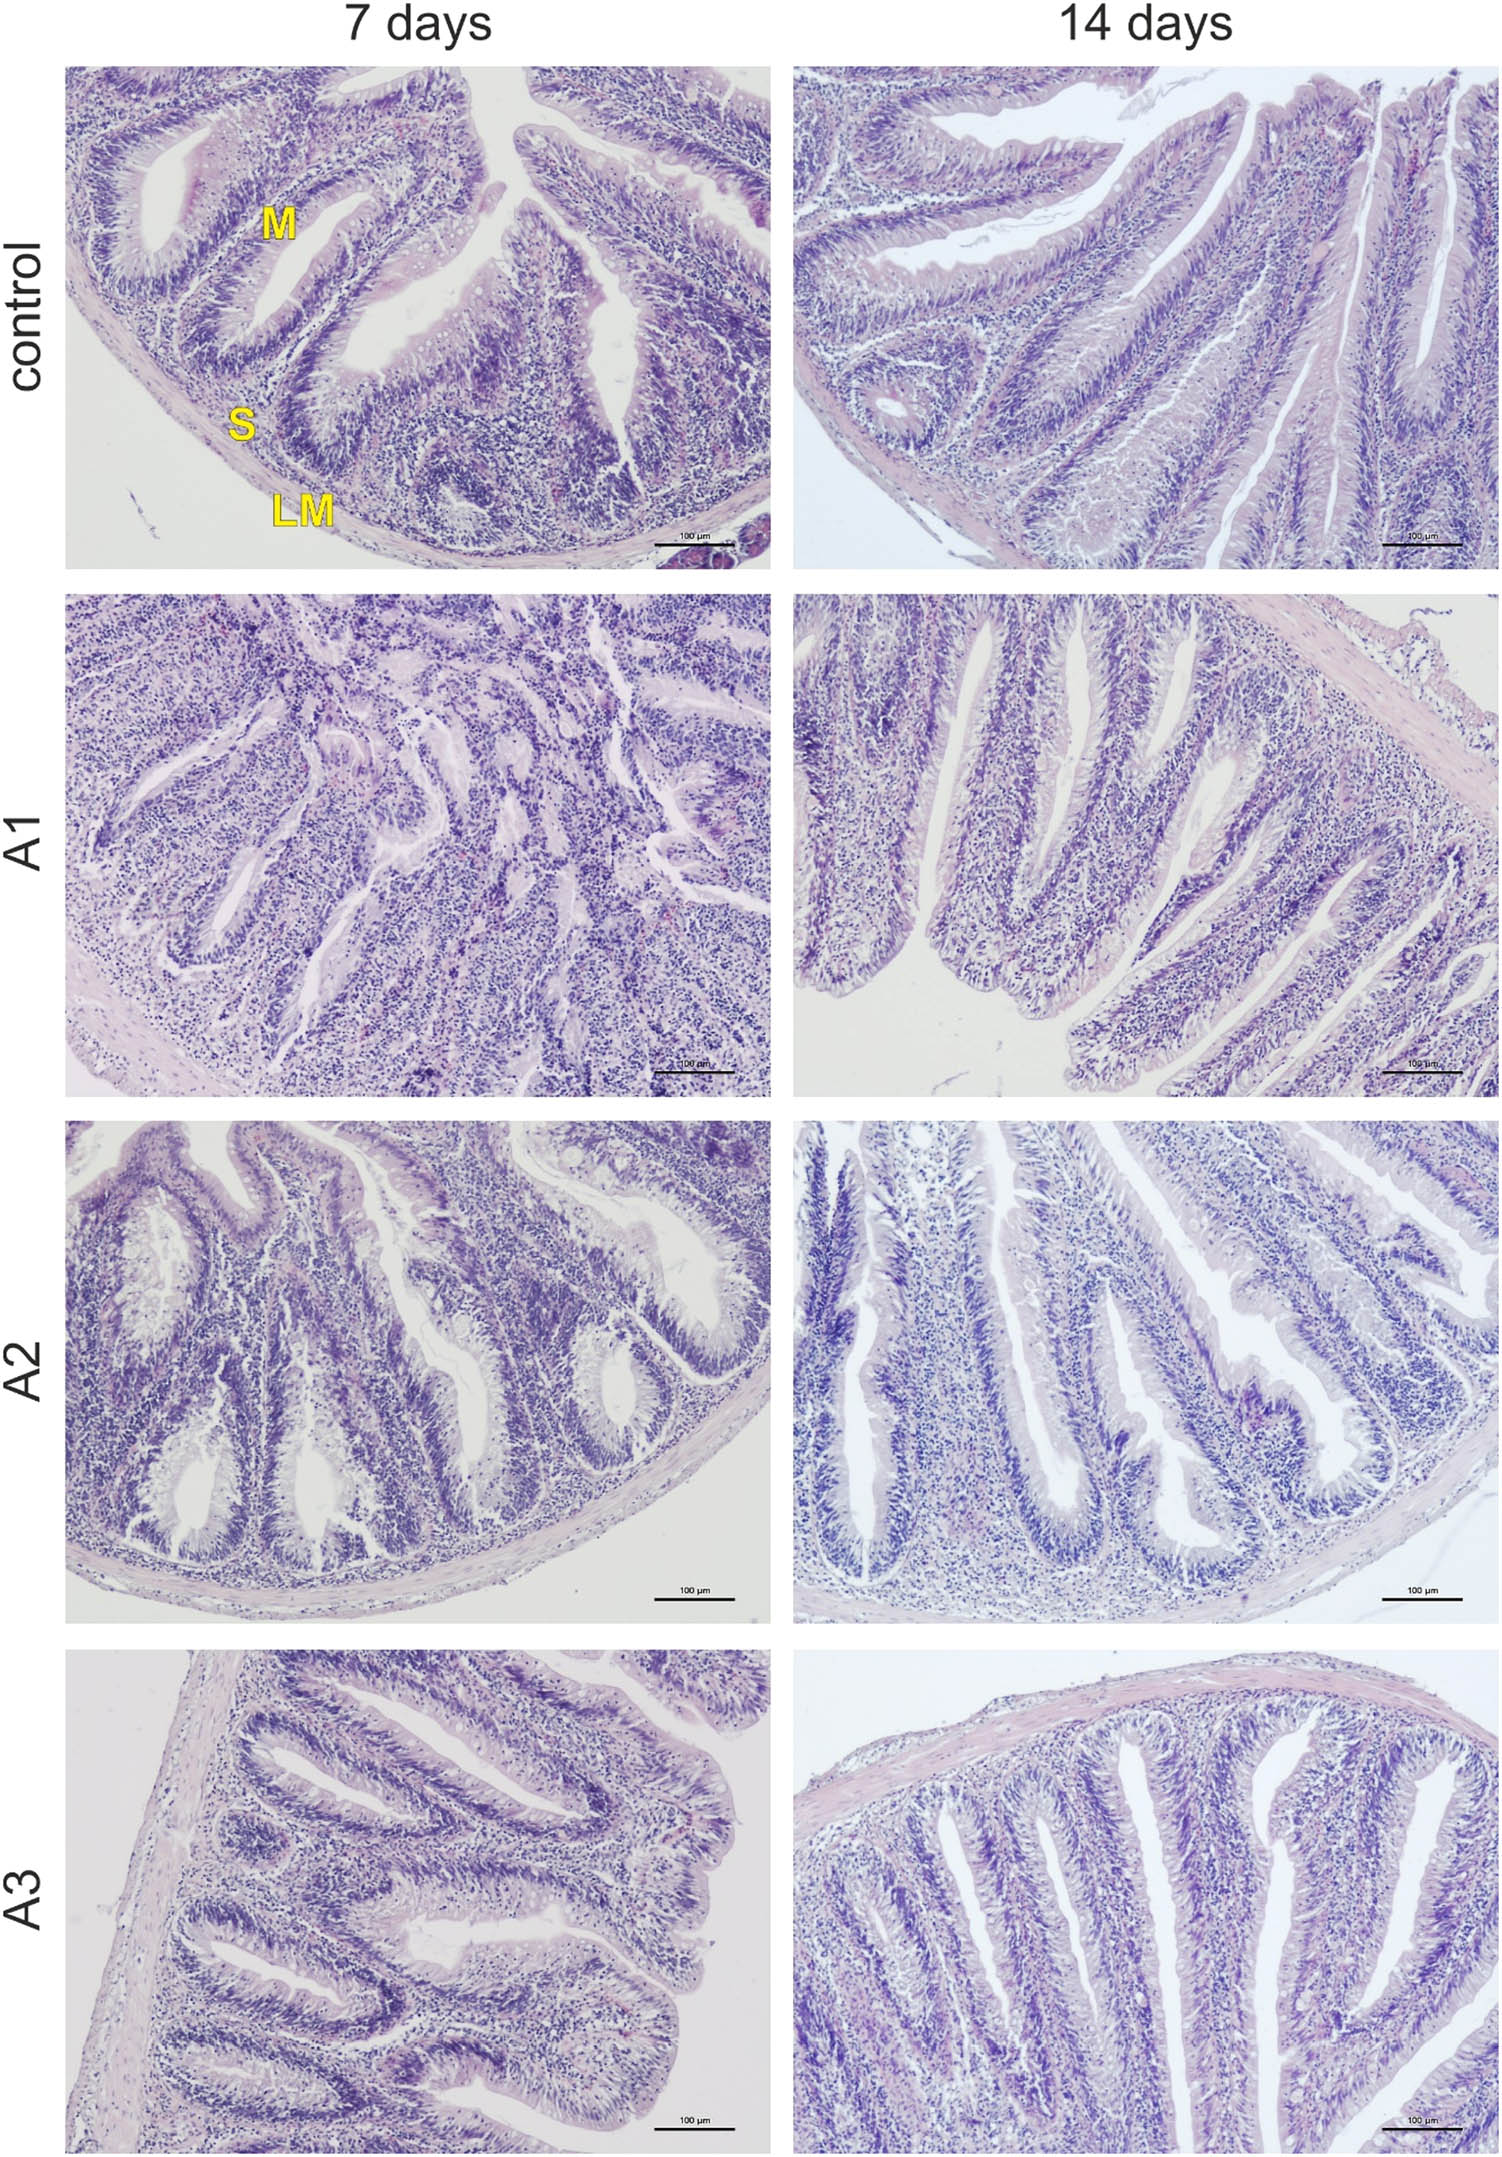
Figure 4
Photomicrographs of the intestines of the common carp in the control and experimental groups. LM – lamina muscularis; S – submucosa; M – mucosa. H + E staining. Scale bars: 100 μm.