
Table 1
Chemical composition of feed ingredients used in experimental diets (g/kg dry matter, mean ± SEM)
| Specification | MS | TG | RSM | VFB | LP |
|---|---|---|---|---|---|
| Number of samples | 9 | 9 | 9 | 9 | 9 |
| Dry matter (g/kg FM) | 314 ± 1 | 885 ± 1 | 869 ± 1 | 872 ± 1 | 886 ± 2 |
| Organic matter (g/kg DM) | 964 ± 2 | 956 ± 1 | 923 ± 2 | 971 ± 2 | 965 ± 2 |
| Crude protein (g/kg DM) | 88.5 ± 1.3 | 124 ± 1 | 384 ± 1 | 331 ± 2 | 350 ± 2 |
| Crude fat (g/kg DM) | 11.2 ± 0.6 | 17 ± 1 | 26 ± 2 | 16 ± 0 | 42 ± 1 |
| NDF (g/kg DM) | 336 ± 5 | 169 ± 1 | 293 ± 2 | 157 ± 4 | 252 ± 5 |
| ADF (g/kg DM) | 194 ± 1 | 43 ± 0 | 221 ± 1 | 104 ± 1 | 197 ± 2 |
| NFC (g/kg DM) | 503 ± 3 | 636 ± 4 | 235 ± 4 | 472 ± 4 | 318 ± 4 |
| pH | 3.54 ± 0.09 | — | — | — | — |
| Lactic acid (g/kg DM) | 27.8 ± 7.3 | — | — | — | — |
| Acetic acid (g/kg DM) | 6.3 ± 1.3 | — | — | — | — |
| Butyric acid (g/kg DM) | 0.08 ± 0.03 | — | — | — | — |
| Ammonia N (g/kg total N) | 33.6 ± 11.4 | — | — | — | — |
| UFV | 0.85 ± 0.01 | 1.18 ± 0.01 | 1.05 ± 0.01 | 1.21 ± 0.01 | 1.22 ± 0.01 |
| PDIN (g/kg DM) | 50.2 ± 0.4 | 88.5 ± 0.2 | 253 ± 1 | 208 ± 0 | 221 ± 0 |
| PDIE (g/kg DM) | 68.3 ± 0.6 | 108.1 ± 0.2 | 160 ± 1 | 112 ± 0 | 138 ± 0 |
| Condensed tannins (mg/g DM) | 0.05 ± 0.00 | nd | 0.05 ± 0.00 | 7.98 ± 0.00 | 0.05 ± 0.00 |
Values are means ± SEM. MS = maize silage; TG = triticale grain; RSM = rapeseed meal; VFB = Vicia faba seeds; LP = lupin seeds; DM = dry matter; FM = fresh matter; NDF = neutral detergent fibre; ADF = acid detergent fibre; NFC = non-fibre carbohydrates; UFV = feed units for meat production; PDIN = protein digested in the small intestine when rumen fermentable nitrogen is limiting; PDIE = protein digested in the small intestine when rumen fermentable energy is limiting; nd = not detected.
Table 2
Ingredient composition (% of dry matter) and chemical composition of experimental diets (g/kg dry matter)
| Specification | RSM | VFB | LP |
|---|---|---|---|
| Maize silage | 62 | 62 | 62 |
| Triticale grain | 21 | 17 | 19 |
| Rapeseed meal | 15 | — | — |
| Vicia faba seeds | — | 19 | — |
| Lupin seeds | — | — | 17 |
| Mineral–vitamin premix | 2 | 2 | 2 |
| Dry matter (g/kg FM) | 511 | 510 | 513 |
| Organic matter | 936.8 | 944.6 | 943.4 |
| Crude protein | 138.5 | 138.8 | 139.4 |
| NDF | 287.7 | 266.9 | 283.3 |
| ADF | 162.4 | 147.3 | 161.9 |
| NFC | 480.6 | 509.5 | 486.7 |
| UFV | 0.94 | 0.95 | 0.95 |
| PDIN | 87.5 | 85.4 | 85.3 |
| PDIE | 98.8 | 91.7 | 96.3 |
RSM = rapeseed meal; VFB = Vicia faba seeds; LP = lupin seeds; FM = fresh matter; NDF = neutral detergent fibre; ADF = acid detergent fibre; NFC = non-fibre carbohydrates; UFV = feed units for meat production; PDIN = protein digested in the small intestine when rumen fermentable nitrogen is limiting; PDIE = protein digested in the small intestine when rumen fermentable energy is limiting.
Table 3
Fatty acid profile and condensed tannin content of individual feed ingredients (RSM, VFB, LP) and corresponding experimental concentrates (RSMc, VFBc, LPc) (mg/g dry matter)
| Fatty acid | RSM | VFB | LP | RSMc | VFBc | LPc |
|---|---|---|---|---|---|---|
| C16:0 | 2.67 | 2.04 | 4.52 | 2.33 | 2.07 | 3.21 |
| C18:0 | 0.73 | 0.51 | 1.71 | 0.74 | 0.62 | 1.19 |
| C18:1 n−9 | 10.54 | 3.70 | 14.96 | 7.67 | 4.67 | 9.98 |
| C18:2 n−6 | 8.83 | 8.84 | 17.85 | 7.15 | 7.47 | 11.47 |
| C18:3 n−3 | 1.85 | 0.91 | 2.29 | 0.96 | 0.64 | 1.25 |
| Condensed tannins | 0.05 | 7.98 | 0.05 | 0.00 | 1.51 | 0.00 |
RSM = rapeseed meal; VFB = Vicia faba seeds; LP = lupin seeds; RSMc, VFBc, LPc = complete experimental concentrates corresponding to each dietary treatment. Condensed tannin values for feed ingredients represent intrinsic concentrations in the respective raw materials, whereas values for concentrates reflect their final concentration after formulation of the experimental diets.
Table 4
Chemical composition of longissimus lumborum muscle from Holstein-Friesian bulls (mean and SEM)
| Trait | RSM | VFB | LP | SEM | P-value |
|---|---|---|---|---|---|
| Moisture (%) | 71.40 | 71.54 | 71.25 | 0.295 | 0.930 |
| Crude protein (%) | 22.58 | 22.98 | 22.59 | 0.189 | 0.620 |
| Collagen (g/100 g) | 2.17 | 2.22 | 2.06 | 0.048 | 0.365 |
| Intramuscular fat (%) | 3.31 | 3.23 | 2.94 | 0.346 | 0.881 |
| Ash (%) | 1.10 | 0.93 | 1.20 | 0.068 | 0.258 |
Values are means ± SEM (n = 10). RSM = rapeseed meal; VFB = Vicia faba seeds; LP = lupin seeds.
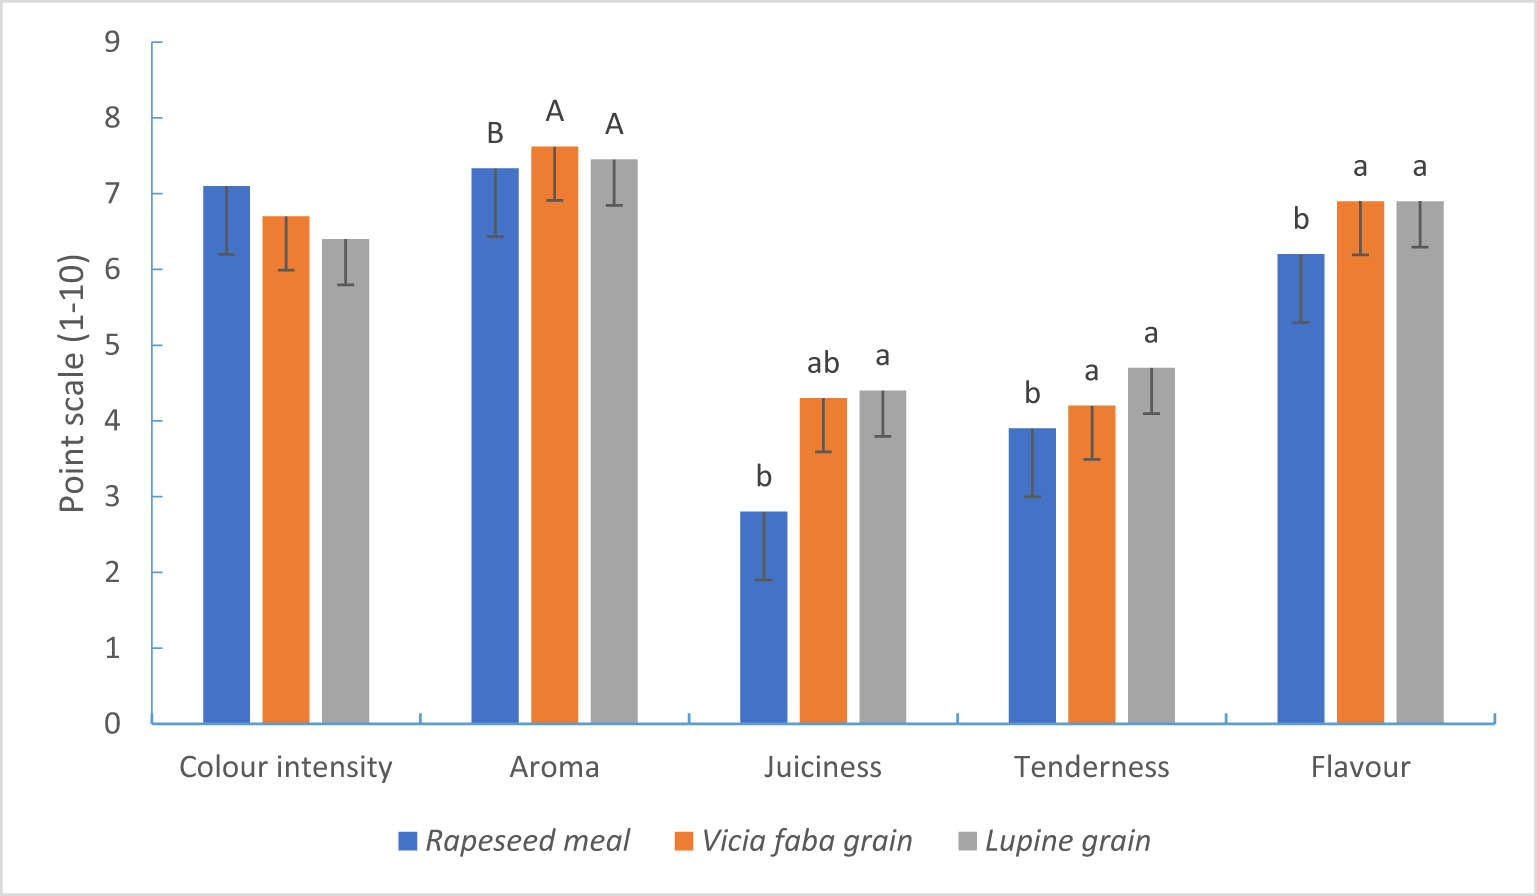
Figure 1
Sensory attributes of longissimus lumborum muscle from Holstein-Friesian bulls fed finishing diets differing in protein source (rapeseed meal, faba bean or white lupin). Data are presented as mean ± SEM (n = 10 per treatment). Different superscript letters indicate significant differences between dietary treatments A, B – P < 0.01; a, b – P < 0.05.
Table 5
Content of selected functional fatty acids, fatty acid groups, ratios, and lipid quality indices of intramuscular fat in longissimus lumborum muscle (% of total fatty acids, mean and SEM)
| Fatty acid | RSM | VFB | LP | SEM | P-value |
|---|---|---|---|---|---|
| C18:1 trans-11 (TVA) | 1.27 A | 0.93 B | 1.32 A | 0.048 | <0.001 |
| C18:1 cis-9 (OA) | 41.18 | 42.24 | 40.87 | 0.438 | 0.414 |
| C18:1 trans-16 | 0.31 a | 0.25 b | 0.27 b | 0.008 | 0.045 |
| C18:2 n−6 (LA) | 3.83 | 3.61 | 3.53 | 0.152 | 0.723 |
| C18:2 cis-9, trans-11 (CLA) | 0.40 A | 0.32 B | 0.33 B | 0.010 | <0.001 |
| C18:3 n−3 (LNA) | 0.48 A | 0.34 B | 0.32 B | 0.017 | 0.004 |
| C20:4 n−6 | 0.82 | 0.95 | 0.81 | 0.069 | 0.654 |
| C20:5 n−3 (EPA) | 0.08 a | 0.07 ab | 0.06 b | 0.005 | 0.044 |
| C22:5 n−3 (DPA) | 0.22 | 0.23 | 0.19 | 0.013 | 0.442 |
| C22:6 n−3 (DHA) | 0.03 | 0.04 | 0.04 | 0.002 | 0.108 |
| SFA | 42.35 | 42.41 | 43.18 | 0.437 | 0.710 |
| MUFA | 51.07 | 51.64 | 51.06 | 0.437 | 0.832 |
| PUFA | 6.58 a | 5.97 b | 5.76 b | 0.112 | 0.039 |
| n−3 PUFA | 1.64 a | 1.65 a | 1.43 b | 0.044 | 0.047 |
| n−6 PUFA | 4.65 | 4.56 | 4.34 | 0.214 | 0.850 |
| n−6/n−3 PUFA | 2.86 | 2.81 | 3.08 | 0.058 | 0.125 |
| AI | 0.57 | 0.57 | 0.60 | 0.009 | 0.234 |
| TI | 1.23 | 1.22 | 1.28 | 0.021 | 0.435 |
Values are means ± SEM (n = 10). RSM = rapeseed meal; VFB = Vicia faba seeds; LP = lupin seeds; TVA = trans-vaccenic acid; OA = oleic acid; LA = linoleic acid; CLA = conjugated linoleic acid; LNA = α-linolenic acid; EPA = eicosapentaenoic acid; DPA = docosapentaenoic acid; DHA = docosahexaenoic acid; SFA = saturated fatty acids; MUFA = monounsaturated fatty acids; PUFA = polyunsaturated fatty acids; AI = atherogenic index; TI = thrombogenic index.
Values within a row with different superscript letters differ significantly (A, B – P ≤ 0.01; a, b – P ≤ 0.05).
Table 6
Effect of dietary protein source on mineral and vitamin content of longissimus lumborum muscle (mg/100 g fresh meat, mean and SEM)
| Component | RSM | VFB | LP | SEM | P-value |
|---|---|---|---|---|---|
| Sodium (Na) | 48.90 A | 43.51 B | 41.71 B | 0.971 | 0.004 |
| Potassium (K) | 435.10 | 426.62 | 412.63 | 6.171 | 0.350 |
| Magnesium (Mg) | 23.51 b | 25.32 a | 24.61 ab | 0.343 | 0.041 |
| Iron (Fe) | 2.52 | 2.61 | 2.43 | 0.123 | 0.746 |
| Zinc (Zn) | 4.71 | 4.73 | 4.84 | 0.093 | 0.957 |
| Retinol (vitamin A) | 0.03 b | 0.05 a | 0.05 a | 0.004 | 0.026 |
| α-Tocopherol (vitamin E) | 0.59 | 0.47 | 0.38 | 0.039 | 0.084 |
Values are means ± SEM (n = 10). RSM = rapeseed meal; VFB = Vicia faba seeds; LP = lupin seeds. Values within a row with different superscript letters differ significantly (A, B – P ≤ 0.01; a, b – P ≤ 0.05).