
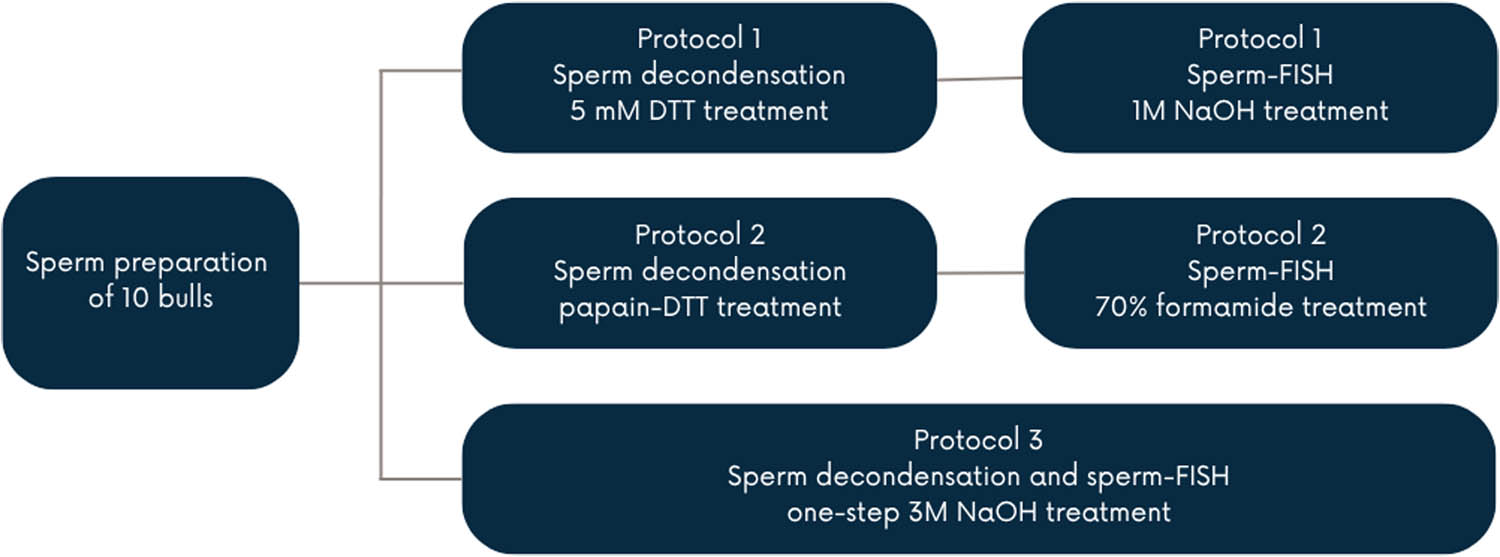
Figure 1
Experimental design.
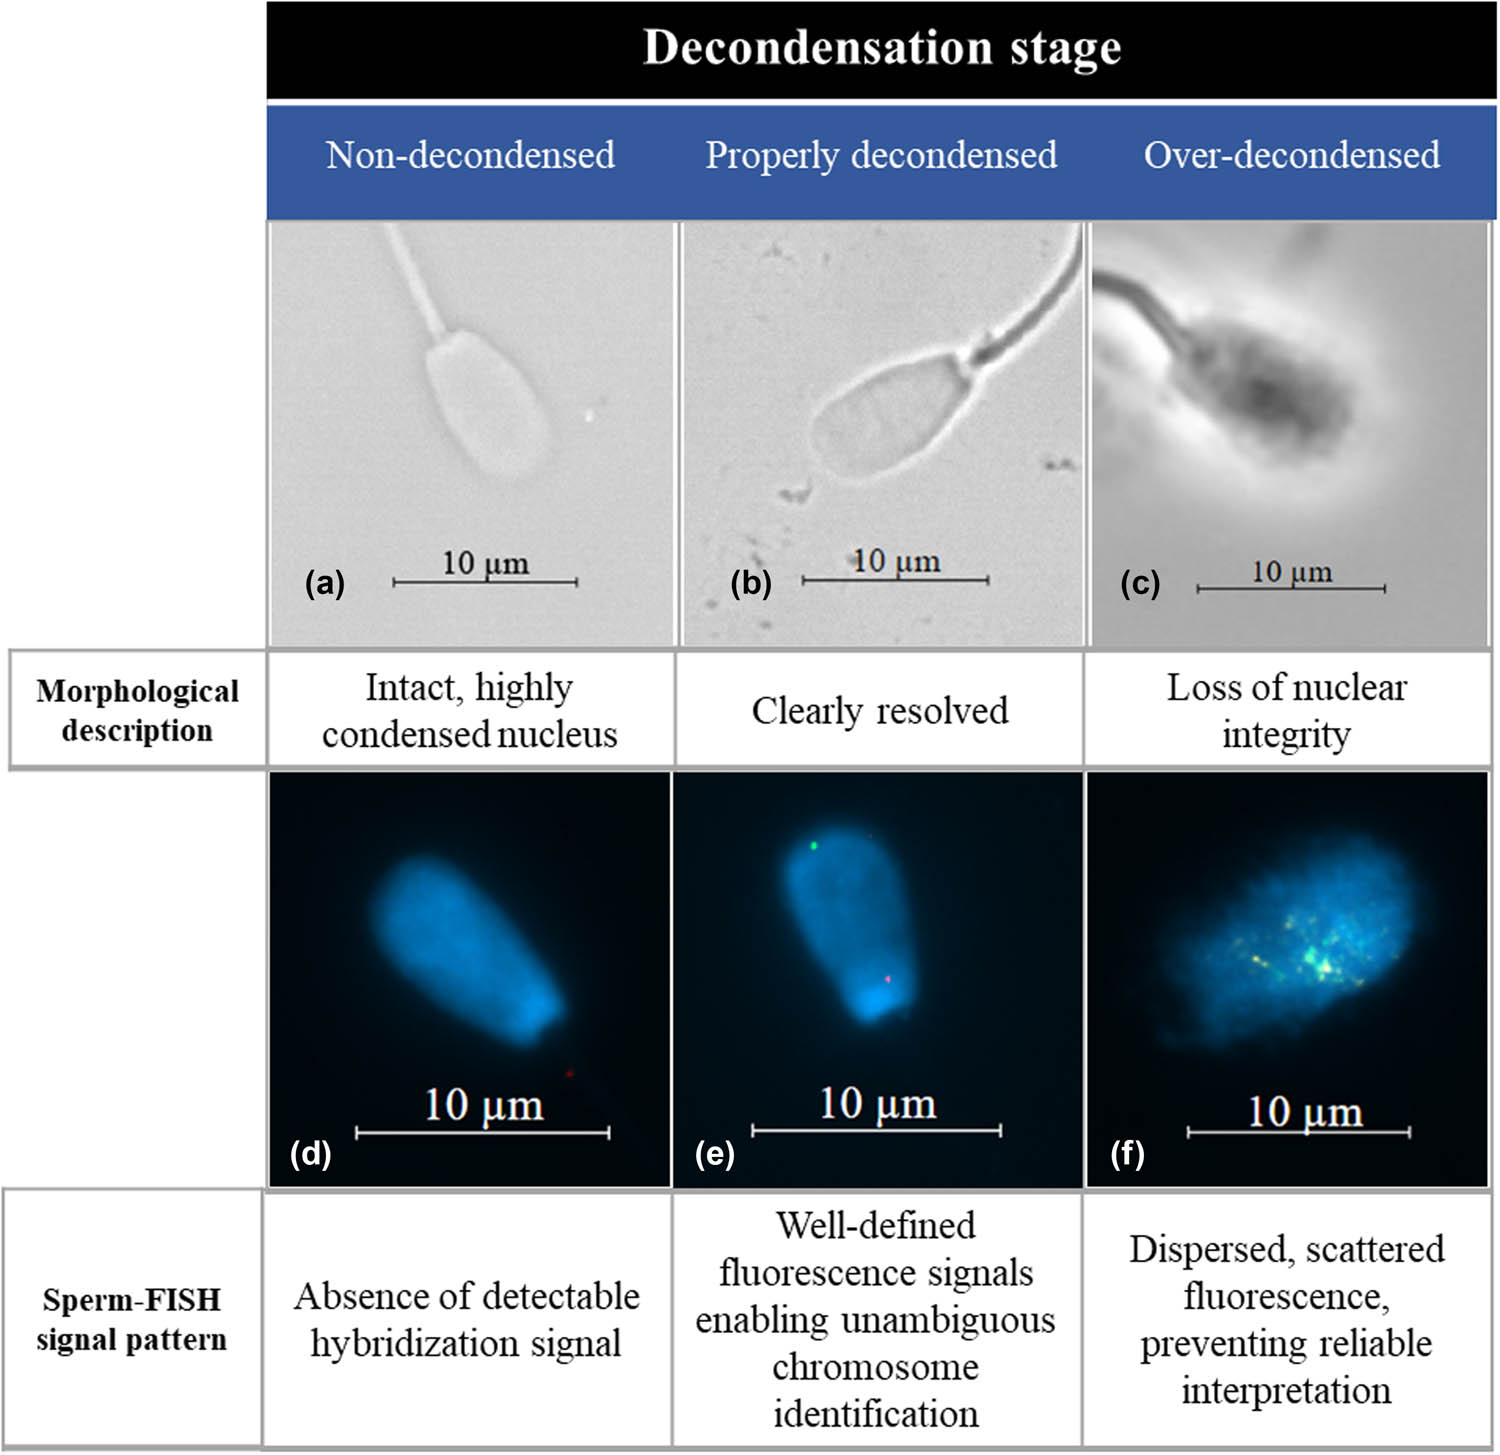
Figure 2
Representative examples of sperm nuclear chromatin decondensation and the corresponding FISH outcomes. Upper panel (a–c) shows phase-contrast microscopy images illustrating three stages of decondensation: (a) non-decondensed sperm with an intact, highly condensed nucleus; (b) properly decondensed sperm with a clearly resolved nucleus; and (c) over-decondensed sperm exhibiting loss of nuclear integrity. Lower panel (d–f) shows the corresponding FISH images: (d) absence of detectable hybridization signals in non-decondensed sperm; (e) well-defined fluorescence signals enabling unambiguous chromosome identification following proper decondensation; and (f) dispersed, scattered fluorescence signals in over-decondensed sperm, preventing reliable interpretation of the FISH results.
Table 1
Effect of protocol on the percentage of properly decondensed spermatozoa, expressed as least-squares means ± standard error, of the total spermatozoa analyzed
| Protocol 1 | Protocol 2 | Protocol 3 | |
|---|---|---|---|
| Properly decondensed spermatozoa | 74.9 ± 0.554 A | 77.4 ± 0.518 B | 89.7 ± 0.344 C |
A–C – Mean values in the same row with different letters significantly differ (P < 0.05).