
Table 1
Component composition of feed mixture fed to rabbits
| Component | % |
|---|---|
| Post-extraction soybean meal | 13.00 |
| Alfalfa meal | 20.10 |
| Wheat bran | 18.10 |
| Ground barley | 28.80 |
| Ground maize | 11.00 |
| Rapeseed oil | 2.00 |
| Phosphate | 1.00 |
| NaCl | 0.50 |
| Mineral and vitamin premix | 1.00 |
| Arbocel | 4.50 |
Table 2
Chemical composition of feed mixture
| Chemical composition | Content |
|---|---|
| DM (%) | 90.64 |
| Crude ash (%) | 6.92 |
| Crude fat (%) | 4.19 |
| CP (%) | 15.20 |
| CF (%) | 14.2 |
| NDF (%) | 25.6 |
| ADF (%) | 14.4 |
| ADL (%) | 2.95 |
| NFE (%) | 59.49 |
| DE (MJ/kg DM) | 15.65 |
Note: NDF – neutral detergent fibre; ADF – acid detergent fibre; ADL – acid detergent lignin; NFE – nitrogen-free extract; DE – digestible energy, DP – digestible protein.
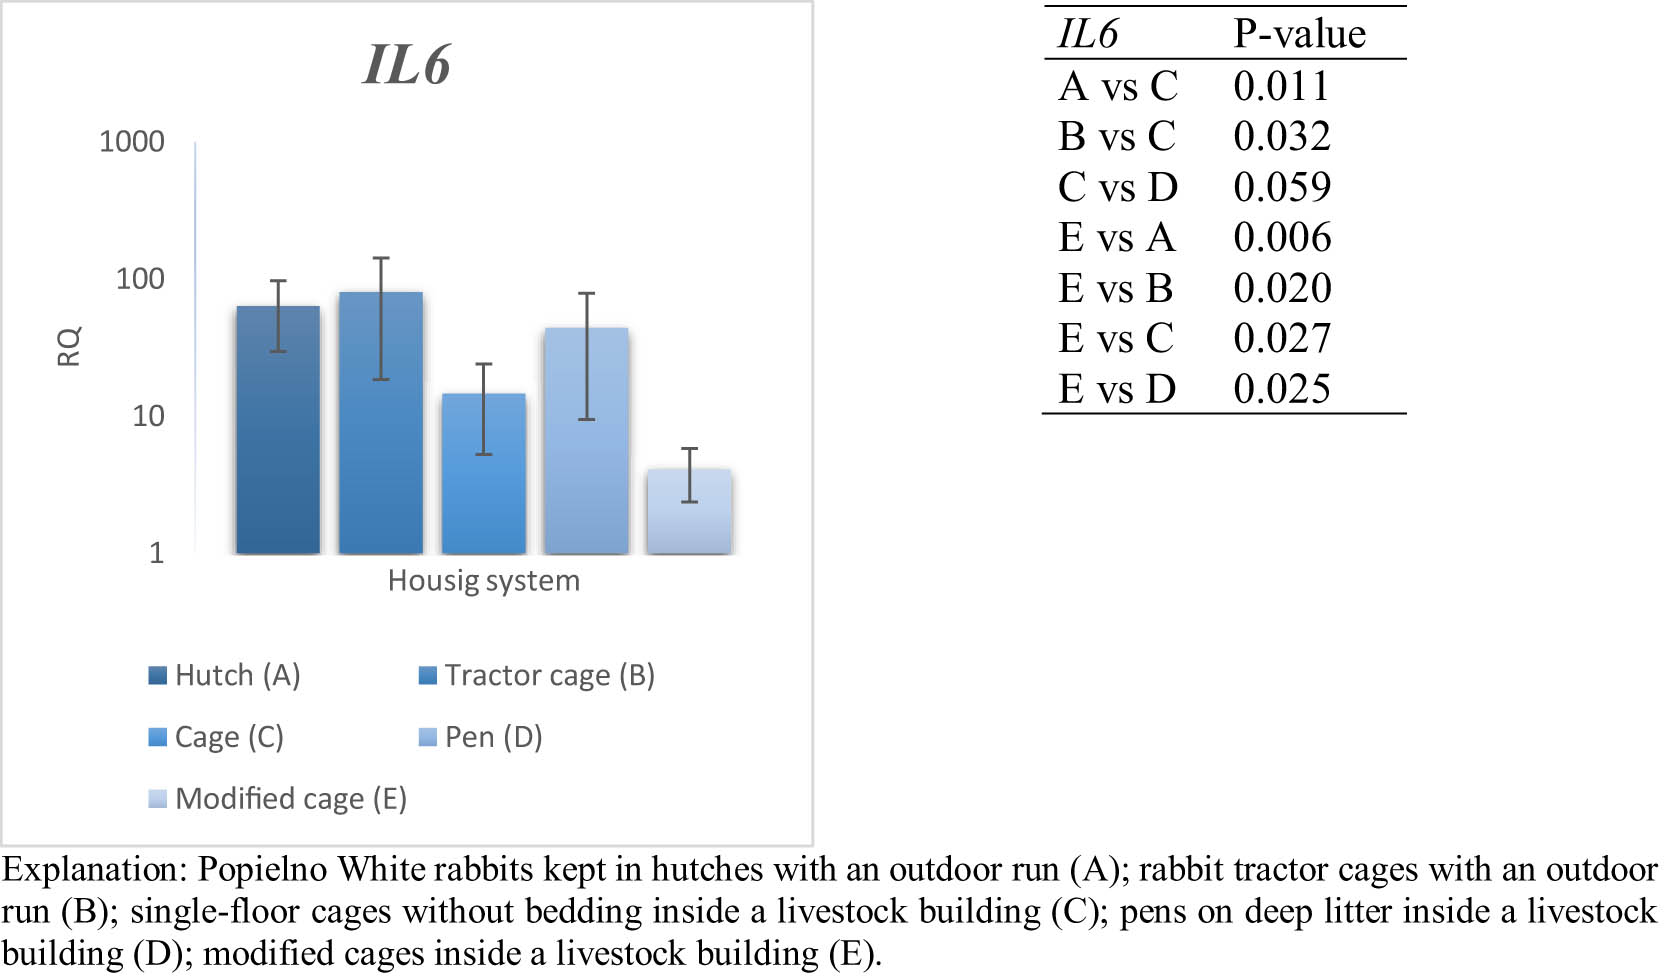
Figure 1
Effect of housing system on the relative expression of the IL6 gene in the blood of PW rabbits (n = 8 rabbits per housing system; mean values ± SD) (RQ – relative quantity normalised to ACTB and B2M).
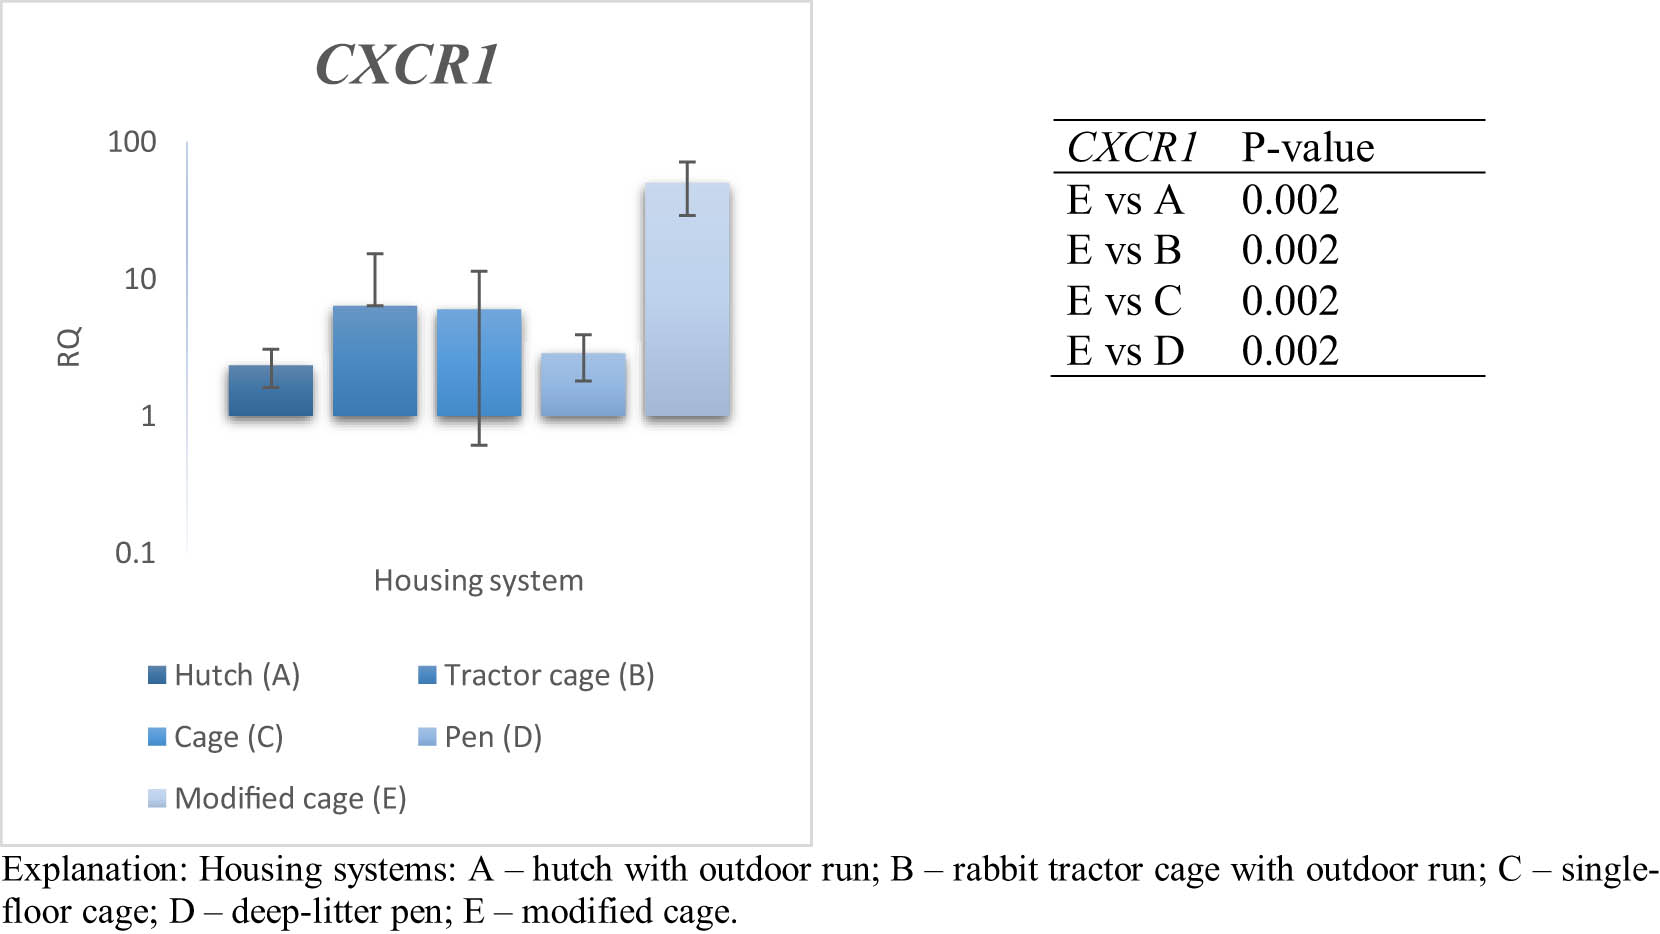
Figure 2
Effect of housing system on the relative expression of the CXCR1 gene in the blood of PW rabbits (n = 8 rabbits per housing system; mean values ± SD) (RQ – relative quantity normalised to ACTB and B2M).
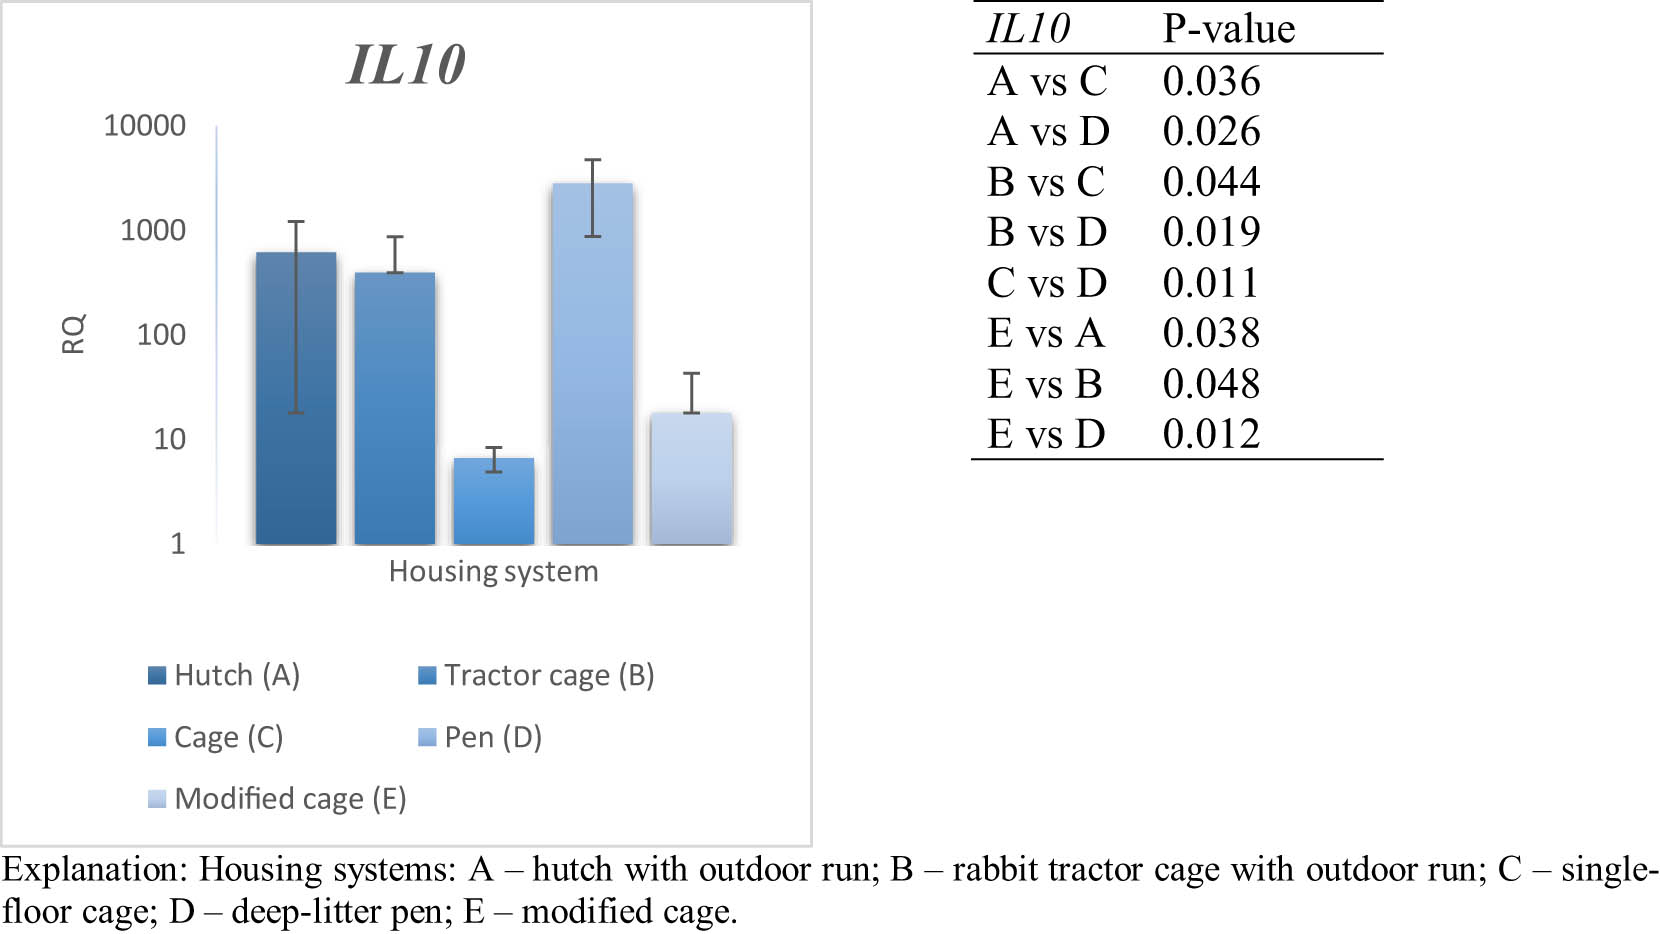
Figure 3
Effect of housing system on the relative expression of the IL10 gene in the blood of PW rabbits (n = 8 rabbits per housing system; mean values ± SD) (RQ – relative quantity normalised to ACTB and B2M).
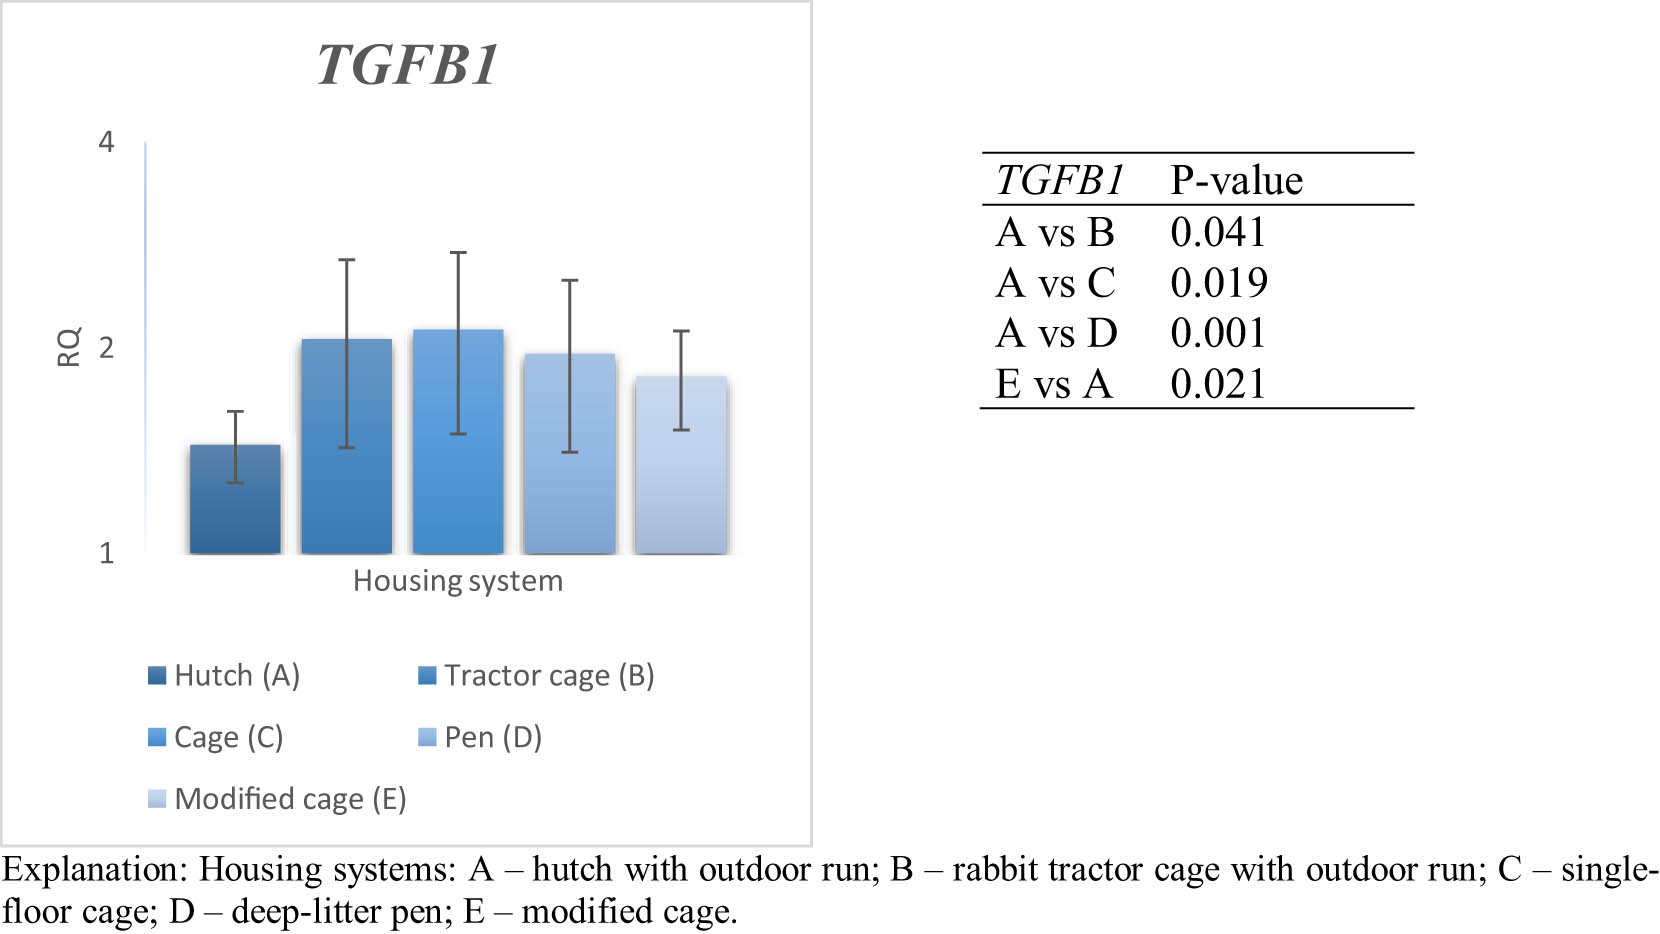
Figure 4
Effect of housing system on the relative expression of the TGFB1 gene in the blood of PW (PW) rabbits (n = 8 rabbits per housing system; means ± SD) (RQ – relative quantity normalised to ACTB and B2M).
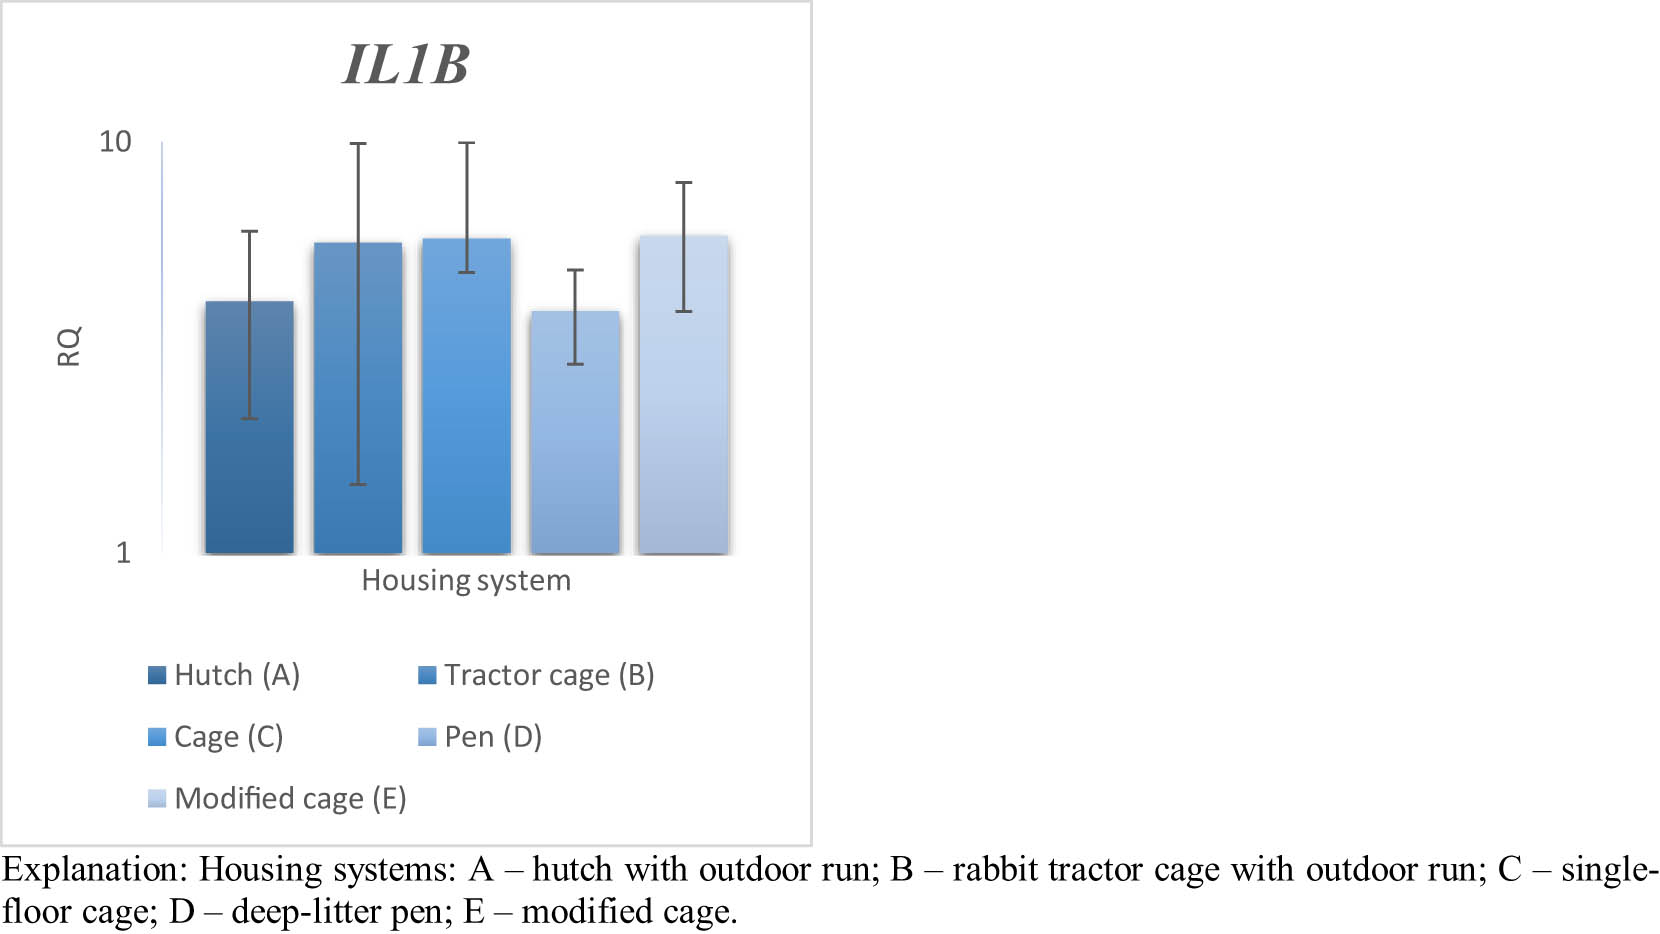
Figure 5
Effect of housing system on the relative expression of the IL1B gene in the blood of PW rabbits (n = 8 rabbits per housing system; mean values ± SD) (RQ – relative quantity normalised to ACTB and B2M). Explanation: Housing systems: A – hutch with outdoor run; B – rabbit tractor cage with outdoor run; C – single-floor cage; D – deep-litter pen; and E – modified cage.
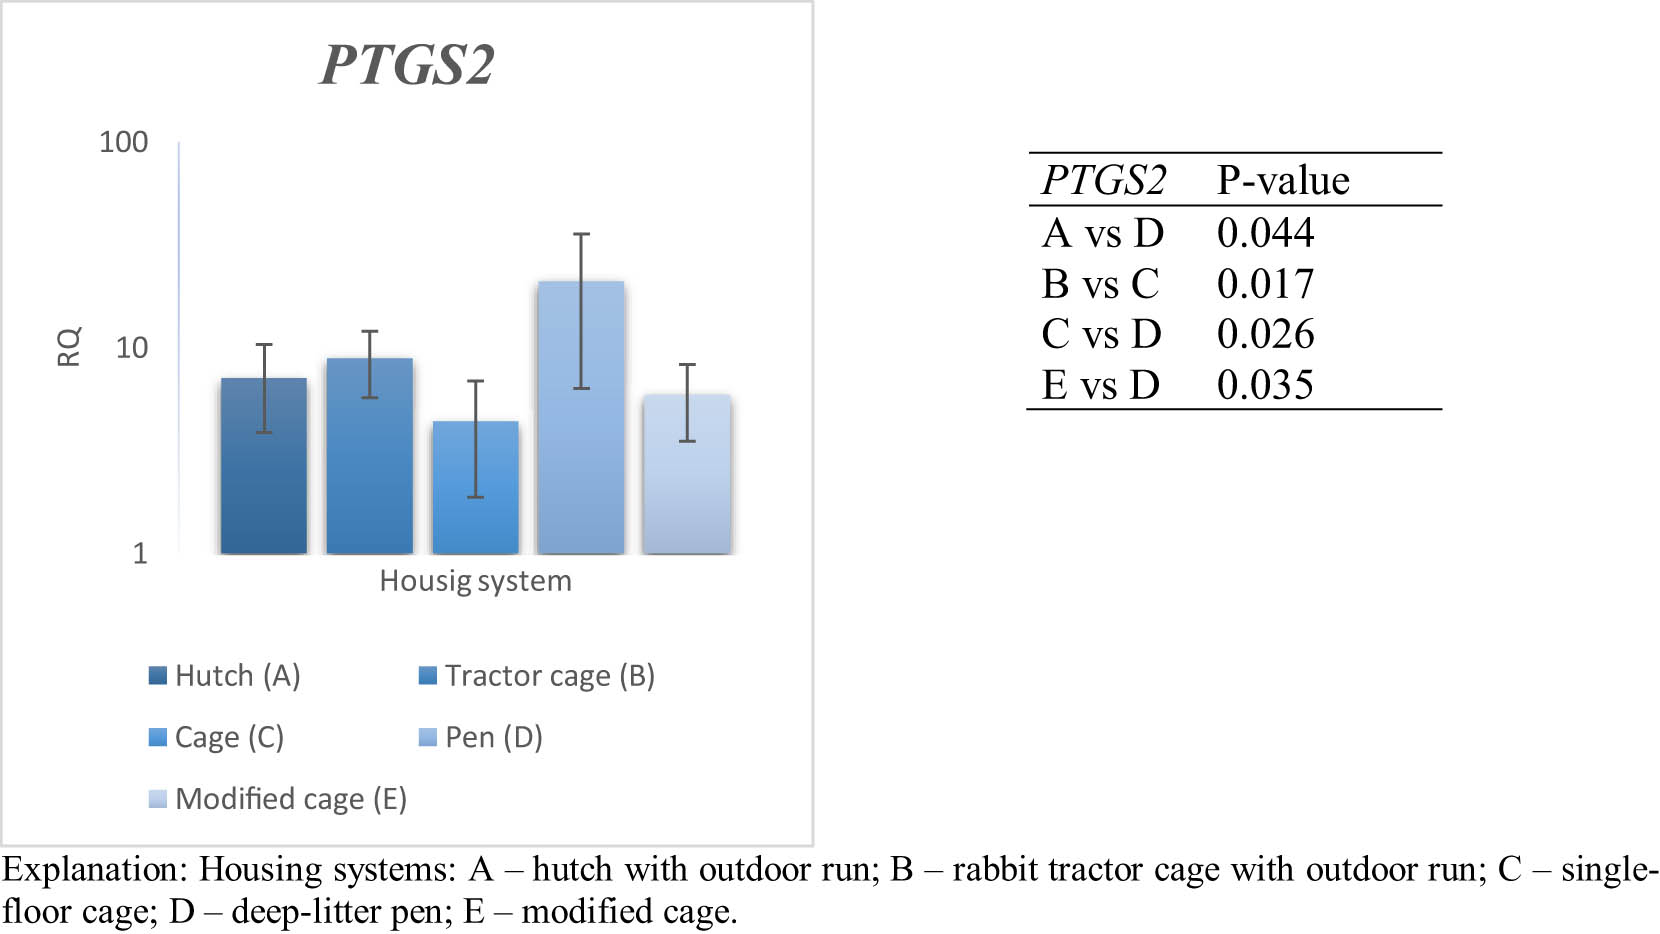
Figure 6
Effect of housing system on the relative expression of the PTGS2 gene in the blood of PW rabbits (n = 8 rabbits per housing system; mean values ± SD) (RQ – relative quantity normalised to ACTB and B2M).
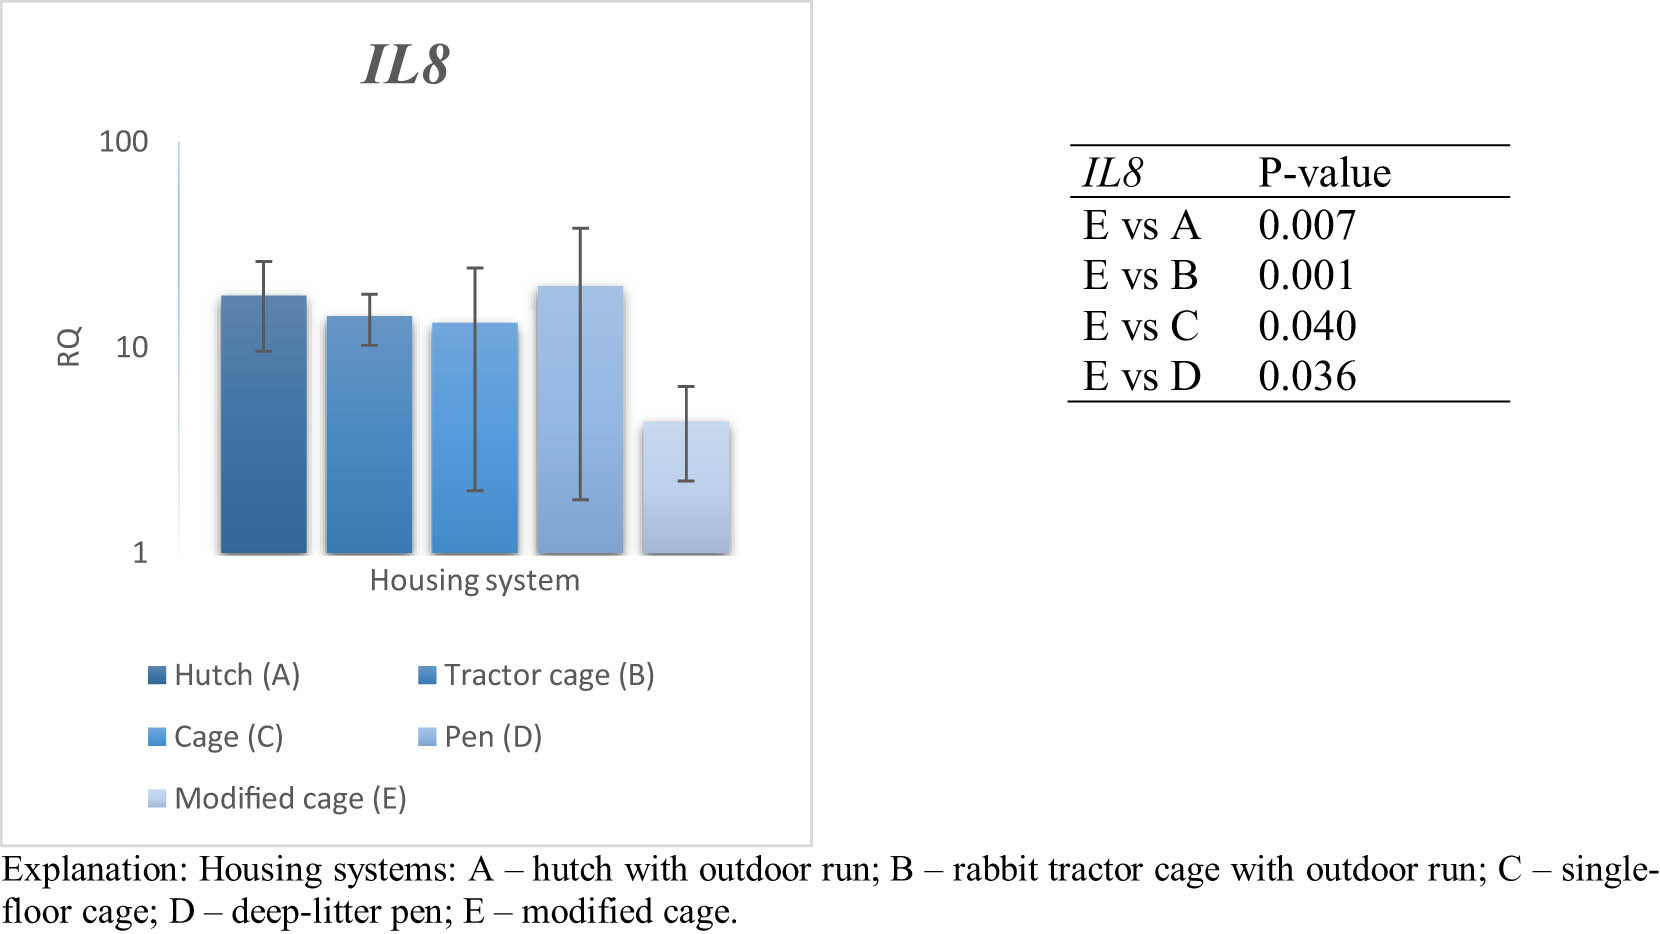
Figure 7
Effect of housing system on the relative expression of the IL8 gene in the blood of PW rabbits (n = 8 rabbits per housing system; mean values ± SD) (RQ – relative quantity normalised to ACTB and B2M).
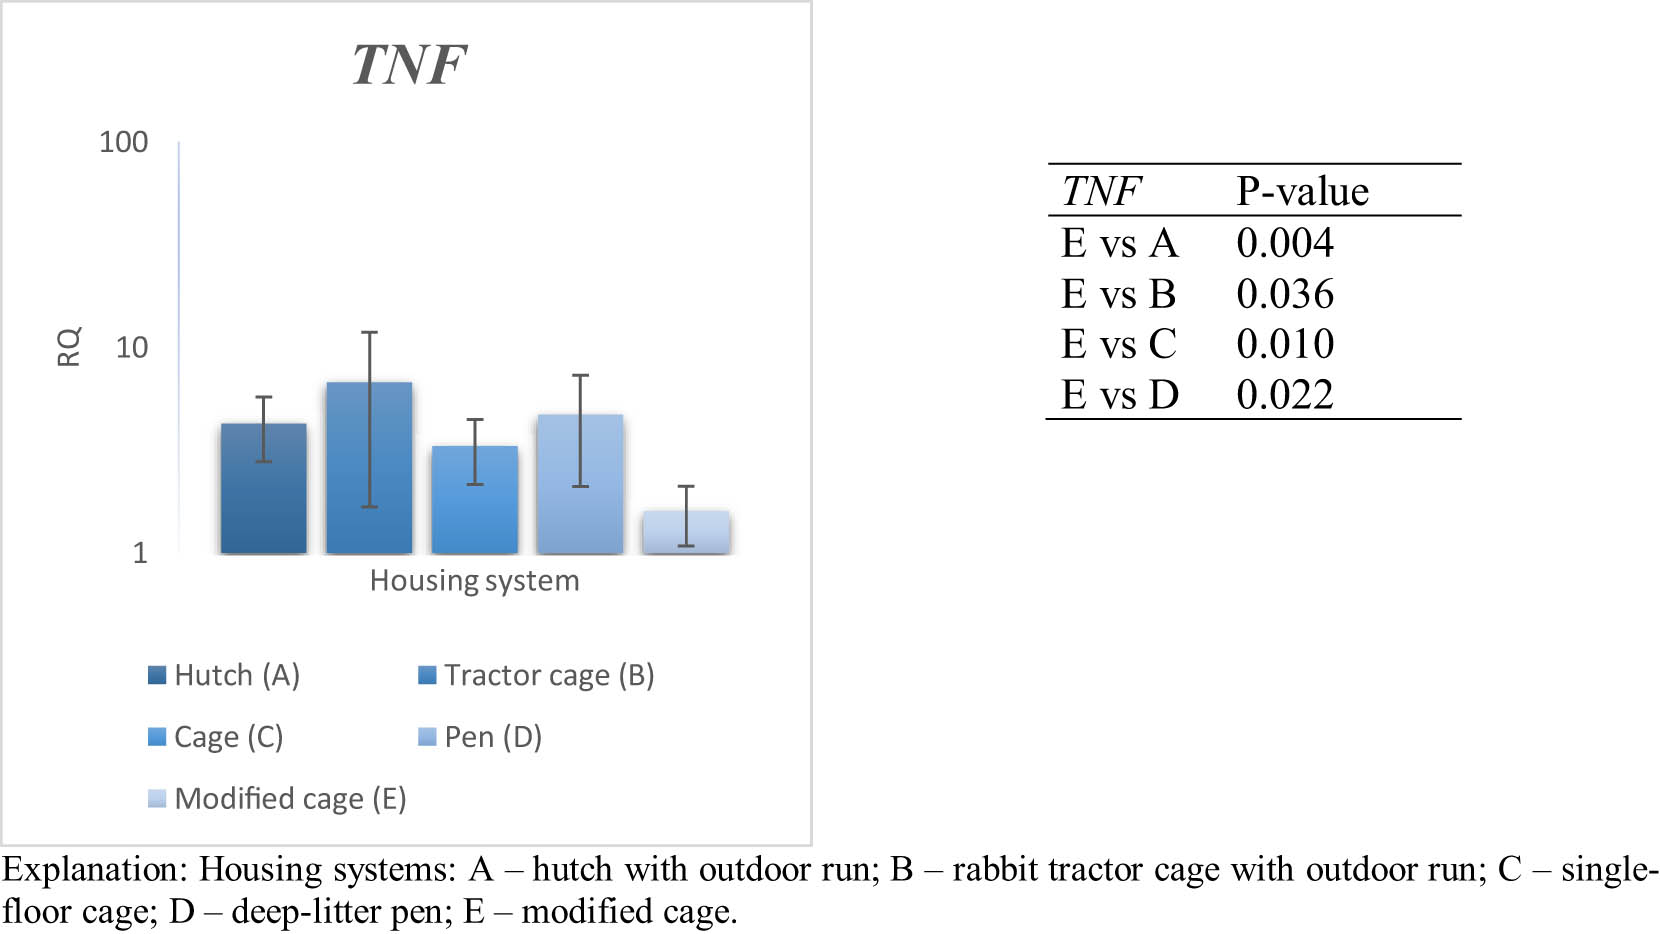
Figure 8
Effect of housing system on the relative expression of the TNF gene in the blood of PW rabbits (n = 8 rabbits per housing system; mean values ± SD) (RQ – relative quantity normalised to ACTB and B2M).
Table 3
Effect of housing system on gene expression after Benjamini–Hochberg FDR correction applied separately within each tissue (n = 8 rabbits per housing system)
| Tissue | Gene | Raw P-value | FDR-adjusted p-value | Significant after FDR (q ≤ 0.05) |
|---|---|---|---|---|
| Blood | IL6 | 0.011 | 0.021 | Yes |
| Blood | CXCR1 | <0.001 | <0.001 | Yes |
| Blood | IL10 | 0.001 | 0.001 | Yes |
| Blood | TGFB1 | 0.108 | 0.144 | No |
| Blood | IL1B | 0.746 | 0.746 | No |
| Blood | PTGS2 | 0.007 | 0.019 | Yes |
| Blood | IL8 | 0.191 | 0.218 | No |
| Blood | TNF | 0.071 | 0.114 | No |
| Spleen | IL6 | 0.096 | 0.192 | No |
| Spleen | TGFB1 | 0.372 | 0.372 | No |
| Spleen | IL1B | 0.261 | 0.372 | No |
| Spleen | PTGS2 | 0.012 | 0.050 | Yes |
| Spleen | IL8 | 0.260 | 0.372 | No |
| Spleen | TNF | 0.012 | 0.050 | Yes |
| Spleen | CXCR1 | 0.296 | 0.372 | No |
| Spleen | IL10 | 0.023 | 0.062 | No |
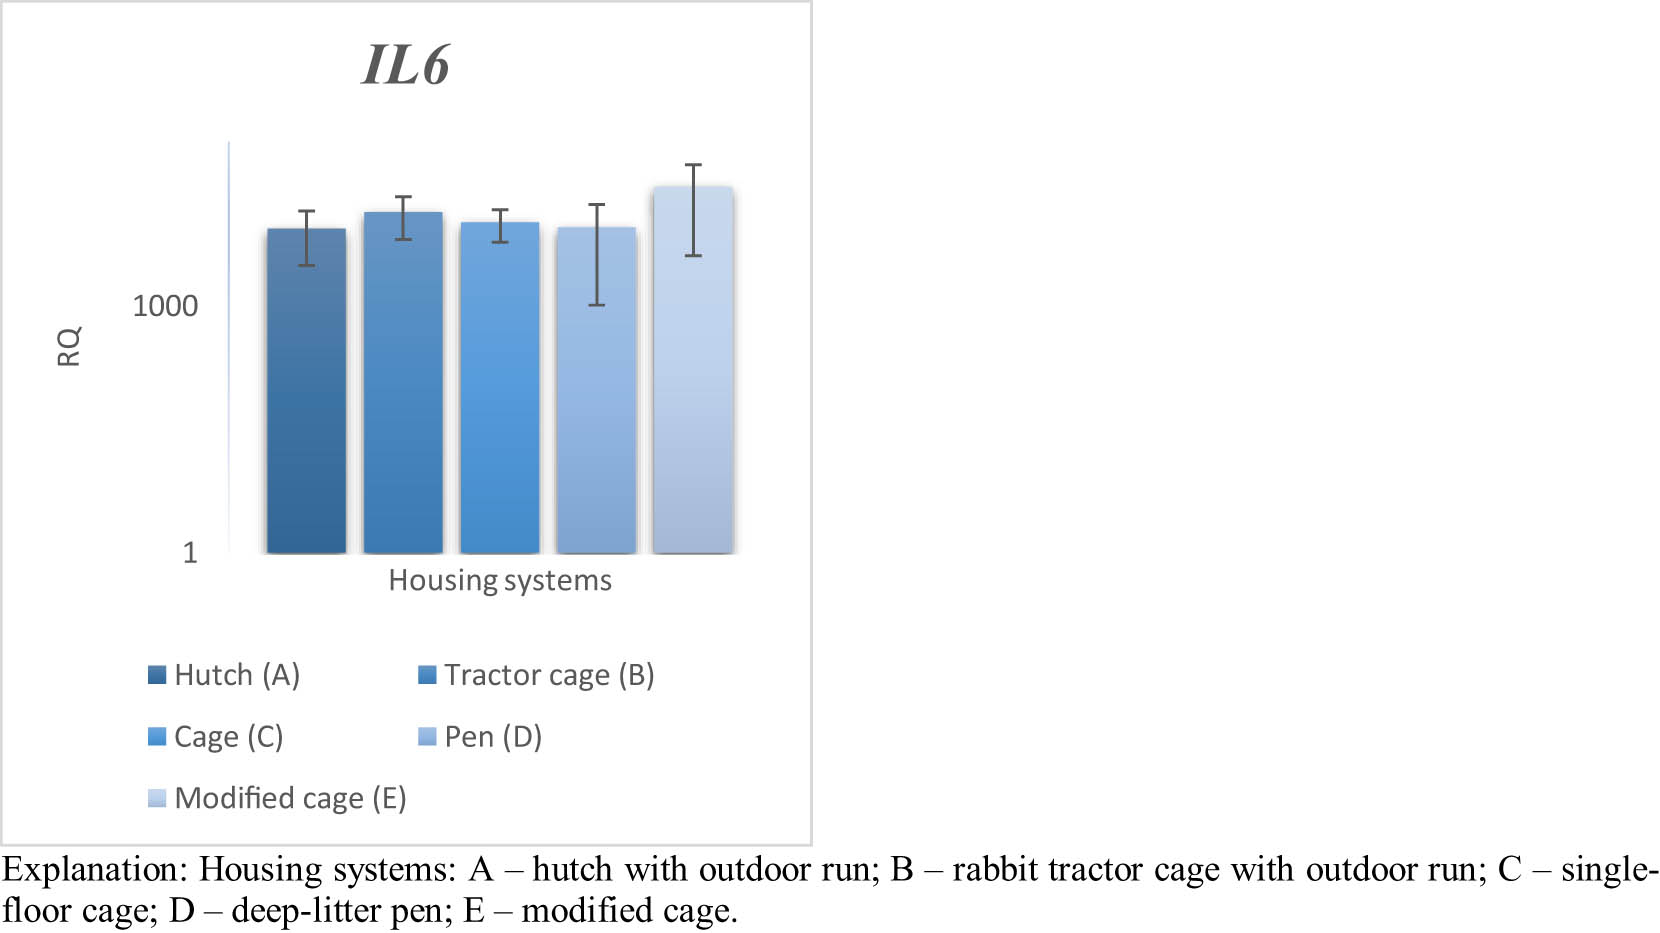
Figure 9
Effect of housing system on the relative expression of the IL6 gene in the spleen of PW rabbits (n = 8 rabbits per housing system; mean values ± SD) (RQ – relative quantity normalised to ACTB and B2M).
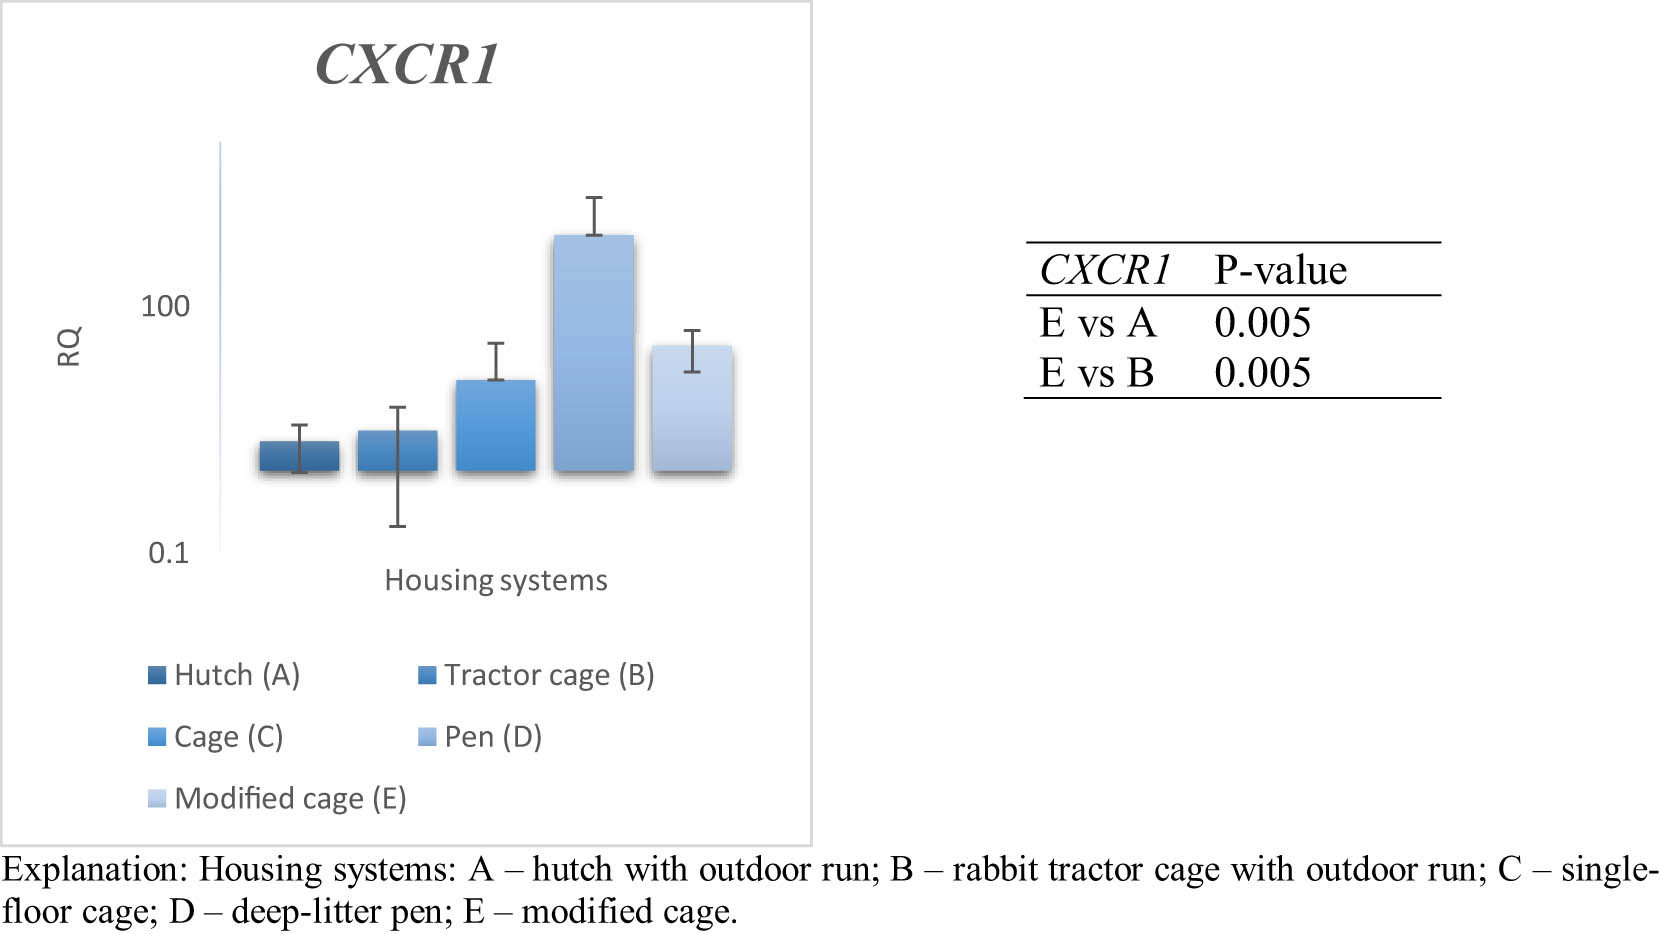
Figure 10
Effect of housing system on the relative expression of the CXCR1 gene in the spleen of PW rabbits (n = 8 rabbits per housing system; mean values ± SD) (RQ – relative quantity normalised to ACTB and B2M).
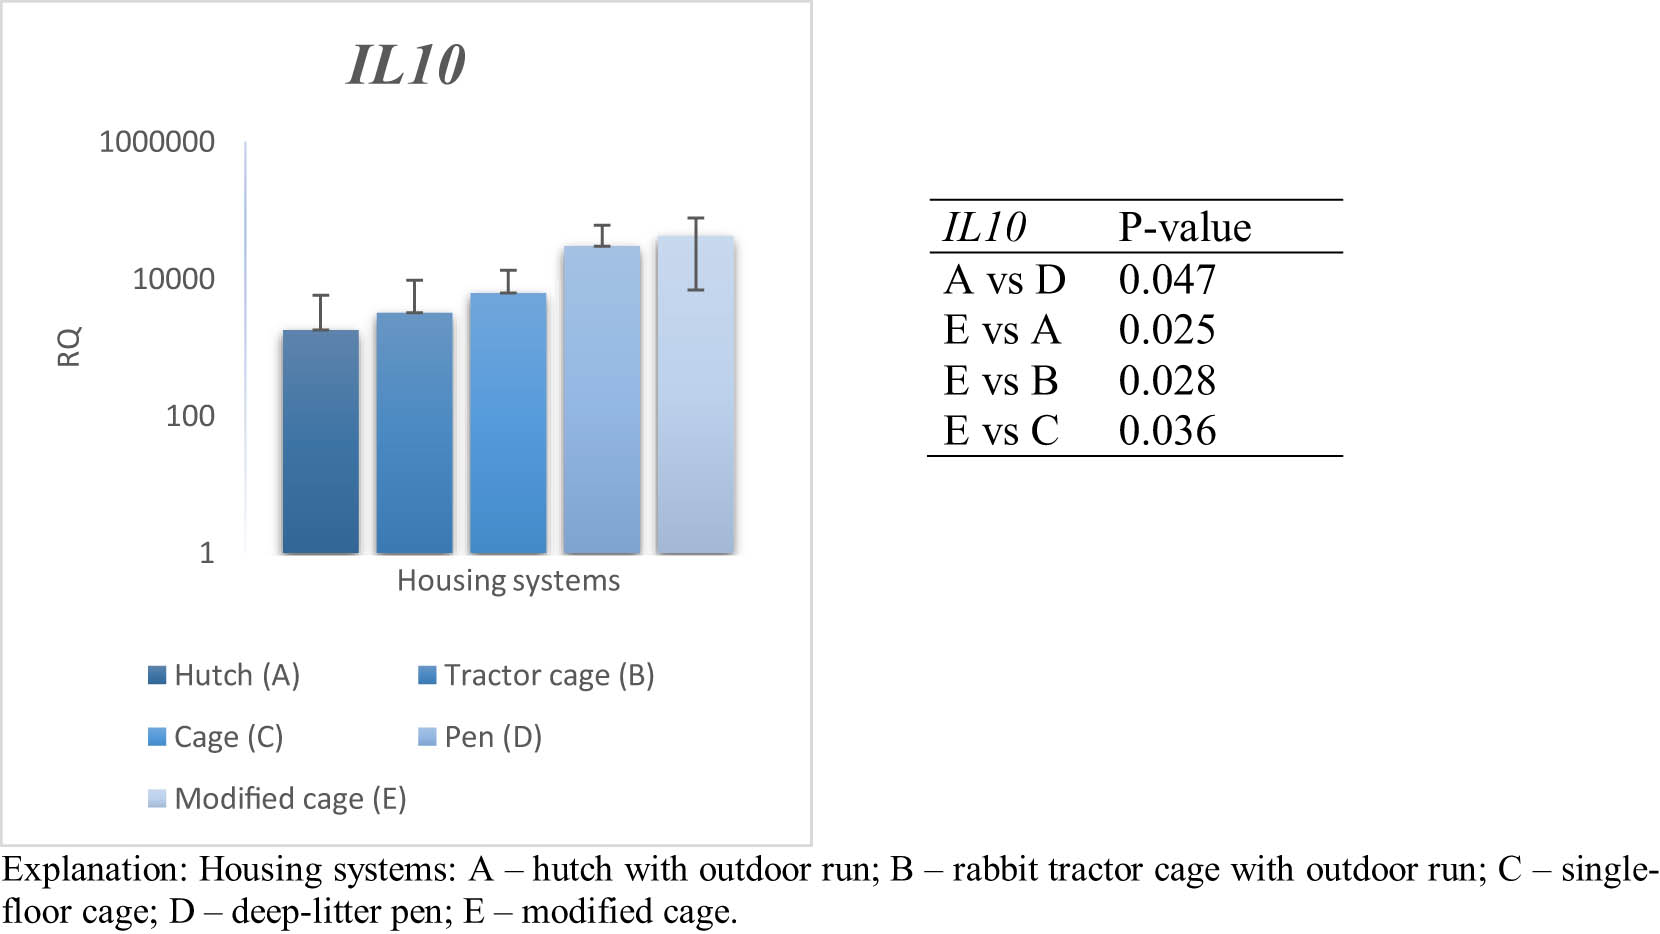
Figure 11
Effect of housing system on the relative expression of the IL10 gene in the spleen of PW rabbits (n = 8 rabbits per housing system; mean values ± SD) (RQ – relative quantity normalised to ACTB and B2M).
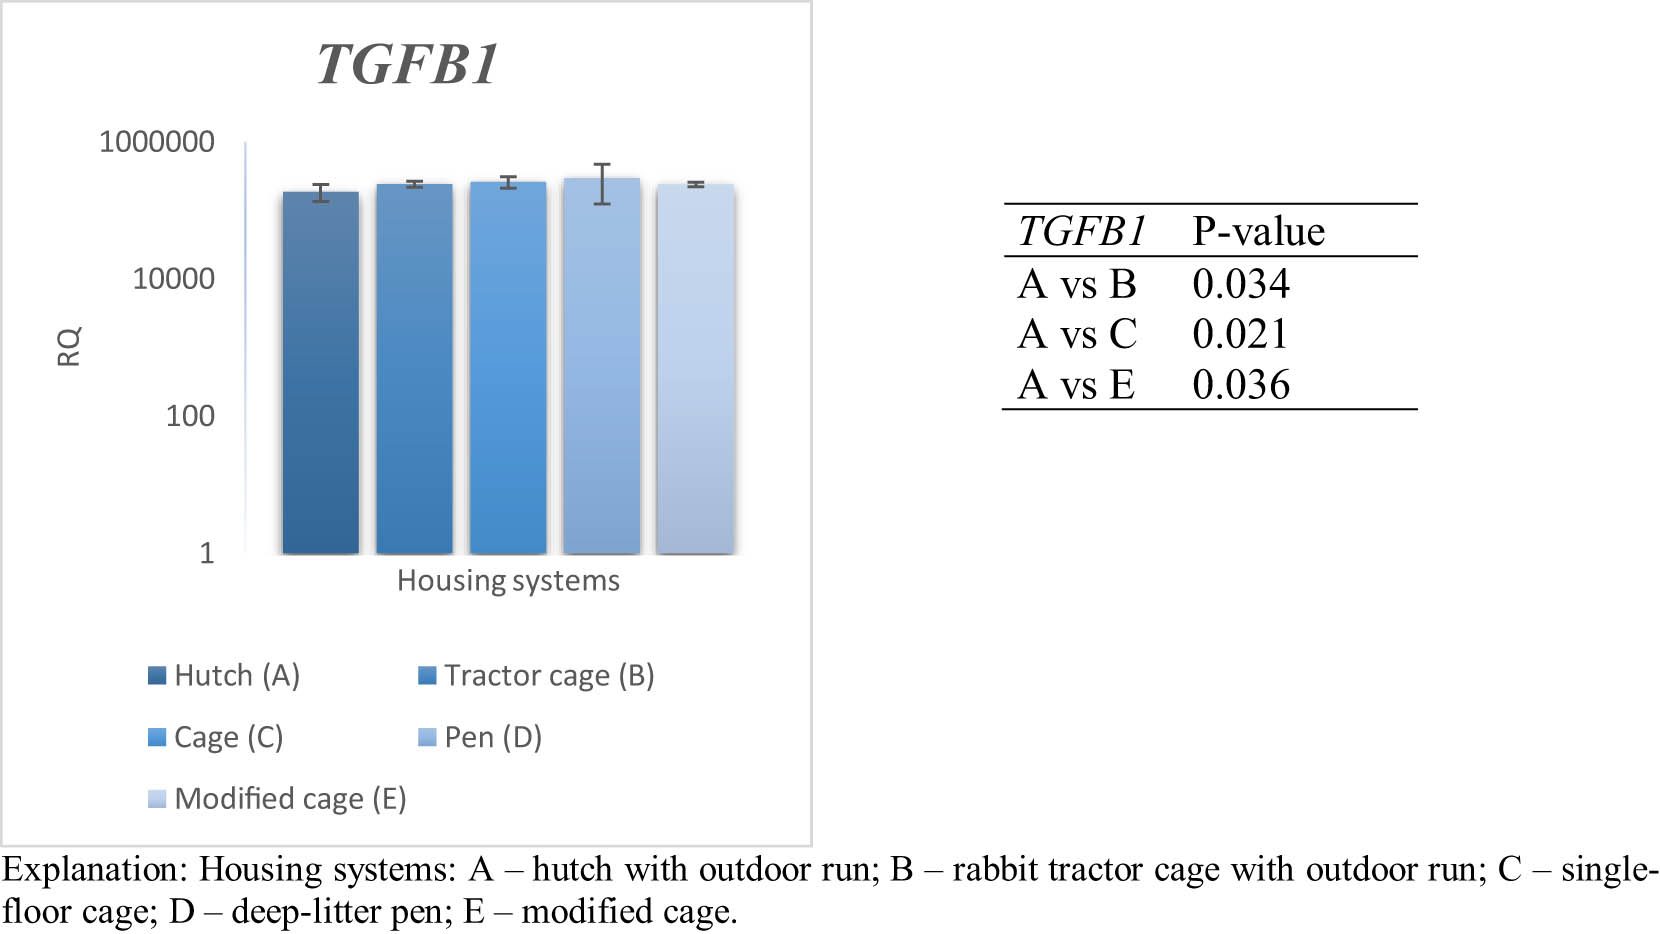
Figure 12
Effect of housing system on the relative expression of the TGFB1 gene in the spleen of PW rabbits (n = 8 rabbits per housing system; mean values ± SD) (RQ – relative quantity normalised to ACTB and B2M).
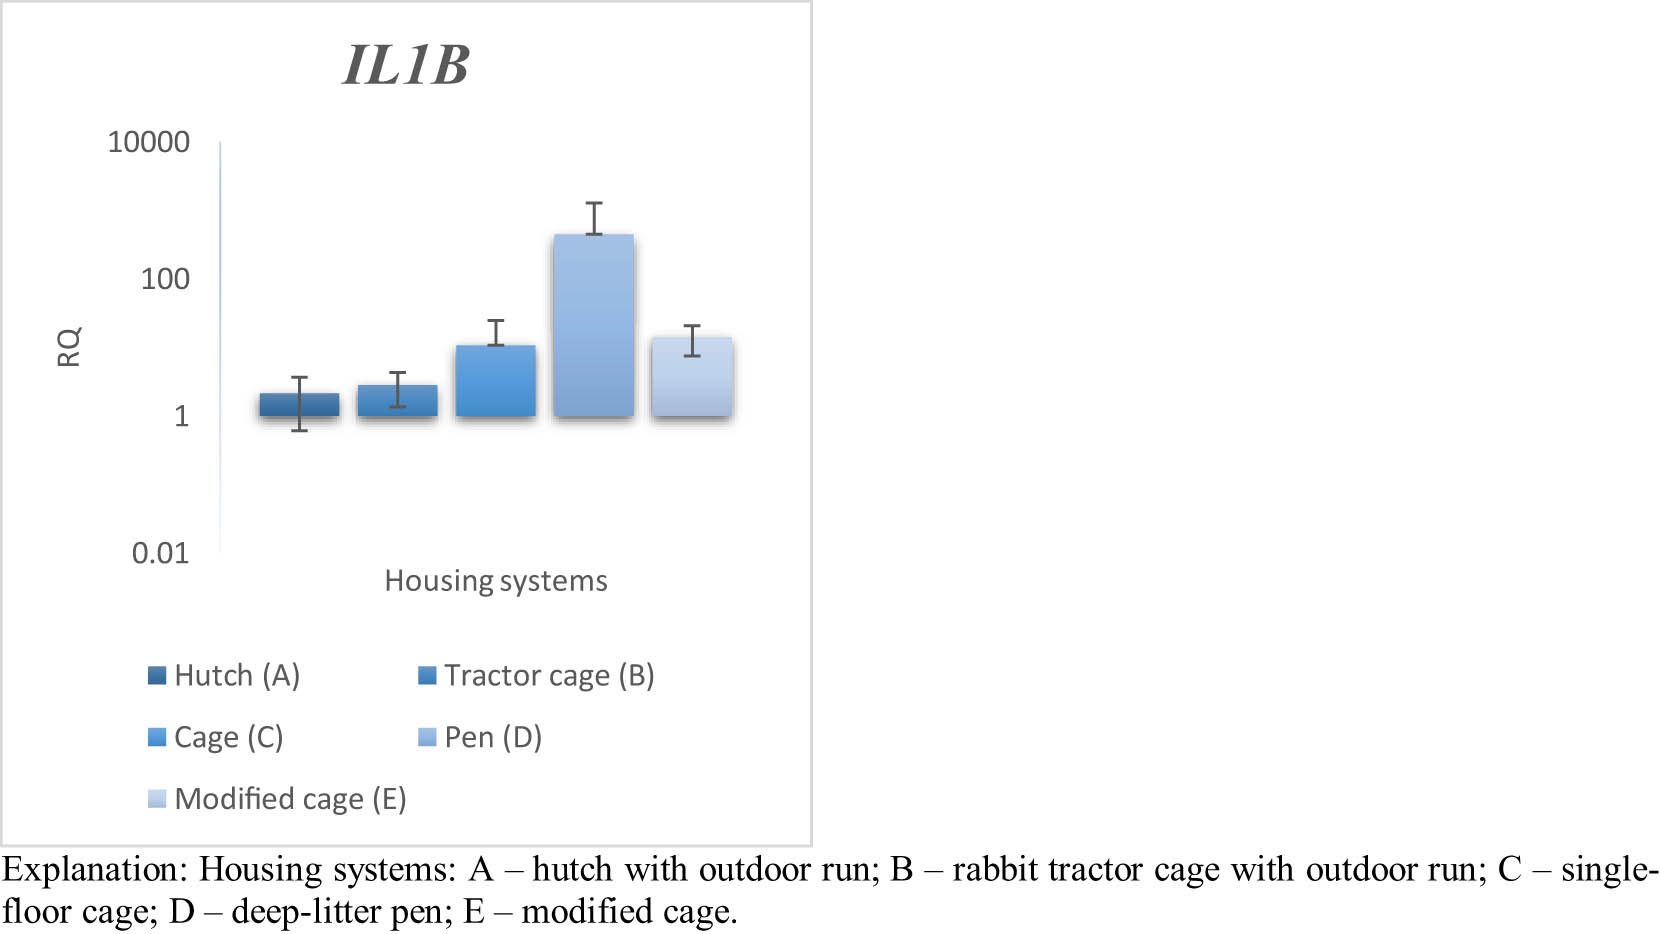
Figure 13
Effect of housing system on the relative expression of the IL1B gene in the spleen of PW rabbits (n = 8 rabbits per housing system; mean values ± SD) (RQ – relative quantity normalised to ACTB and B2M).
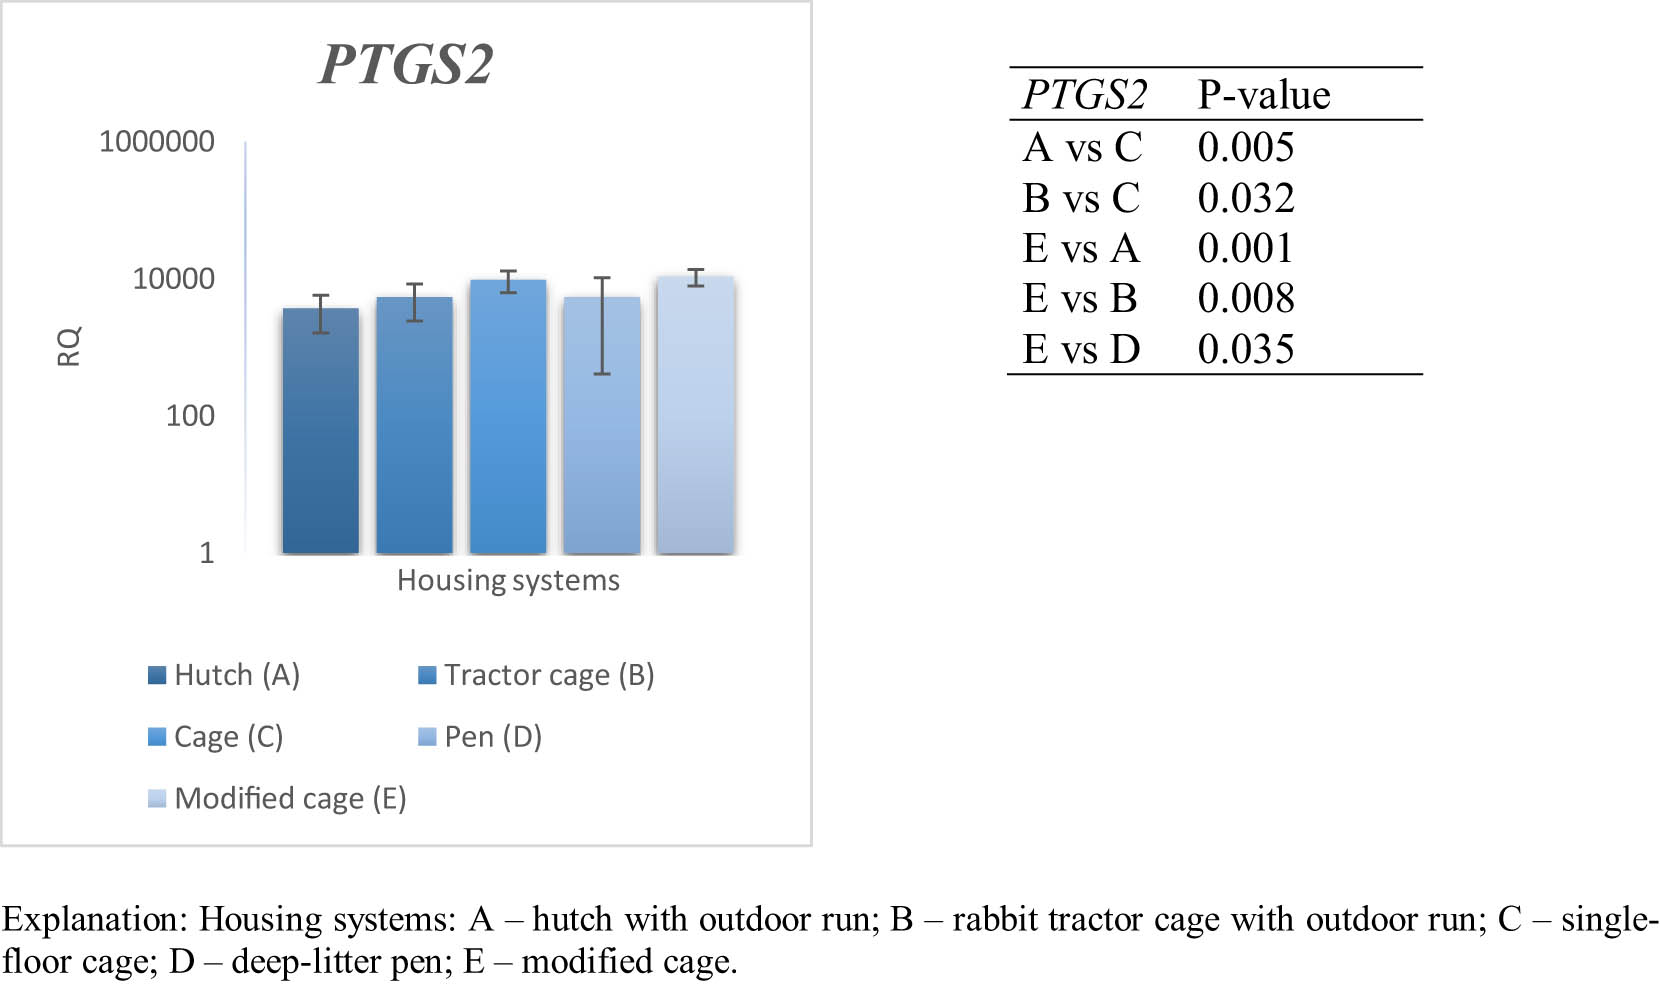
Figure 14
Effect of housing system on the relative expression of the PTGS2 gene in the spleen of PW rabbits (n = 8 rabbits per housing system; mean values ± SD) (RQ – relative quantity normalised to ACTB and B2M).
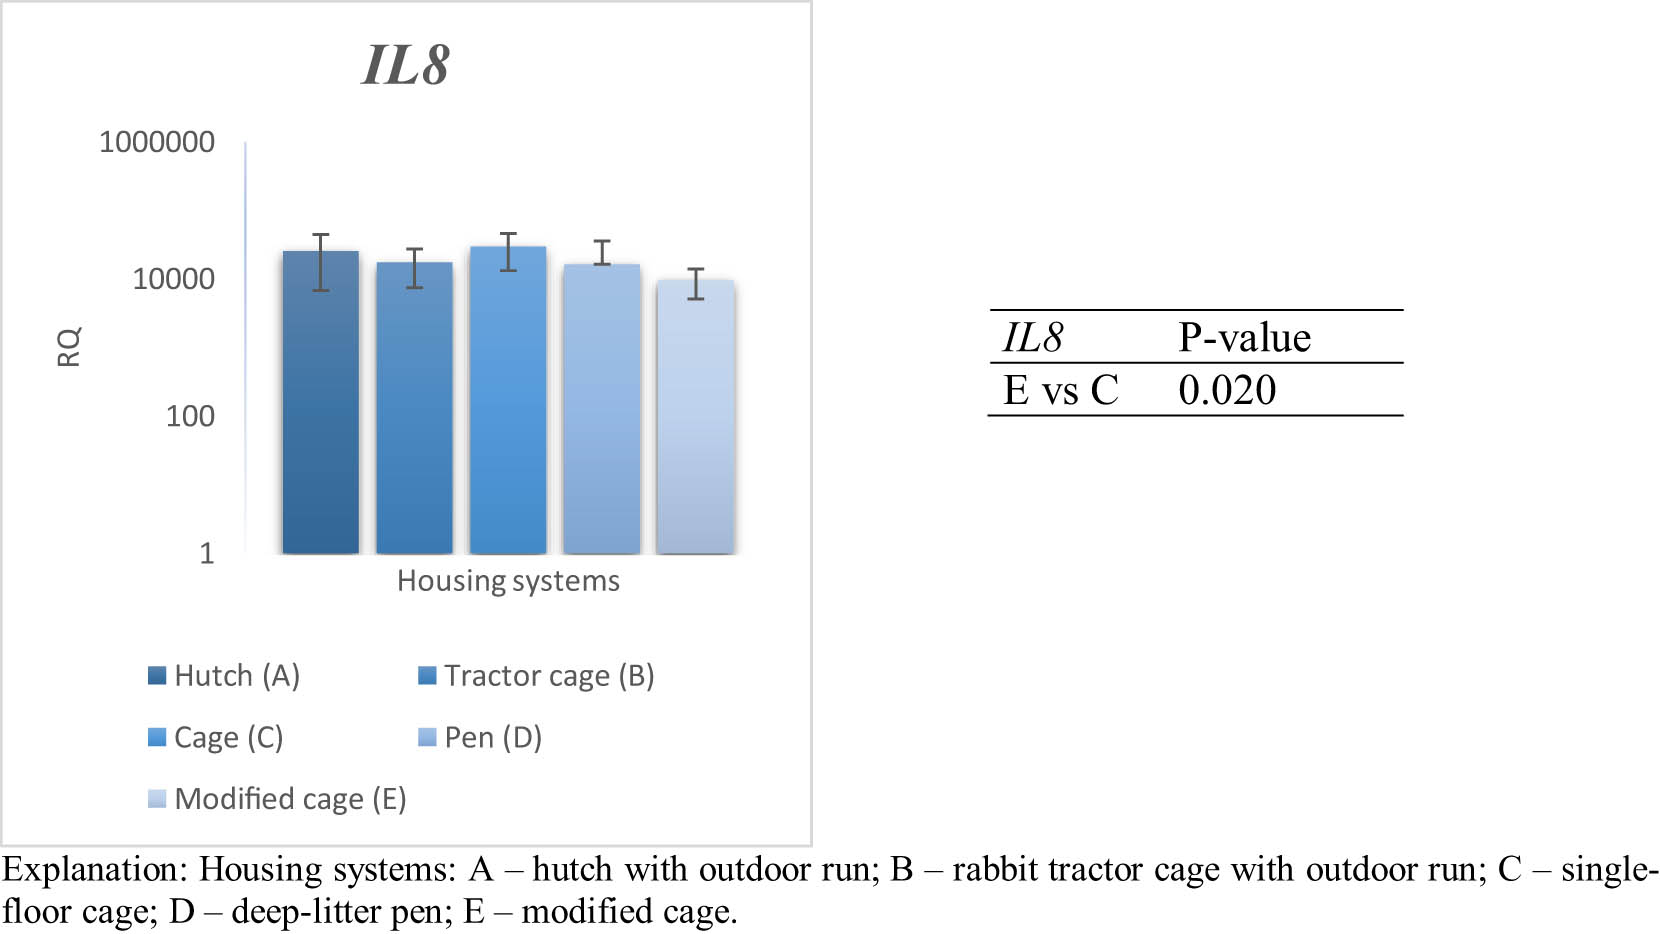
Figure 15
Effect of housing system on the relative expression of the IL8 gene in the spleen of PW rabbits (n = 8 rabbits per housing system; mean values ± SD) (RQ – relative quantity normalised to ACTB and B2M).
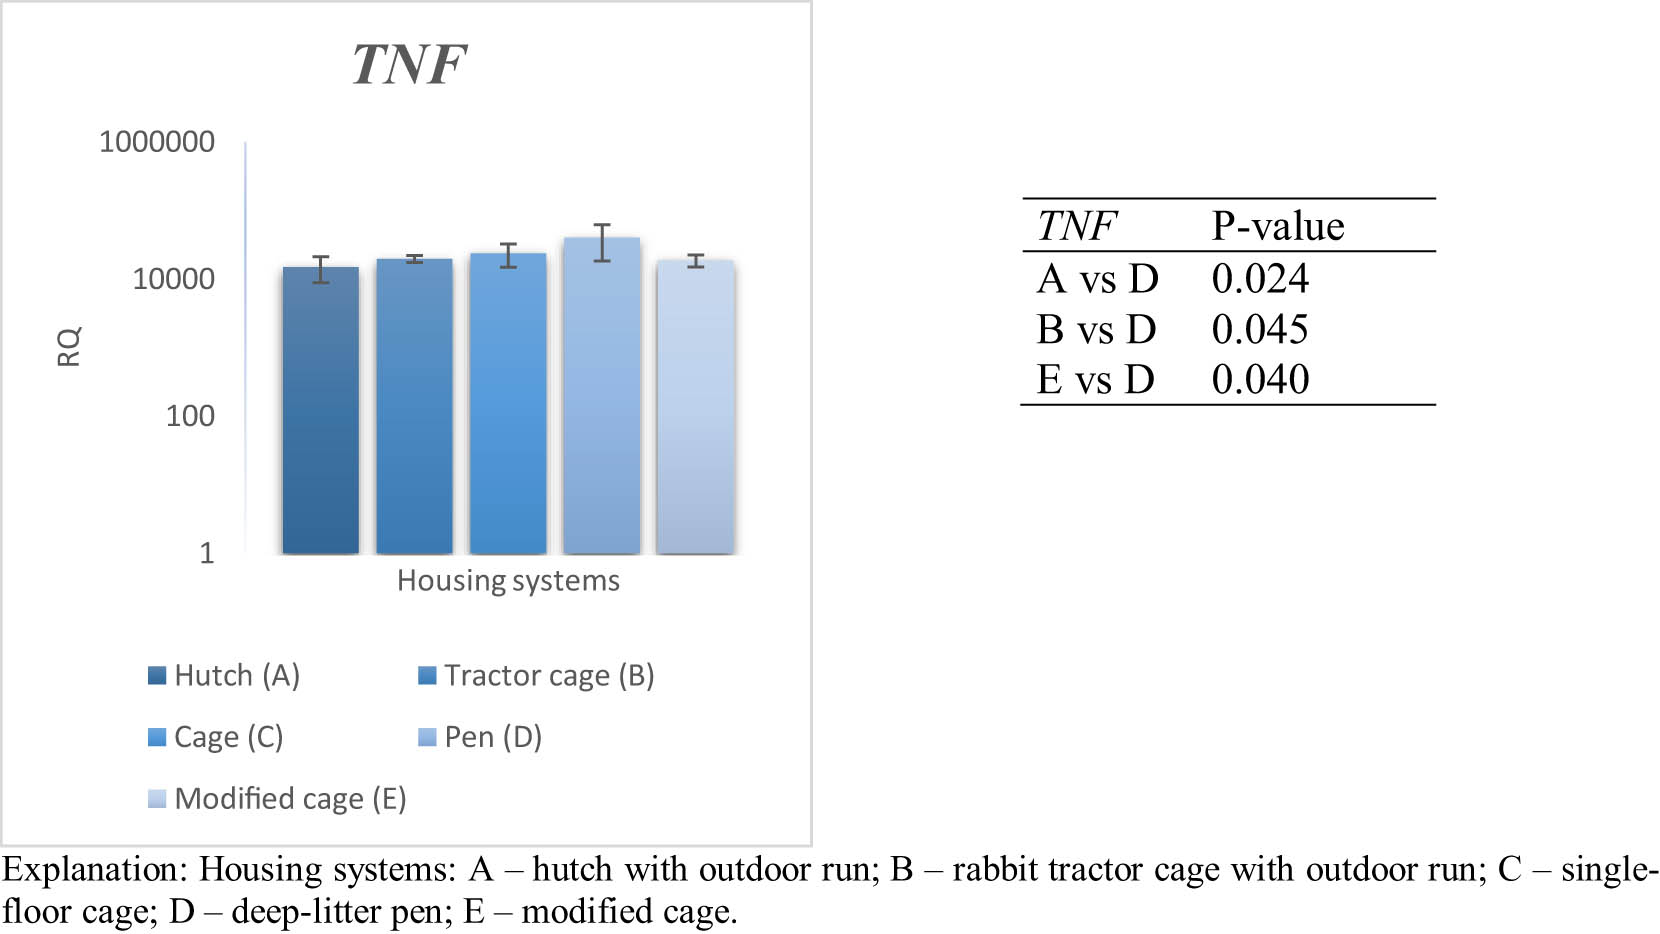
Figure 16
Effect of housing system on the relative expression of the TNF gene in the spleen of PW rabbits (n = 8 rabbits per housing system; mean values ± SD) (RQ – relative quantity normalised to ACTB and B2M).