
Table 1
Ingredient composition and calculated nutrient contents of the experimental diets containing 0 or 15% CM
| Composition | Starter feed (day old chick to 4 weeks) | Grower and finisher feed (5–16 weeks) | ||
|---|---|---|---|---|
| Ingredient | 0% CM | 15% CM | 0% CM | 15% CM |
| Corn (%) | 62.05 | 64.35 | 57.73 | 63.54 |
| Soybean meal (%) | 30.70 | 17.22 | 26.06 | 12.00 |
| House cricket meal (%) | 0.00 | 15.00 | 0.00 | 15.00 |
| Palm oil (%) | 3.92 | 0.00 | 5.15 | 0.00 |
| Cellulose (%) | 0.00 | 0.00 | 7.96 | 6.24 |
| Limestone (%) | 1.33 | 1.35 | 1.45 | 1.52 |
| Dicalcium phosphate (%) | 0.71 | 0.75 | 0.38 | 0.37 |
| Vitamin–Mineral (%) | ||||
| Premix1 (%) | 0.25 | 0.25 | 0.25 | 0.25 |
| L-Lysine (%) | 0.25 | 0.29 | 0.23 | 0.29 |
| Sodium chloride (%) | 0.24 | 0.24 | 0.24 | 0.24 |
| DL-Methionine (%) | 0.21 | 0.20 | 0.21 | 0.20 |
| Sodium bicarbonate (%) | 0.20 | 0.20 | 0.20 | 0.20 |
| L-Threonine (%) | 0.07 | 0.08 | 0.07 | 0.08 |
| Choline chloride (%) | 0.07 | 0.07 | 0.07 | 0.07 |
| Chemical composition | ||||
| ME (kcal/kg) | 3112.00 | 3112.00 | 2970.00 | 2970.00 |
| Crude protein (%) | 19.50 | 19.50 | 17.00 | 17.00 |
| Crude fat (%) | 6.51 | 6.23 | 7.51 | 6.12 |
| Crude fiber (%) | 3.18 | 4.74 | 10.40 | 10.40 |
| Calcium (%) | 0.90 | 0.90 | 0.81 | 0.80 |
| Available phosphorus (%) | 0.45 | 0.45 | 0.32 | 0.32 |
| Lysine (%) | 1.20 | 1.19 | 1.04 | 1.04 |
| Methionine (%) | 0.51 | 0.50 | 0.47 | 0.47 |
| Methionine + Cysteine (%) | 0.84 | 0.89 | 0.76 | 0.75 |
| Threonine (%) | 0.80 | 0.80 | 0.70 | 0.70 |
| Arginine (%) | 1.29 | 1.21 | 1.11 | 1.03 |
| Tyrosine (%) | 0.61 | 0.71 | 0.53 | 0.62 |
| Tryptophan (%) | 0.24 | 0.19 | 0.21 | 0.16 |
[i] 1Vitamin–mineral premix (Feed Specialties Co., Ltd, Pathum Thani, Thailand) supplied per kg of diet: vitamin A, 2,500,000 IU; vitamin D3, 1,000,000 IU; vitamin E, 7,000 IU; vitamin K, 700 mg; vitamin B1, 400 mg; vitamin B2, 800 mg; vitamin B6, 400 mg; vitamin B12, 4 mg; biotin, 30 mg; pantothenic acid, 3,111 mg; folic acid, 100 mg; vitamin C, 15,000 mg; niacin (vitamin B3), 5,600 mg; Zn, 10,500 mg; Fe, 10,920 mg; Mn, 9,960 mg; Cu, 3,850 mg; I, 137 mg; and Se, 70 mg. Diets were formulated to be iso-nitrogenous and iso-energetic within each feeding phase, with CM partially replacing soybean meal in the cricket meal treatment. Nutrient values are calculated compositions. ME = metabolizable energy.
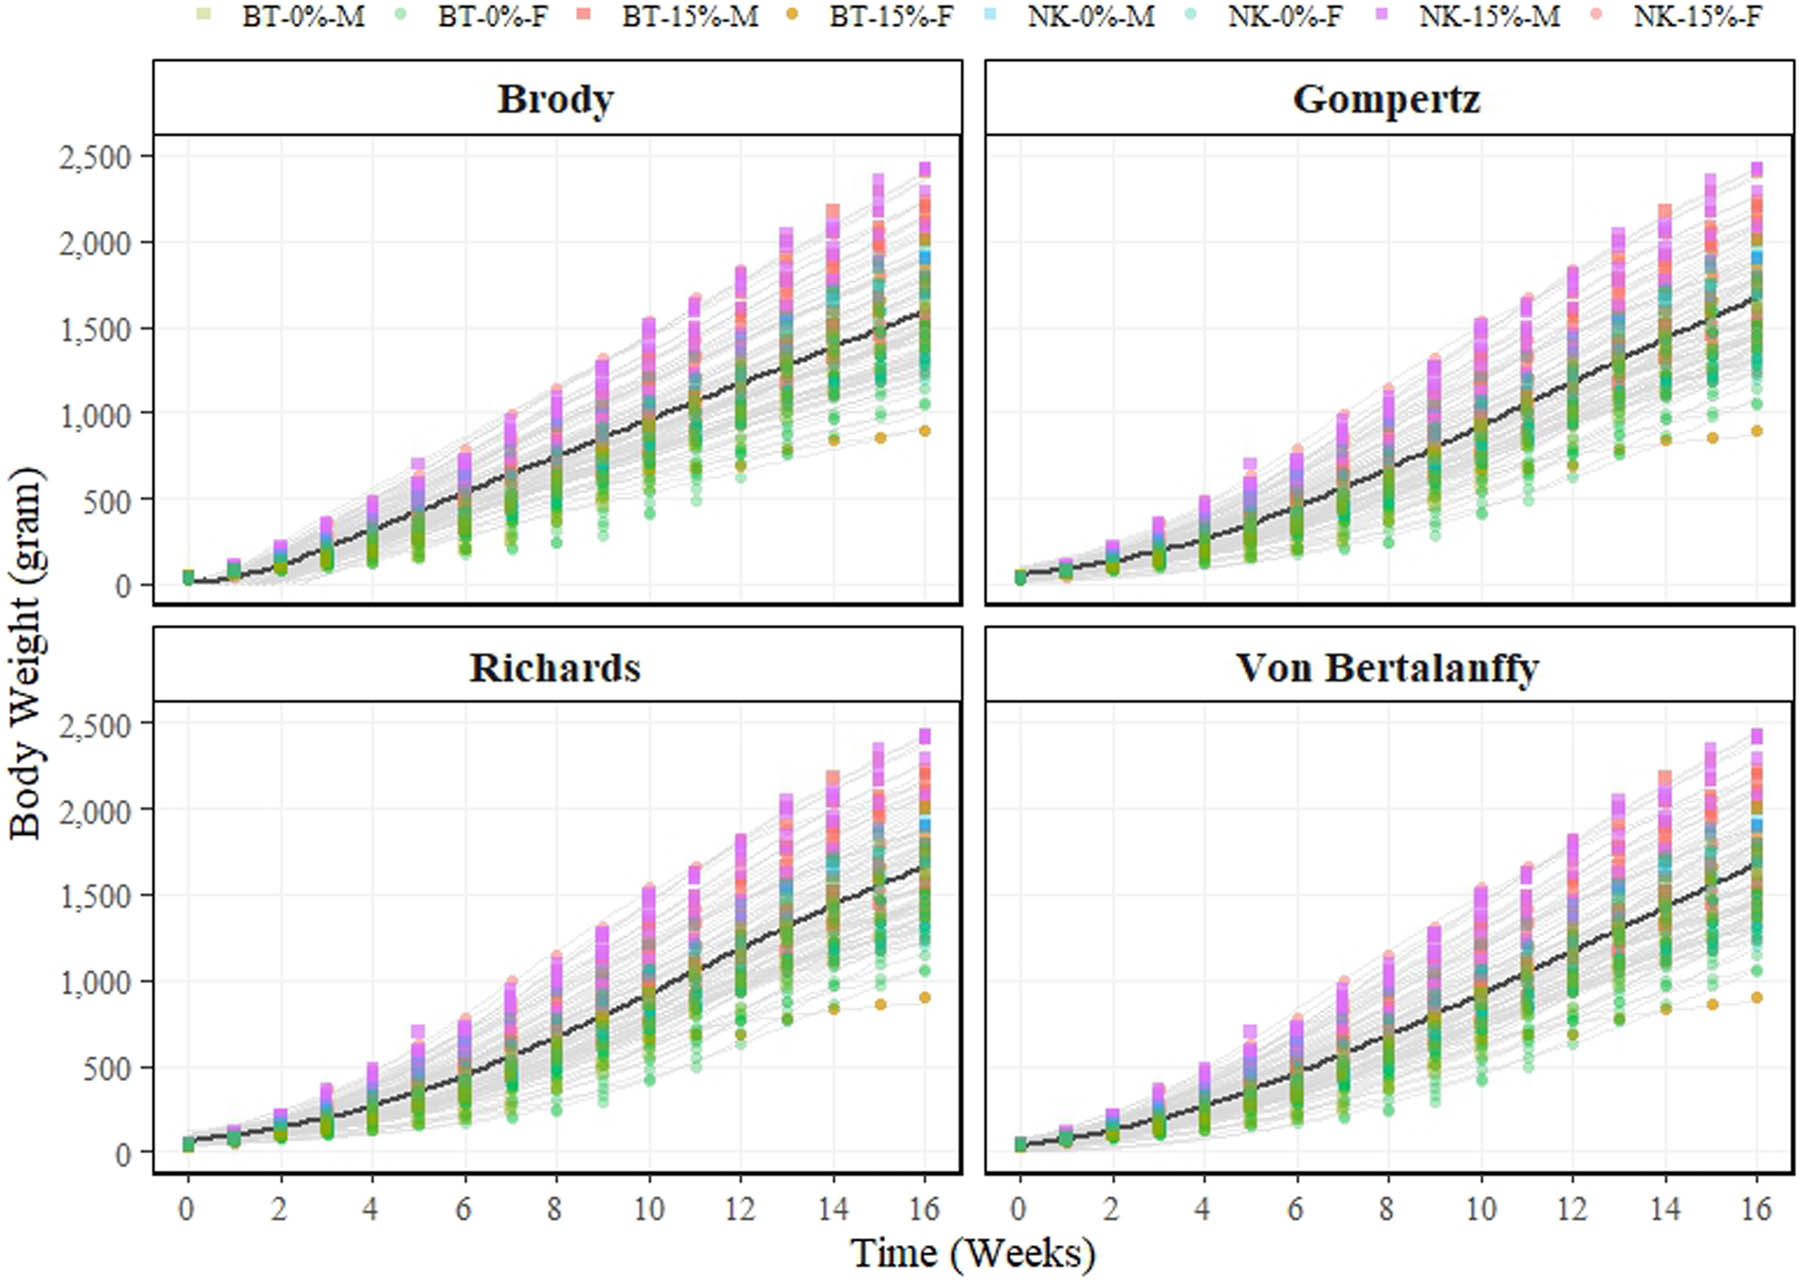
Figure 1
Observed BW trajectories and fitted growth curves of Thai indigenous chickens under four nonlinear growth models. Symbols represent observed BW measurements from hatch to 16 weeks of age. Grey lines represent individual fitted trajectories, and the bold line indicates the mean fitted trajectory. BT = Betong; NK = Nin Kaset; 0% CM = diet containing 0% Acheta domesticus meal or control diet; 15% CM = diet containing 15% Acheta domesticus meal; M = male; F = female.
Table 2
Goodness-of-fit statistics (mean value ± SD) and frequency of individual best fits among all birds (n = 151) for four nonlinear growth models fitted to BW trajectories of Thai indigenous chickens
| Parameter | Model | |||
|---|---|---|---|---|
| Brody | Gompertz | Richards | Von Bertalanffy | |
| R 2 | 0.972 ± 0.03 | 0.996 ± 0.01 | 0.997 ± 0.01 | 0.996 ± 0.01 |
| Best-fit proportion (R 2) | 5.3% (8/151) | 11.92% (18/151) | 37.09% (56/151) | 45.70% (69/151) |
| Adj-R 2 | 0.961 ± 0.04 | 0.994 ± 0.01 | 0.995 ± 0.01 | 0.993 ± 0.01 |
| Best-fit proportion (Adj-R 2) | 4.64% (7/151) | 23.18% (35/151) | 26.49% (40/151) | 45.70% (69/151) |
| AIC | 164.98 ± 49.06 | 134.38 ± 37.46 | 134.04 ± 36.33 | 134.66 ± 38.19 |
| Best-fit proportion (AIC) | 5.3% (8/151) | 26.49% (40/151) | 22.52% (34/151) | 45.70% (69/151) |
| BIC | 167.55 ± 50.12 | 136.96 ± 38.52 | 137.26 ± 37.65 | 137.23 ± 39.24 |
| Best-fit proportion (BIC) | 5.3% (8/151) | 27.15% (41/151) | 21.85% (33/151) | 45.70% (69/151) |
Goodness-of-fit statistics are presented as mean value ± SD for birds with converged and biologically plausible parameter estimates (n = 108). Best-fit proportions (% [n]) were calculated using all birds included in the initial model-comparison procedure (n = 151). The Brody, Gompertz, Richards, and Von Bertalanffy models were fitted separately to individual BW trajectories. R 2 = coefficient of determination; Adj-R 2 = adjusted coefficient of determination; AIC = Akaike information criterion; BIC = Bayesian information criterion.
Table 3
Type III tests of fixed effects for VB growth-curve parameters (A, B, and k) in Thai indigenous chickens
| Effect | A(g) | B | k | ||||||
|---|---|---|---|---|---|---|---|---|---|
| Den DF | F-value | P-value | Den DF | F-value | P-value | Den DF | F-value | P-value | |
| Breed | 100 | 1.97 | 0.1635 | 14.5 | 0.30 | 0.5919 | 100 | 6.37 | 0.0132 |
| Feed | 100 | 7.30 | 0.0081 | 14.5 | 5.16 | 0.0389 | 100 | 10.02 | 0.0020 |
| Sex | 100 | 28.28 | < 0.0001 | 99.8 | 13.55 | 0.0004 | 100 | 2.42 | 0.1229 |
| Breed × Feed | 100 | 0.03 | 0.8631 | 14.5 | 0.89 | 0.3611 | 100 | 0.05 | 0.8224 |
| Breed × Sex | 100 | 0.00 | 0.9609 | 99.8 | 0.04 | 0.8453 | 100 | 0.14 | 0.7074 |
| Feed × Sex | 100 | 0.03 | 0.8642 | 99.8 | 0.98 | 0.3254 | 100 | 0.52 | 0.4734 |
| Breed × Feed × Sex | 100 | 0.62 | 0.4323 | 99.8 | 0.00 | 0.9900 | 100 | 0.04 | 0.8364 |
Num DF = numerator degrees of freedom; Den DF = denominator degrees of freedom. VB growth-curve parameters were analyzed as dependent variables, where A = asymptotic parameter (g), B = integration constant, and k = growth-rate parameter (week−1). Fixed effects included breed (BT and NK), feed (0% CM and 15% CM), sex (male and female), and their interactions. Parameters were analyzed using a linear mixed-effects model with pen fitted as a random effect. Reported statistics include Den DF, F-values, and P-values from Type III tests of fixed effects. Denominator degrees of freedom were estimated using the Kenward–Roger approximation.
Table 4
LSMeans (± SE) of VB growth-curve parameters (A, B, and k) according to feed, breed, and sex
| Main effect | A (g) | B | k | |
|---|---|---|---|---|
| Breed | BT | 4040.25 ± 228.59 | 0.7777 ± 0.01176 | 0.07354 ± 0.005599b |
| NK | 3607.93 ± 206.43 | 0.7689 ± 0.01093 | 0.09257 ± 0.005056a | |
| P-value | 0.1635 | 0.5919 | 0.0132 | |
| Feed | 0% CM | 4240.29 ± 258.10a | 0.7915 ± 0.01281a | 0.07111 ± 0.006321b |
| 15% CM | 3407.89 ± 168.08b | 0.7550 ± 0.009679b | 0.09500 ± 0.004117a | |
| P-value | 0.0081 | 0.0389 | 0.0020 | |
| Sex | M | 4643.12 ± 271.59a | 0.7976 ± 0.01242a | 0.07719 ± 0.006652 |
| F | 3005.06 ± 145.27b | 0.7489 ± 0.007893b | 0.08892 ± 0.003558 | |
| P-value | <0.0001 | 0.0004 | 0.1229 | |
A = asymptotic parameter (g); B = integration constant; k = growth-rate parameter (week−1). LSMeans ± SE were estimated from the mixed model described in Table 3. BT = Betong; NK = Nin Kaset; 0% CM = diet containing 0% Acheta domesticus meal or control diet; 15% = diet containing 15% CM; M = male; F = female. Mean values within a column bearing different letters differ significantly (Tukey-adjusted P < 0.05).
Table 5
Estimated effects (CM − Control) of 15% CM supplementation on VB growth-curve parameters
| Parameter | 0% CM (Control) | 15% CM | Diff | 95% Confidence | P-value |
|---|---|---|---|---|---|
| A (g) | 4240.29 ± 258.10a | 3407.89 ± 168.08b | −832.40 | (−1443.46, −221.34) | 0.0081 |
| B | 0.7915 ± 0.0128a | 0.7550 ± 0.0097b | −0.0365 | (−0.0708, −0.0021) | 0.0389 |
| k | 0.0711 ± 0.0063b | 0.0950 ± 0.0041a | 0.0239 | (0.0089, 0.0389) | 0.0020 |
Estimated effects were derived from the linear mixed model described in Table 3 and are expressed as CM − Control. A = asymptotic parameter (g); B = integration constant; k = growth-rate parameter (week−1). CM = diet containing Acheta domesticus meal. Values are presented as estimate ± SE, together with 95% confidence intervals and associated P-values. Positive estimates indicate larger parameter values in CM-fed birds relative to control-fed birds.
Mean values within a column bearing different letters differ significantly (Tukey-adjusted P < 0.05).
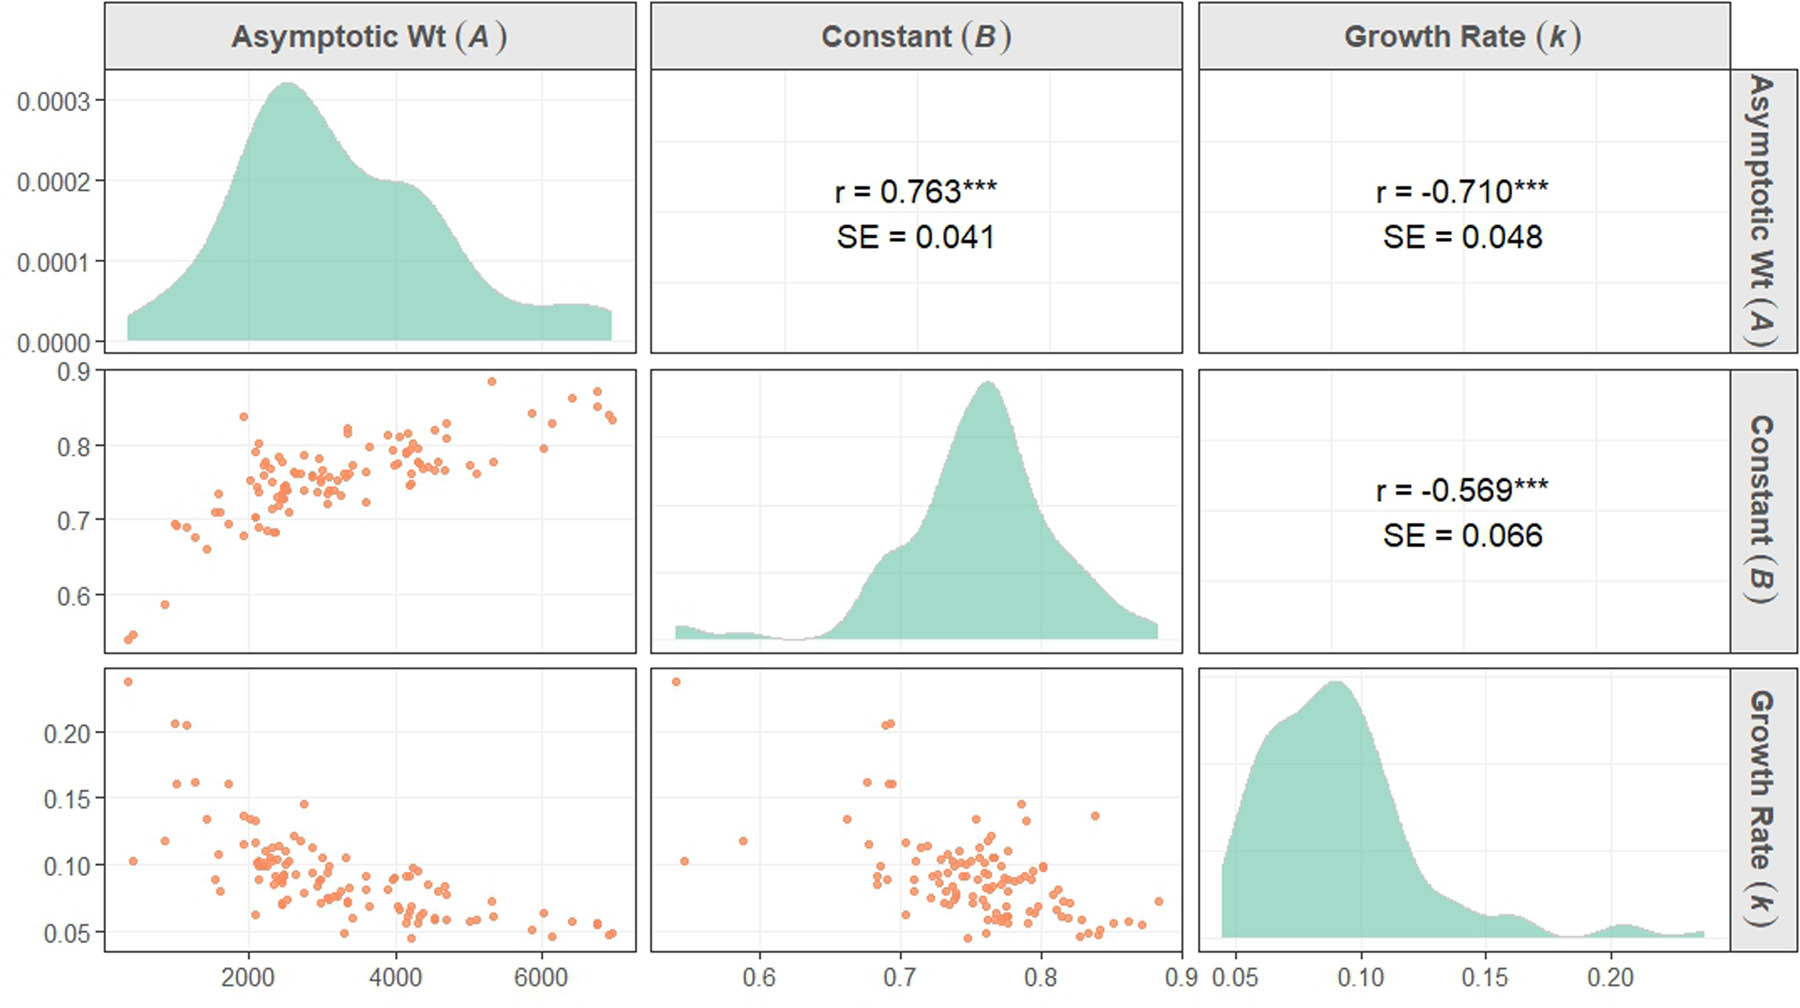
Figure 2
Pairwise relationships among Von Bertalanffy growth-curve parameters estimated for individual birds. Diagonal panels show marginal distributions of the asymptotic parameter (A), integration constant (B), and growth-rate parameter (k, week−1), whereas off-diagonal panels display pairwise scatterplots. Pearson correlation coefficients (r) and SE are shown in the upper panels. Correlations should be interpreted as descriptive associations among jointly estimated model parameters. *** P < 0.001.