
1. Introduction
Understanding how nutrition influences growth trajectories is an important objective in animal production, particularly in slow-growing or indigenous genotypes where production efficiency depends on achieving market weight within a fixed rearing period. In poultry systems, performance is commonly evaluated using body weight (BW) at specific ages. However, similar slaughter weights may arise from different growth trajectories, reflecting variation in the rate and pattern of growth rather than differences in body size alone (Aggrey, 2002). Consequently, analytical approaches that distinguish changes in growth trajectories from differences in BW outcomes provide valuable information for developing feeding strategies that improve production efficiency.
One current challenge in tropical poultry production is identifying locally available protein sources that reduce dependence on imported soybean meal while maintaining growth performance and supporting circular bio-economy objectives (Donohue & Cunningham, 2009; Krongdang et al., 2025). Thailand has developed a substantial edible-insect industry, particularly based on Acheta domesticus, creating opportunities to integrate insect production into livestock value chains (Krongdang et al., 2025). Previous studies have shown that insect meals can partially replace conventional protein sources while maintaining acceptable performance in poultry (Gasco et al., 2019; Moula & Detilleux, 2019). However, reported responses have been inconsistent, with some studies indicating reduced growth performance at high inclusion levels (>10% replacement), suggesting that responses may depend on dietary inclusion level and bird characteristics (Moula & Detilleux, 2019). These inconsistencies raise an important question as to whether insect-based diets primarily influence BW outcomes or modify underlying growth trajectories.
A major nutritional consideration in insect-based feeds is chitin, a structural polysaccharide that may affect nutrient utilization. Poultry possess gastric acidic chitinase (CHIA), enabling partial digestion of chitin-containing diets, although responses appear genotype-dependent (Tabata et al., 2018; Kovitvadhi et al., 2021). Moderate chitin inclusion may also influence gut microbial communities and host physiology (T-Thienprasert et al., 2025), whereas excessive levels may impair growth performance (Moula & Detilleux, 2019). Indigenous chickens may differ from intensively selected commercial lines in their ability to utilize such diets because they retain broader dietary adaptability and less specialized metabolic regulation (Tabata et al., 2018; Gasco et al., 2019). Nevertheless, most feeding studies evaluate only BW at fixed ages, making it difficult to determine whether observed responses reflect changes in growth trajectories or differences in model-predicted growth parameters.
Growth-curve analysis provides a biologically informative framework for addressing this limitation. Nonlinear growth functions such as Gompertz, Brody, Von Bertalanffy (VB), and Richards summarize growth through interpretable parameters, including the asymptotic parameter ( A ), integration constant ( B ), and growth-rate parameter ( k ) (Aggrey, 2002). In the present study, age was expressed in weeks; therefore, k is reported in week−1 and describes the rate at which the fitted growth trajectory approaches the asymptotic parameter within the selected model. Because k is a model-derived parameter whose interpretation depends on both the model structure and the time scale used for fitting, it should be interpreted as an indicator of estimated growth dynamics rather than a direct measure of biological maturation. Together, these parameters provide complementary information on the shape and progression of growth trajectories and have been widely used to characterize growth patterns in poultry populations. In modern poultry production, growth-curve analysis is a valuable tool for monitoring developmental progress, optimizing feeding strategies, and identifying potential selection targets in breeding programs.
Thai indigenous chickens provide a suitable biological model for evaluating dietary effects on growth trajectories. Betong (BT; yellow-meat) chickens are valued for their firm texture associated with extended growth and collagen accumulation (Wattanachant et al., 2004; Nualhnuplong & Wattanachant, 2020), whereas Nin Kaset (NK; black-meat) chickens are a fibromelanotic genotype characterized by high melanin deposition and functional-food market positioning (Molee et al., 2018; Buasap et al., 2021; Chaisan & Baipong, 2023; T-Thienprasert et al., 2025). Melanin content increases with age and has been associated with antioxidant capacity (Tu et al., 2009; Buasap et al., 2021). Because these breeds differ in growth characteristics and production objectives, they provide a useful contrast for evaluating potential genotype-dependent responses to insect-based diets.
Nutritional modulation of growth may involve physiological pathways associated with nutrient utilization, endocrine regulation, and micronutrient availability (Daş et al., 2017; Fujita et al., 2019; El-Gogary & Abo El-Maaty, 2020). Cricket meal also provides nutrients and bioactive compounds that may influence metabolic processes (Gasco et al., 2019; Kittibunchakul et al., 2025). However, direct measurements of endocrine, metabolic, or oxidative responses were not performed in the present study; therefore, any discussion of these mechanisms should be considered biological interpretation rather than direct experimental evidence.
Accordingly, this study tested the hypothesis that moderate inclusion of cricket meal modifies estimated growth trajectories and growth-curve parameters in Thai indigenous chickens. The objectives were to (i) compare four nonlinear growth models fitted at the individual level in chickens raised under a 2 × 2 factorial combination of breed (BT vs NK) and diet (0% vs 15% cricket meal), (ii) quantify the effects of breed, feed, sex, and their interactions on the best-fit growth parameters A , B , and k , and (iii) evaluate whether cricket meal supplementation alters estimated growth trajectories and growth-curve parameters in indigenous chicken genotypes.
2. Material and methods
2.1. Ethics, animals, and experimental design
All animal procedures complied with institutional guidelines for the care and use of experimental animals and were approved by the Institutional Animal Care and Use Committee of Kasetsart University (protocol code ACKU65-VET-014).
A total of 151 Thai indigenous chickens were reared from hatch to 16 weeks of age under controlled environmental conditions. Birds were housed in stainless-steel wire-mesh pens (100 cm × 100 cm × 100 cm) with approximately 5 cm of rice-husk bedding. Brooding temperature was maintained at 34°C at placement and gradually reduced to 26°C by 3 weeks of age. Light intensity was maintained at 10 lux throughout the rearing period. Feed and water were provided ad libitum, and all birds received the same vaccination and health-management program.
The study followed a 2 × 2 factorial arrangement of treatments with breed (BT and NK) and feed [control diet (C) and diet containing 15% Acheta domesticus meal (CM)] as fixed factors. A total of 12 pens were used, providing three replicate pens per breed × feed treatment combination. Each pen contained approximately 12–13 birds and represented the experimental unit for dietary treatment. Individual birds were identified using wing tags and repeatedly weighed throughout the experimental period, allowing individual growth-curve analysis. Sex was recorded for each bird and incorporated as an additional fixed effect in subsequent analyses. Day-old chicks were randomly allocated to pens within each treatment combination while maintaining similar sex proportions among replicate pens.
2.2. Diet formulation and cricket meal inclusion rationale
Experimental diets were formulated in two feeding phases: starter (0–4 weeks) and grower–finisher (5–16 weeks), according to the nutritional requirements of slow-growing chickens (National Research Council [NRC], 1994). Within each phase, control and cricket-meal diets were formulated to be iso-energetic and iso-nitrogenous (Table 1). Metabolizable energy and crude protein contents were approximately 3,112 kcal/kg and 19.5%, respectively, during the starter phase and 2,970 kcal/kg and 17.0%, respectively, during the grower–finisher phase.
Table 1
Ingredient composition and calculated nutrient contents of the experimental diets containing 0 or 15% CM
| Composition | Starter feed (day old chick to 4 weeks) | Grower and finisher feed (5–16 weeks) | ||
|---|---|---|---|---|
| Ingredient | 0% CM | 15% CM | 0% CM | 15% CM |
| Corn (%) | 62.05 | 64.35 | 57.73 | 63.54 |
| Soybean meal (%) | 30.70 | 17.22 | 26.06 | 12.00 |
| House cricket meal (%) | 0.00 | 15.00 | 0.00 | 15.00 |
| Palm oil (%) | 3.92 | 0.00 | 5.15 | 0.00 |
| Cellulose (%) | 0.00 | 0.00 | 7.96 | 6.24 |
| Limestone (%) | 1.33 | 1.35 | 1.45 | 1.52 |
| Dicalcium phosphate (%) | 0.71 | 0.75 | 0.38 | 0.37 |
| Vitamin–Mineral (%) | ||||
| Premix1 (%) | 0.25 | 0.25 | 0.25 | 0.25 |
| L-Lysine (%) | 0.25 | 0.29 | 0.23 | 0.29 |
| Sodium chloride (%) | 0.24 | 0.24 | 0.24 | 0.24 |
| DL-Methionine (%) | 0.21 | 0.20 | 0.21 | 0.20 |
| Sodium bicarbonate (%) | 0.20 | 0.20 | 0.20 | 0.20 |
| L-Threonine (%) | 0.07 | 0.08 | 0.07 | 0.08 |
| Choline chloride (%) | 0.07 | 0.07 | 0.07 | 0.07 |
| Chemical composition | ||||
| ME (kcal/kg) | 3112.00 | 3112.00 | 2970.00 | 2970.00 |
| Crude protein (%) | 19.50 | 19.50 | 17.00 | 17.00 |
| Crude fat (%) | 6.51 | 6.23 | 7.51 | 6.12 |
| Crude fiber (%) | 3.18 | 4.74 | 10.40 | 10.40 |
| Calcium (%) | 0.90 | 0.90 | 0.81 | 0.80 |
| Available phosphorus (%) | 0.45 | 0.45 | 0.32 | 0.32 |
| Lysine (%) | 1.20 | 1.19 | 1.04 | 1.04 |
| Methionine (%) | 0.51 | 0.50 | 0.47 | 0.47 |
| Methionine + Cysteine (%) | 0.84 | 0.89 | 0.76 | 0.75 |
| Threonine (%) | 0.80 | 0.80 | 0.70 | 0.70 |
| Arginine (%) | 1.29 | 1.21 | 1.11 | 1.03 |
| Tyrosine (%) | 0.61 | 0.71 | 0.53 | 0.62 |
| Tryptophan (%) | 0.24 | 0.19 | 0.21 | 0.16 |
[i] 1Vitamin–mineral premix (Feed Specialties Co., Ltd, Pathum Thani, Thailand) supplied per kg of diet: vitamin A, 2,500,000 IU; vitamin D3, 1,000,000 IU; vitamin E, 7,000 IU; vitamin K, 700 mg; vitamin B1, 400 mg; vitamin B2, 800 mg; vitamin B6, 400 mg; vitamin B12, 4 mg; biotin, 30 mg; pantothenic acid, 3,111 mg; folic acid, 100 mg; vitamin C, 15,000 mg; niacin (vitamin B3), 5,600 mg; Zn, 10,500 mg; Fe, 10,920 mg; Mn, 9,960 mg; Cu, 3,850 mg; I, 137 mg; and Se, 70 mg. Diets were formulated to be iso-nitrogenous and iso-energetic within each feeding phase, with CM partially replacing soybean meal in the cricket meal treatment. Nutrient values are calculated compositions. ME = metabolizable energy.
To avoid overestimation of protein derived from insect non-protein nitrogen, crude protein content of cricket meal was calculated using a nitrogen-to-protein conversion factor of 4.76, whereas a factor of 6.25 was applied to conventional feed ingredients (Ritvanen et al., 2020). Crystalline amino acids were added as necessary to achieve similar concentrations of lysine, methionine, and threonine among diets.
House cricket (Acheta domesticus) meal was obtained from a certified commercial producer, oven-dried at 105°C to constant weight, and ground through a 1 mm screen. Proximate composition was determined according to AOAC International (AOAC International, 2006) procedures and indicated a crude protein content exceeding 57%, with lysine and methionine concentrations of 6.2% and 2.1%, respectively. These values are consistent with previous reports describing the nutritional suitability of cricket meal for poultry feeding (Kovitvadhi et al., 2021).
The 15% inclusion level of cricket meal, corresponding to approximately 30% replacement of total dietary protein, was selected based on previous studies indicating that moderate inclusion levels can be incorporated without detrimental effects on poultry growth performance (Moula & Detilleux, 2019). Because dietary energy and amino acid concentrations were balanced across treatments, the cricket meal treatment primarily represented a substitution of protein source composition, including the introduction of chitin and insect-derived bioactive compounds (Gasco et al., 2019; Kittibunchakul et al., 2025).
2.3. Sex determination
Birds were reared in mixed-sex groups to reflect practical production conditions. Sex was determined at hatch by trained personnel using the vent-sexing method. Chicks were subsequently distributed among pens to maintain comparable proportions of males and females across treatment groups. Sex was recorded for each individual bird and included as a fixed effect in all statistical analyses.
2.4. Growth models and parameter estimation
Individual BW records and corresponding age in weeks ( t ) were used to fit four biologically interpretable nonlinear growth functions: Brody (Brody, 1945), Gompertz (Gompertz, 1825), VB (von Bertalanffy, 1957), and Richards (Richards, 1959), following the comparative framework of Aggrey (2002). Expected BW at age t ( W t ) was described as
Brody: .
Gompertz: .
VB: .
Richards: .
Models were fitted separately to each bird using nonlinear least squares with the Levenberg–Marquardt algorithm implemented in the minpack.lm package (Elzhov et al., 2023) in R (R Core Team, 2025). Initial parameter values were derived from exploratory fits based on treatment-group averages and constrained within biologically realistic bounds for slow-growing indigenous chickens to improve numerical stability and parameter identifiability.
All 151 birds were included in the initial model-fitting and model-comparison procedures. Model adequacy was evaluated using convergence status, residual diagnostics, parameter standard errors (SE), and goodness-of-fit statistics. Comparative evaluation of the candidate models (Brody, Gompertz, Richards, and VB) was performed using all available trajectories and was used to identify the most appropriate model for subsequent analyses.
Following model selection, individual parameter estimates from the selected model were screened for convergence and biological plausibility. Trajectories that failed to converge after repeated initialization or produced biologically implausible parameter estimates were excluded from subsequent analyses of growth parameters. Specifically, 43 birds were excluded because their fitted trajectories either failed to converge or yielded implausible parameter estimates (e.g., k < 0 week−1 or A > 8,000 g), resulting in a final analytical dataset of 108 birds. Exclusions were restricted to cases with insufficient information to obtain stable and identifiable parameter estimates, thereby improving the reliability of subsequent analyses of growth-curve parameters.
2.5. Model selection criteria
For each individual bird and candidate model, goodness-of-fit was evaluated using the coefficient of determination (R 2) and adjusted coefficient of determination (adjusted R 2), whereas model parsimony was assessed using the Akaike information criterion (AIC) and Bayesian information criterion (BIC). To compare models at the population level, summary statistics (mean value ± SD) for R 2, adjusted R 2, AIC, and BIC were calculated across all individuals and further examined within breed, feed, and sex subclasses.
Model selection was based on concordance among criteria, with higher R 2 and adjusted R 2 values and lower AIC and BIC values indicating superior performance. When competing models exhibited comparable statistical performance, preference was given to the model providing stable parameter estimates and biologically interpretable growth parameters. Accordingly, the final model was selected as the best compromise between goodness-of-fit, model parsimony, and interpretability of growth trajectories (Aggrey, 2002).
2.6. Statistical analysis of growth parameters
Following model selection, individual estimates of A, B , and k obtained from the best-fitting growth model were treated as continuous phenotypic traits and analyzed using linear mixed-effect models implemented in the MIXED procedure of SAS OnDemand for Academics (SAS Institute Inc., 2025). We acknowledge that this two-stage analytical approach treats estimated growth parameters as observed phenotypes and does not propagate the uncertainty associated with individual nonlinear model fitting into the second-stage mixed-model analyses. Consequently, parameter precision may vary among individuals and should be considered when interpreting the results.
Fixed effects included breed (BT vs NK), diet (0% vs 15% cricket meal), sex (male vs female), and all two-way and three-way interactions. Pen was fitted as a random effect to account for clustering of birds within pens. The pen represented the experimental unit for dietary treatment, whereas the individual bird served as the observational unit for growth-curve parameter estimation.
The statistical model was
where Y ijkl represents the estimated growth parameter ( A , B , or k ) for bird l in the i th breed, j th feed, and k th sex combination; μ is the overall mean; fixed terms represent the main effects and their interactions; Pen l is the random pen effect assumed N(0, σ 2pen); and ε ijkl is the residual error assumed N(0, σ 2e). For the VB model, A represents the asymptotic parameter (g), B is a dimensionless integration constant, and k is the estimated growth-rate parameter expressed in week−1, reflecting the weekly time scale used for growth-curve modeling.Model residuals were evaluated graphically to verify assumptions of normality and homogeneity of variance. Significance of fixed effects was assessed using Type III tests. Least-squares means (LSMeans ± SE) were estimated for treatment combinations and compared using Tukey-adjusted multiple comparisons.
Phenotypic relationships among growth parameters were evaluated using Pearson correlation coefficients calculated from birds with converged model fits. Correlation structures among A , B , and k were visualized using scatterplot matrices with marginal density distributions to illustrate the direction and magnitude of associations among estimated growth parameters. Because A , B , and k are jointly estimated from the same nonlinear model, these correlations should be interpreted primarily as descriptive associations among estimated parameters rather than as direct evidence of biological trade-offs.
3. Results
3.1. Data overview and growth trajectories
A total of 151 birds were initially included in the growth-model fitting and model-comparison procedures. Following model fitting, 43 birds were excluded from subsequent growth-parameter analyses because their trajectories failed to converge or yielded biologically implausible parameter estimates. Consequently, 108 birds with converged and biologically plausible estimates were retained for statistical analyses of growth-curve parameters. Repeated BW records collected from hatch to 16 weeks of age provided longitudinal weight–age data suitable for individual growth-curve modeling.
Across all treatment groups, BW increased progressively with age and exhibited the characteristic sigmoidal pattern of poultry growth, although substantial variation among individuals was evident (Figure 1). Birds receiving the 15% CM diet generally attained greater BW at 16 weeks than birds fed the control diet. The highest observed BW values were recorded in NK males receiving the CM diet (NK-CM-M), whereas the lowest values were observed in BT females fed the control diet (BT-C-F) (Figure 1).
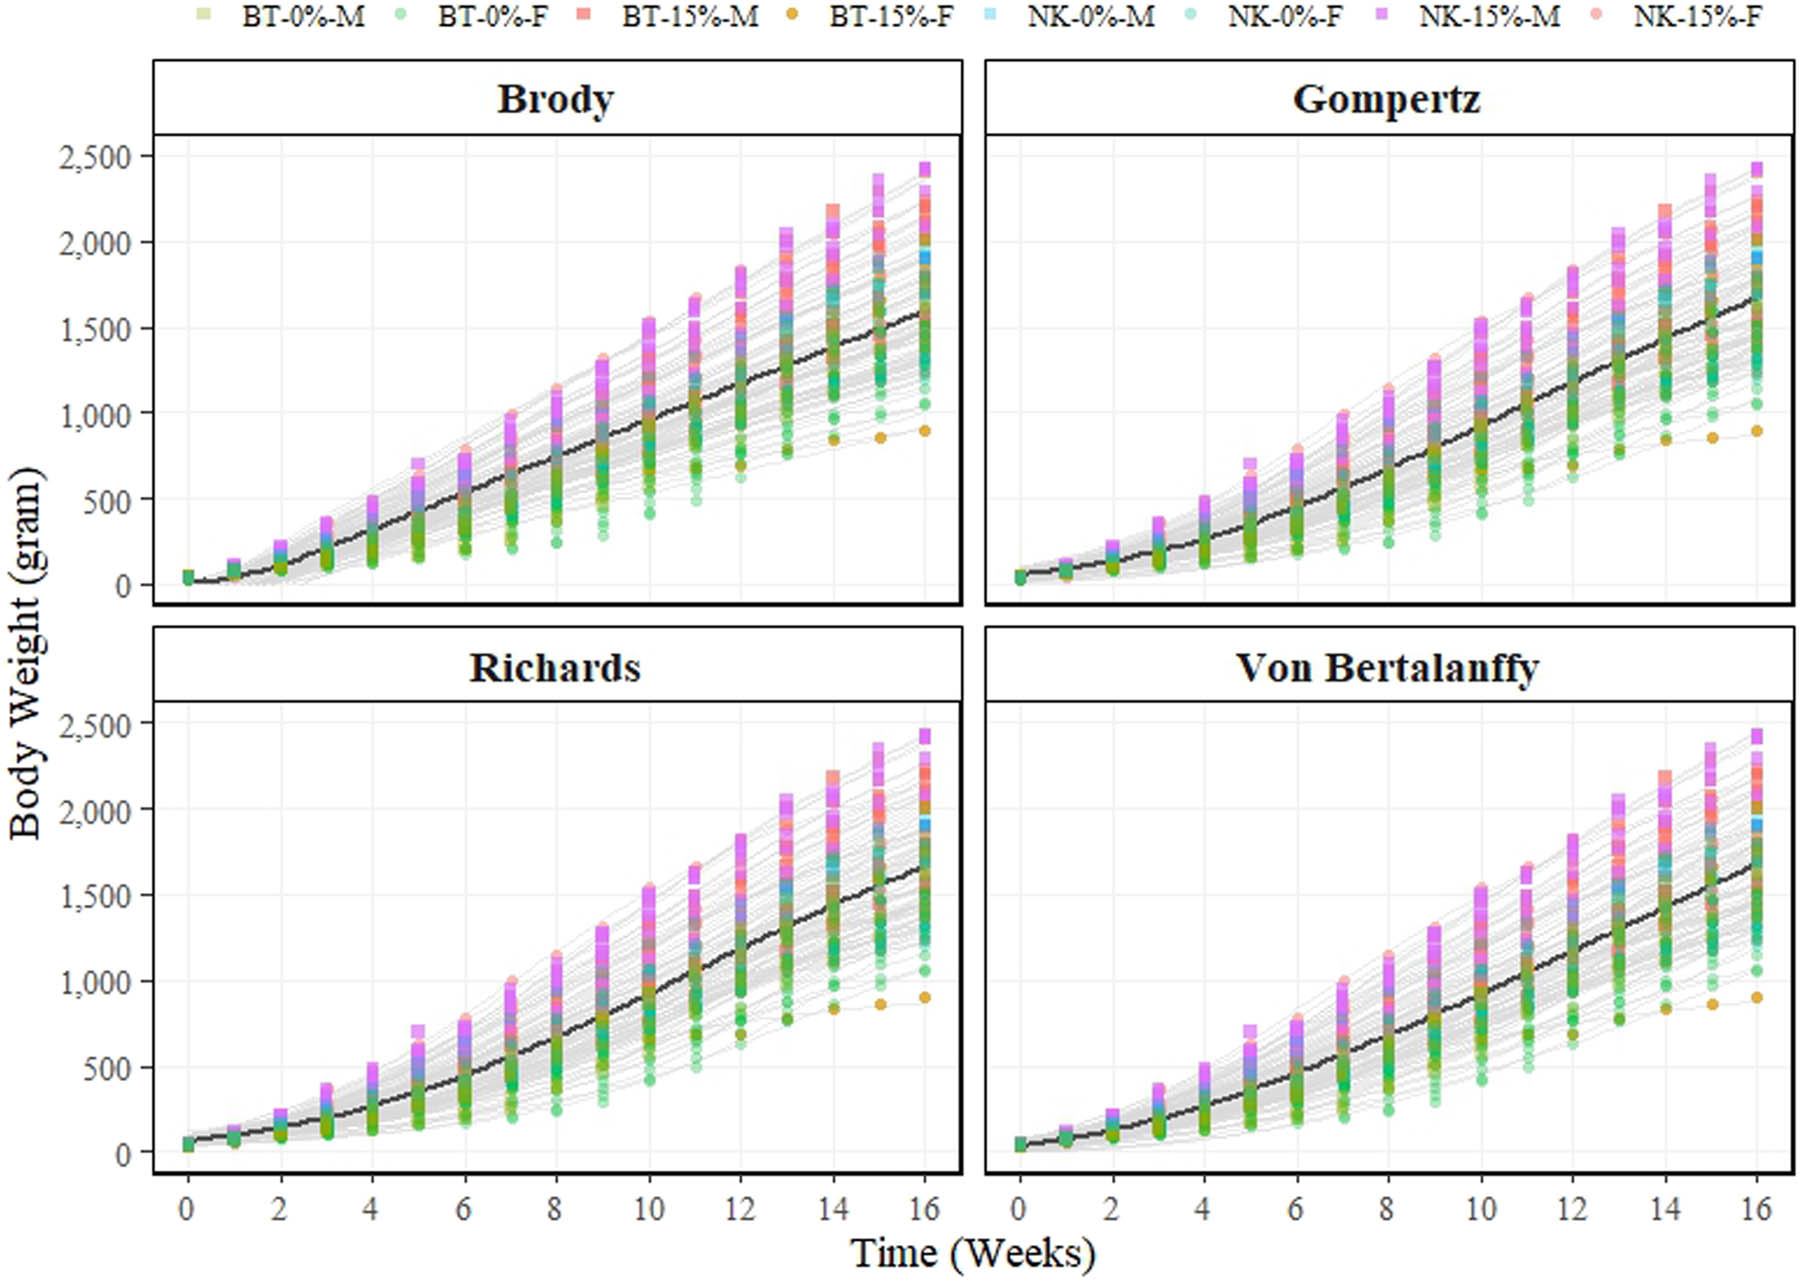
Figure 1
Observed BW trajectories and fitted growth curves of Thai indigenous chickens under four nonlinear growth models. Symbols represent observed BW measurements from hatch to 16 weeks of age. Grey lines represent individual fitted trajectories, and the bold line indicates the mean fitted trajectory. BT = Betong; NK = Nin Kaset; 0% CM = diet containing 0% Acheta domesticus meal or control diet; 15% CM = diet containing 15% Acheta domesticus meal; M = male; F = female.
All four candidate growth functions provided satisfactory descriptions of the longitudinal BW data (Table 2). Model comparison was initially conducted using all 151 birds and evaluated using the R 2, adjusted R 2, AIC, and BIC. Although all models showed high goodness-of-fit, the VB model consistently combined favorable fit statistics with the highest frequency of individual best fits. Accordingly, the VB function was selected for subsequent analyses of growth-curve parameters using the subset of birds with converged and biologically plausible parameter estimates (n = 108).
Table 2
Goodness-of-fit statistics (mean value ± SD) and frequency of individual best fits among all birds (n = 151) for four nonlinear growth models fitted to BW trajectories of Thai indigenous chickens
| Parameter | Model | |||
|---|---|---|---|---|
| Brody | Gompertz | Richards | Von Bertalanffy | |
| R 2 | 0.972 ± 0.03 | 0.996 ± 0.01 | 0.997 ± 0.01 | 0.996 ± 0.01 |
| Best-fit proportion (R 2) | 5.3% (8/151) | 11.92% (18/151) | 37.09% (56/151) | 45.70% (69/151) |
| Adj-R 2 | 0.961 ± 0.04 | 0.994 ± 0.01 | 0.995 ± 0.01 | 0.993 ± 0.01 |
| Best-fit proportion (Adj-R 2) | 4.64% (7/151) | 23.18% (35/151) | 26.49% (40/151) | 45.70% (69/151) |
| AIC | 164.98 ± 49.06 | 134.38 ± 37.46 | 134.04 ± 36.33 | 134.66 ± 38.19 |
| Best-fit proportion (AIC) | 5.3% (8/151) | 26.49% (40/151) | 22.52% (34/151) | 45.70% (69/151) |
| BIC | 167.55 ± 50.12 | 136.96 ± 38.52 | 137.26 ± 37.65 | 137.23 ± 39.24 |
| Best-fit proportion (BIC) | 5.3% (8/151) | 27.15% (41/151) | 21.85% (33/151) | 45.70% (69/151) |
Goodness-of-fit statistics are presented as mean value ± SD for birds with converged and biologically plausible parameter estimates (n = 108). Best-fit proportions (% [n]) were calculated using all birds included in the initial model-comparison procedure (n = 151). The Brody, Gompertz, Richards, and Von Bertalanffy models were fitted separately to individual BW trajectories. R 2 = coefficient of determination; Adj-R 2 = adjusted coefficient of determination; AIC = Akaike information criterion; BIC = Bayesian information criterion.
3.2. Model comparison and selection
All four candidate models provided satisfactory descriptions of individual BW trajectories, with high mean coefficients of determination (R 2 > 0.97; Table 2). Among the sigmoidal functions, the Gompertz, Richards, and VB models exhibited similarly high goodness-of-fit, with mean R 2 values approaching 0.996. However, differences were observed in model parsimony and consistency across individuals.
The Brody model showed the least favorable performance, with lower goodness-of-fit statistics and higher AIC and BIC values than the alternative models (Table 2). In contrast, the VB, Gompertz, and Richards functions generally provided comparable fits to the observed growth trajectories. Among these models, the VB function consistently combined high goodness-of-fit with favorable information-criterion values.
Evaluation at the individual-bird level further supported selection of the VB model. Model-selection frequencies were calculated using all birds included in the initial model-comparison procedure (n = 151). Based on R 2, adjusted R 2, AIC, and BIC, the VB function was identified as the best-fitting model for 45.70% (69/151) of birds, representing the highest selection frequency among the candidate models (Table 2). Based on the R 2 criterion, the Richards model accounted for 37.09% (56/151) of best-fit cases, followed by Gompertz (11.92%; 18/151) and Brody (5.30%; 8/151). Although the Richards function occasionally achieved goodness-of-fit statistics comparable to those of the VB model, greater variability in parameter estimates and reduced parameter stability were observed among individuals.
Subsequent analyses of growth-curve parameters required converged and biologically plausible parameter estimates. Therefore, only 108 birds were retained for statistical analyses of the VB parameters, including the asymptotic parameter ( A , g), integration constant ( B ), and growth-rate parameter ( k , week−1). Considering the combined evidence from goodness-of-fit statistics, information criteria, parameter stability, and frequency of individual best fits, the VB model was selected for subsequent analyses of estimated growth-curve parameters (Table 2; Aggrey, 2002). Detailed interpretation of these parameters is presented in Section 4.
3.3. Fixed effects and LSMeans patterns of VB parameters (A, B, k)
Type III tests indicated that the VB parameters were influenced primarily by the main effects of feed, breed, and sex, whereas no significant two-way or three-way interactions were detected (P > 0.05; Table 3). Consequently, subsequent interpretation was based on the main-effect LSMeans.
Table 3
Type III tests of fixed effects for VB growth-curve parameters (A, B, and k) in Thai indigenous chickens
| Effect | A(g) | B | k | ||||||
|---|---|---|---|---|---|---|---|---|---|
| Den DF | F-value | P-value | Den DF | F-value | P-value | Den DF | F-value | P-value | |
| Breed | 100 | 1.97 | 0.1635 | 14.5 | 0.30 | 0.5919 | 100 | 6.37 | 0.0132 |
| Feed | 100 | 7.30 | 0.0081 | 14.5 | 5.16 | 0.0389 | 100 | 10.02 | 0.0020 |
| Sex | 100 | 28.28 | < 0.0001 | 99.8 | 13.55 | 0.0004 | 100 | 2.42 | 0.1229 |
| Breed × Feed | 100 | 0.03 | 0.8631 | 14.5 | 0.89 | 0.3611 | 100 | 0.05 | 0.8224 |
| Breed × Sex | 100 | 0.00 | 0.9609 | 99.8 | 0.04 | 0.8453 | 100 | 0.14 | 0.7074 |
| Feed × Sex | 100 | 0.03 | 0.8642 | 99.8 | 0.98 | 0.3254 | 100 | 0.52 | 0.4734 |
| Breed × Feed × Sex | 100 | 0.62 | 0.4323 | 99.8 | 0.00 | 0.9900 | 100 | 0.04 | 0.8364 |
Num DF = numerator degrees of freedom; Den DF = denominator degrees of freedom. VB growth-curve parameters were analyzed as dependent variables, where A = asymptotic parameter (g), B = integration constant, and k = growth-rate parameter (week−1). Fixed effects included breed (BT and NK), feed (0% CM and 15% CM), sex (male and female), and their interactions. Parameters were analyzed using a linear mixed-effects model with pen fitted as a random effect. Reported statistics include Den DF, F-values, and P-values from Type III tests of fixed effects. Denominator degrees of freedom were estimated using the Kenward–Roger approximation.
Feed significantly affected all three growth parameters. Birds receiving the 15% cricket meal (CM) diet exhibited lower values of the asymptotic parameter ( A ; P = 0.0081) and integration constant ( B ; P = 0.0389), but higher values of the growth-rate parameter ( k , week−1; P = 0.0020) than birds fed the control diet (Table 3). Averaged across breeds and sexes, CM-fed birds showed a lower mean A (approximately 3,407 g vs 4,240 g) and B (approximately 0.755 vs 0.791), together with a higher mean k (approximately 0.095 vs 0.071 week−1) than control-fed birds (Table 4). Expressed as CM − Control, the estimated dietary effects were −832.40 g for A (95% CI: −1,443.46 to −221.34; P = 0.0081), −0.0365 for B (95% CI: −0.0708 to −0.0021; P = 0.0389), and 0.0239 week⁻1 for k (95% CI: 0.0089 to 0.0389; P = 0.0020) (Table 5).
Table 4
LSMeans (± SE) of VB growth-curve parameters (A, B, and k) according to feed, breed, and sex
| Main effect | A (g) | B | k | |
|---|---|---|---|---|
| Breed | BT | 4040.25 ± 228.59 | 0.7777 ± 0.01176 | 0.07354 ± 0.005599b |
| NK | 3607.93 ± 206.43 | 0.7689 ± 0.01093 | 0.09257 ± 0.005056a | |
| P-value | 0.1635 | 0.5919 | 0.0132 | |
| Feed | 0% CM | 4240.29 ± 258.10a | 0.7915 ± 0.01281a | 0.07111 ± 0.006321b |
| 15% CM | 3407.89 ± 168.08b | 0.7550 ± 0.009679b | 0.09500 ± 0.004117a | |
| P-value | 0.0081 | 0.0389 | 0.0020 | |
| Sex | M | 4643.12 ± 271.59a | 0.7976 ± 0.01242a | 0.07719 ± 0.006652 |
| F | 3005.06 ± 145.27b | 0.7489 ± 0.007893b | 0.08892 ± 0.003558 | |
| P-value | <0.0001 | 0.0004 | 0.1229 | |
A = asymptotic parameter (g); B = integration constant; k = growth-rate parameter (week−1). LSMeans ± SE were estimated from the mixed model described in Table 3. BT = Betong; NK = Nin Kaset; 0% CM = diet containing 0% Acheta domesticus meal or control diet; 15% = diet containing 15% CM; M = male; F = female. Mean values within a column bearing different letters differ significantly (Tukey-adjusted P < 0.05).
Table 5
Estimated effects (CM − Control) of 15% CM supplementation on VB growth-curve parameters
| Parameter | 0% CM (Control) | 15% CM | Diff | 95% Confidence | P-value |
|---|---|---|---|---|---|
| A (g) | 4240.29 ± 258.10a | 3407.89 ± 168.08b | −832.40 | (−1443.46, −221.34) | 0.0081 |
| B | 0.7915 ± 0.0128a | 0.7550 ± 0.0097b | −0.0365 | (−0.0708, −0.0021) | 0.0389 |
| k | 0.0711 ± 0.0063b | 0.0950 ± 0.0041a | 0.0239 | (0.0089, 0.0389) | 0.0020 |
Estimated effects were derived from the linear mixed model described in Table 3 and are expressed as CM − Control. A = asymptotic parameter (g); B = integration constant; k = growth-rate parameter (week−1). CM = diet containing Acheta domesticus meal. Values are presented as estimate ± SE, together with 95% confidence intervals and associated P-values. Positive estimates indicate larger parameter values in CM-fed birds relative to control-fed birds.
Mean values within a column bearing different letters differ significantly (Tukey-adjusted P < 0.05).
Sex significantly influenced A (P < 0.0001) and B (P = 0.0004), but not k (P = 0.1229). Males exhibited greater values of A (approximately 4,643 g) and B (approximately 0.798) than females (approximately 3,005 g and 0.749, respectively), whereas estimates of k did not differ significantly between sexes (Table 4).
Breed did not significantly affect A (P = 0.1635) or B (P = 0.5919) but significantly influenced k (P = 0.0132). NK chickens exhibited a higher mean k value (approximately 0.093 week−1) than BT chickens (approximately 0.074 week−1), indicating differences in the fitted growth trajectories between the two genotypes (Table 4).
Because no significant interactions were detected, parameter patterns within individual breed × feed × sex subclasses were consistent with the main effects observed above (Supplementary Tables S1 and S2). Overall, dietary treatment was the principal factor influencing all three VB parameters, whereas sex primarily affected A and B , and breed influenced only the estimated growth-rate parameter ( k ).
3.4. Correlations among VB parameters
Phenotypic associations among the VB growth parameters were evaluated using Pearson correlation coefficients calculated from individual estimates of the asymptotic parameter ( A ), integration constant ( B ), and growth-rate parameter ( k , week−1) (Figure 2). Strong correlations were observed among all three parameters. The asymptotic parameter ( A ) was positively correlated with B (r = 0.763, SE = 0.041) and negatively correlated with k (r = −0.710, SE = 0.048). In addition, B and k exhibited a moderate negative correlation (r = −0.569, SE = 0.066) (Figure 2).
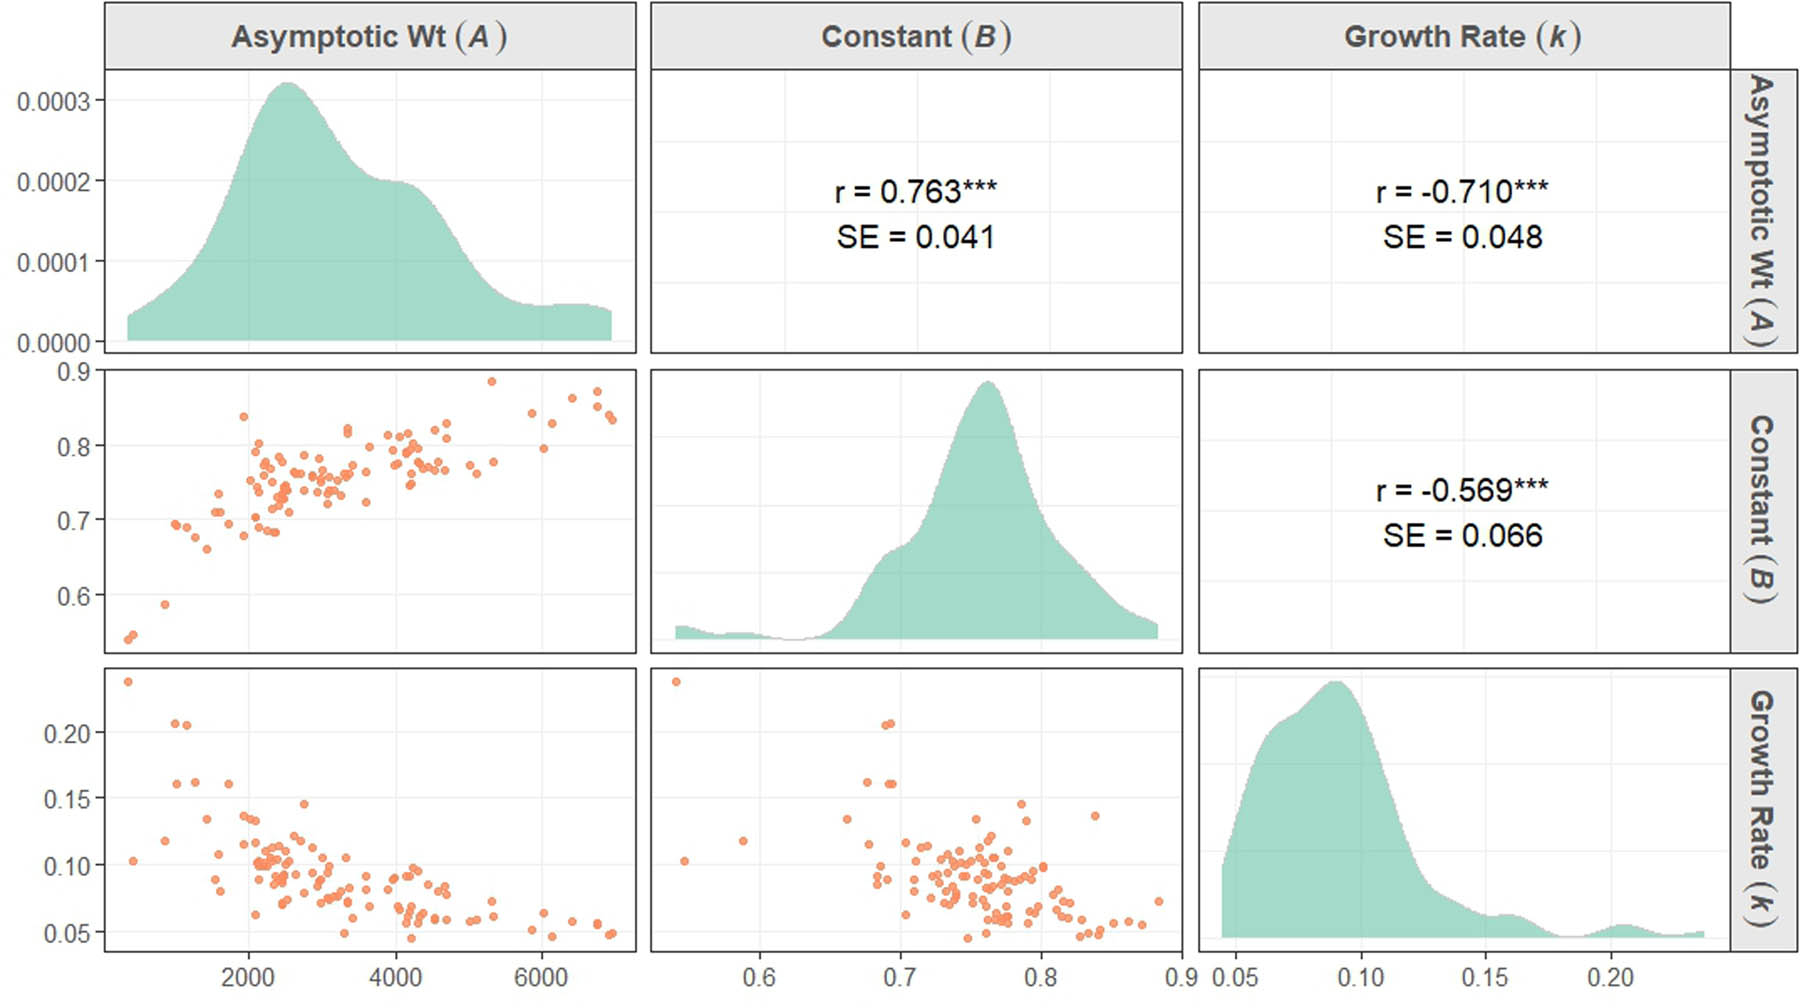
Figure 2
Pairwise relationships among Von Bertalanffy growth-curve parameters estimated for individual birds. Diagonal panels show marginal distributions of the asymptotic parameter (A), integration constant (B), and growth-rate parameter (k, week−1), whereas off-diagonal panels display pairwise scatterplots. Pearson correlation coefficients (r) and SE are shown in the upper panels. Correlations should be interpreted as descriptive associations among jointly estimated model parameters. *** P < 0.001.
The scatterplot matrix revealed consistent relationships among parameter estimates across individuals. Birds with larger estimated values of A generally exhibited lower estimated values of k , whereas individuals with higher B values tended to exhibit lower k values. These relationships were reflected in the overall distribution of parameter estimates and were observed across the range of fitted growth trajectories (Figure 2).
Because A , B , and k are jointly estimated parameters of the same nonlinear function, the observed correlations should be interpreted primarily as descriptive associations among model parameters and may partly reflect mathematical interdependence arising from the structure of the VB model and the estimation process. Consequently, the correlation matrix is presented as an exploratory summary of the parameter space occupied by individual growth trajectories rather than as direct evidence of biological trade-offs or physiological mechanisms.
The parameter associations shown in Figure 2 were generally consistent with the main-effect LSMeans presented in Table 4, where birds receiving the cricket meal diet exhibited lower mean values of A and B but higher mean values of k (week−1) than birds fed the control diet. Detailed interpretation of these parameter relationships and their potential biological implications is provided in Section 4.
4. Discussion
4.1. Suitability of the VB model and relationships among growth parameters
The present study compared four nonlinear growth functions (Brody, Gompertz, VB, and Richards) and identified the VB model as the most suitable compromise between goodness-of-fit, parameter stability, and biological interpretability for describing growth trajectories of Thai indigenous chickens under the 2 × 2 breed × feed experimental design. Consistent with previous poultry studies, the VB and Gompertz models provided superior descriptions of sigmoidal growth patterns compared with the Brody model, which generally exhibited poorer fit statistics and less favorable information-criterion values (Aggrey, 2002; Mata-Estrada et al., 2020; Plaengkaew et al., 2021).
Within the VB framework, the asymptotic parameter ( A ) describes the upper limit of the fitted growth trajectory, B is a dimensionless integration constant associated with the position of the trajectory at early ages, and k (week−1) represents the growth-rate parameter governing the temporal progression of the fitted growth trajectory (Aggrey, 2002; Plaengkaew et al., 2021). Because k is a model-derived parameter whose interpretation depends on both the structure of the growth model and the time scale used for fitting, it should be interpreted as an indicator of estimated growth dynamics rather than as a direct measure of biological maturation. Together, these parameters provide a compact description of individual growth trajectories and facilitate comparisons among breeds, sexes, and feeding treatments.
Correlation analysis revealed substantial associations among the estimated VB parameters. The asymptotic parameter ( A ) was positively associated with B and negatively associated with k , whereas B and k also exhibited a negative relationship (Figure 2). Similar patterns have been reported in poultry growth studies using nonlinear growth models (Akbaş & Oğuz, 1998; Mata-Estrada et al., 2020; Plaengkaew et al., 2021). However, because A , B , and k are jointly estimated from the same mathematical function, these relationships should be interpreted primarily as descriptive associations among model parameters and may partly reflect mathematical interdependence inherent to the VB model.
Despite these considerations, the parameter relationships were consistent with observed differences in fitted growth trajectories among treatment groups. Birds characterized by higher estimates of k generally exhibited steeper fitted growth trajectories during the production period, whereas larger estimates of A did not necessarily correspond to greater observed BW at 16 weeks of age. Similar patterns were observed between BT and NK chickens and between males and females, indicating that differences in estimated growth trajectories were not always accompanied by proportional differences in observed BW within the experimental period.
A comparable pattern was observed for dietary effects. Birds receiving the cricket meal diet exhibited higher estimates of k and lower estimates of A than control-fed birds. Consequently, dietary differences were expressed primarily through changes in the shape and temporal dynamics of the fitted growth trajectory rather than through a uniform increase in all growth parameters. Because BW records were collected only until 16 weeks of age and many birds had not reached the terminal deceleration phase of growth, estimates of A should be interpreted cautiously as model-predicted asymptotic parameters derived partly through extrapolation rather than as direct measures of ultimate body size.
Overall, the VB model provided a robust framework for characterizing growth trajectories in Thai indigenous chickens and for quantifying differences among breeds, sexes, and dietary treatments through biologically interpretable growth parameters. These findings support the use of growth-curve analysis as a complementary approach to conventional BW evaluation when assessing nutritional interventions and alternative protein sources in slow-growing poultry populations.
4.2. Chitin utilization and responses to cricket meal supplementation in indigenous chickens
Cricket meal differs from conventional soybean meal not only in amino-acid composition but also in the presence of chitin, a β-1,4-linked N-acetyl-D-glucosamine polymer that forms the structural component of insect exoskeletons (Moula & Detilleux, 2019). In poultry, chitin and its derivatives have been reported to influence nutrient utilization, gut morphology, microbial populations, and immune responses, although excessive dietary inclusion may negatively affect digestibility and growth performance (Moniello et al., 2019). Consequently, responses to insect-based diets are determined not only by nutrient composition but also by the ability of birds to utilize chitin-containing feed ingredients.
Chickens possess functional acidic chitinase (CHIA), which remains active under gastric conditions and is resistant to pepsin and trypsin degradation, enabling partial hydrolysis of dietary chitin in the upper gastrointestinal tract (Tabata et al., 2018; Kovitvadhi et al., 2021). This physiological capability has been proposed as one factor supporting the incorporation of insect-derived ingredients into poultry diets. In the present study, birds receiving the 15% cricket meal diet exhibited lower estimates of A and B together with higher estimates of the growth-rate parameter k (week−1) than control-fed birds. Because no significant breed × feed interaction was detected, the dietary response was generally consistent across the two indigenous chicken breeds examined.
The absence of significant breed-dependent responses suggests that both BT and NK chickens were able to accommodate the inclusion of cricket meal at the tested level without evidence of marked growth impairment. This observation is consistent with previous studies reporting successful incorporation of moderate levels of insect meal into poultry diets (Moula & Detilleux, 2019; Kovitvadhi et al., 2021). However, the present experiment did not directly evaluate chitin digestibility, digestive enzyme activity, gut microbiota, or nutrient utilization. Therefore, the biological mechanisms underlying the observed differences in estimated growth-curve parameters remain uncertain.
Comparative studies have suggested that CHIA functionality is associated with the evolutionary history of insect consumption in some vertebrates, with loss of function occurring in several lineages that shifted away from insect-rich diets (Emerling et al., 2018). Although such observations provide an interesting biological context, no genetic or physiological measurements related to chitin utilization were obtained in the present study. Consequently, any inference regarding breed-specific adaptation to insect-based diets should be made with caution.
Overall, the results indicate that replacing a portion of conventional dietary protein with cricket meal altered the estimated growth-curve parameters of indigenous chickens. Specifically, cricket meal supplementation was associated with lower model-predicted asymptotic values ( A ), lower values of the integration constant ( B ), and higher estimates of the growth-rate parameter ( k , week−1). These findings suggest modifications in the shape and temporal dynamics of the fitted growth trajectories rather than a uniform increase in BW across all ages. Further studies incorporating measurements of nutrient digestibility, gastrointestinal function, microbial ecology, and metabolic responses are required to determine the biological mechanisms underlying these growth-curve responses (Tabata et al., 2018; Moula & Detilleux, 2019; T-Thienprasert et al., 2025).
4.3. Potential physiological mechanisms underlying growth-trajectory responses
The present study demonstrated that cricket meal supplementation significantly affected the estimated VB growth-curve parameters of Thai indigenous chickens, resulting in lower estimates of the asymptotic parameter ( A ) and integration constant ( B ), together with higher estimates of the growth-rate parameter ( k , week−1). These responses indicate that dietary treatment was associated with changes in the fitted growth trajectories rather than a uniform increase in BW across all ages. Because the experimental diets were formulated to be iso-energetic and iso-nitrogenous, the observed differences are unlikely to be explained solely by variation in dietary energy or crude protein supply.
Several nutritional characteristics of cricket meal may have contributed to these responses. In addition to providing high-quality protein, cricket meal contains bioavailable minerals and a range of bioactive compounds that have been reported to influence nutrient utilization and physiological processes associated with growth (Gasco et al., 2019; Fashakin et al., 2023). For example, zinc supplementation has been associated with performance, physiological, and immune responses in broiler chickens (El-Gogary & Abo El-Maaty, 2020), while insect-derived peptides have been reported to exhibit antioxidant activity (Fashakin et al., 2023).
The insulin-like growth factor-1 (IGF-1) axis is recognized as an important regulator linking nutritional status to somatic growth in poultry (Daş et al., 2017; Fujita et al., 2019). Therefore, modulation of nutrient-responsive endocrine pathways represents one possible biological explanation for the altered growth trajectories observed in the present study. However, no measurements of circulating hormones, gene expression, nutrient digestibility, oxidative status, or metabolic activity were obtained. Consequently, the involvement of IGF-1 signaling or other physiological pathways remains speculative and cannot be inferred directly from the current data.
Accordingly, the present findings should be interpreted primarily as evidence that cricket meal supplementation was associated with changes in estimated growth-curve parameters, particularly the growth-rate parameter ( k , week−1), derived from the fitted VB model. The biological mechanisms underlying these responses remain uncertain and should be investigated in future studies incorporating endocrine, metabolic, digestive, and physiological measurements.
4.4. Genotype characteristics and the antioxidant-buffering hypothesis
NK chickens represent a fibromelanotic genotype characterized by extensive melanin deposition in the skin, connective tissues, and musculature. Previous studies have reported associations between black-meat chicken phenotypes and elevated concentrations of antioxidant-related compounds, including melanin, carnosine, and anserine, which may contribute to antioxidant activity and functional-food value (Lengkidworraphiphat et al., 2020; Buasap et al., 2021; Chaisan & Baipong, 2023). These characteristics distinguish NK chickens from conventional indigenous breeds and have contributed to their growing commercial interest.
In the present study, NK chickens exhibited significantly higher estimates of the growth-rate parameter ( k , week−1) than BT chickens, irrespective of dietary treatment. Within the VB framework, higher k values indicate a steeper fitted growth trajectory and a more rapid approach toward the model-predicted asymptotic parameter. However, because k is a model-derived parameter whose interpretation depends on both model structure and time scale, it should be interpreted as an indicator of estimated growth dynamics rather than as a direct measure of biological maturation. Furthermore, no significant breed × feed interaction was detected, indicating that the effects of cricket meal supplementation on estimated growth-curve parameters were generally consistent across both genotypes. Consequently, the higher k values observed in NK appear to reflect inherent breed differences in fitted growth trajectories rather than a genotype-specific response to cricket meal inclusion.
Cricket meal derived from Acheta domesticus contains bioactive compounds, including peptides with reported antioxidant activity, and has been proposed as a functional feed ingredient in poultry nutrition (Gasco et al., 2019; Kittibunchakul et al., 2025; Summart et al., 2025). Likewise, melanin-rich chicken genotypes have been associated with enhanced antioxidant properties (Lengkidworraphiphat et al., 2020; Buasap et al., 2021). Taken together, these observations provide a plausible biological context for considering interactions between dietary and genotype-specific factors.
Nevertheless, the present study did not include measurements of oxidative status, antioxidant activity, tissue concentrations of bioactive compounds, or related physiological indicators. Therefore, any suggestion that antioxidant buffering contributed to the observed differences in estimated growth-curve parameters remains speculative. Future studies integrating growth modeling with physiological, biochemical, and molecular measurements will be required to determine whether antioxidant-related mechanisms contribute to variation in growth trajectories among indigenous chicken genotypes.
Overall, the current findings demonstrate differences in estimated growth-curve parameters between NK and BT chickens, but they do not provide direct evidence regarding the physiological mechanisms responsible for those differences. Accordingly, the antioxidant-buffering hypothesis should be regarded as a potential explanation requiring further experimental validation.
4.5. Implications of growth-trajectory responses for NK and BT production systems
The observed differences in estimated growth-curve parameters between NK and BT chickens may have practical relevance for production systems targeting distinct market segments. As a Thai black-bone genotype, NK chickens represent a production type commonly marketed as relatively small carcasses for traditional soup-based products, with preferred live or dressed BWs typically ranging from approximately 0.8 to 1.2 kg (Boonmee et al., 2020; Chankong & Chuaychu-noo, 2021). Under such production conditions, birds are generally marketed before reaching the upper range of the fitted growth trajectory. Consequently, variation in estimated growth-curve parameters may influence the timing at which commercially relevant BWs are achieved during the production period.
In the present study, cricket meal supplementation was associated with higher estimates of the growth-rate parameter ( k , week−1) and lower estimates of the asymptotic parameter ( A ). Within the VB framework, larger values of k indicate a steeper fitted growth trajectory and a more rapid approach to the model-predicted asymptotic parameter. Although age at market weight was not evaluated directly, this parameter combination suggests altered estimated growth dynamics during the observed growth period. Such responses may be relevant for production systems in which marketing decisions are based on attaining target BWs within a fixed rearing period.
BT chickens are typically marketed at heavier BWs and are valued for meat characteristics associated with longer production cycles, including firm texture and higher collagen content (Wattanachant et al., 2004; Nualhnuplong & Wattanachant, 2020). Consistent with this production profile, BT chickens exhibited larger estimates of A and lower estimates of k than NK chickens. Nevertheless, the increase in k associated with cricket meal supplementation was observed across both breeds, indicating that dietary effects on estimated growth trajectories were not restricted to a single genotype.
Because no significant breed × feed interaction was detected, the effects of cricket meal supplementation on estimated growth parameters were generally consistent across production types represented by NK and BT chickens. These findings suggest that insect-based protein sources may influence estimated growth trajectories in indigenous chickens irrespective of genotype. However, the practical consequences for production efficiency, age at market weight, feed utilization, carcass composition, and economic returns were not evaluated in the present study and therefore require further investigation under commercial production conditions (Gasco et al., 2019; Moula & Detilleux, 2019).
Overall, the growth-curve analysis indicates that cricket meal supplementation modified estimated growth trajectories in both indigenous chicken breeds. The observed changes in growth-curve parameters may provide useful information for designing feeding strategies tailored to different production objectives, although their direct biological and economic implications remain to be quantified through future studies.
4.6. Implications for breeding, bio-circular-green (BCG)-oriented production systems, and study limitations
The present findings demonstrate that cricket meal supplementation influenced the estimated growth-curve parameters of Thai indigenous chickens, highlighting the potential value of growth-curve analysis as a complementary approach to conventional BW measurements. In particular, the consistent dietary effect on the estimated growth-rate parameter ( k , week−1) suggests that growth-curve traits may provide additional information for characterizing variation in fitted growth trajectories under alternative feeding strategies. Consequently, incorporating growth-curve parameters alongside conventional performance traits may improve the evaluation of genotypes intended for specific production objectives.
Distinct growth-curve profiles were observed between the two indigenous chicken breeds. Across dietary treatments, NK chickens exhibited higher estimates of k (week−1), whereas BT chickens displayed larger estimates of the asymptotic parameter ( A ). These differences indicate that the two genotypes followed contrasting fitted growth trajectories and may therefore be suited to different production and marketing systems. Because cricket meal supplementation affected growth parameters in a broadly similar manner across both breeds, as evidenced by the absence of significant breed × feed interactions, the observed dietary effects appear to be largely independent of genotype.
From a broader production perspective, the use of insect-derived protein sources aligns with the principles of BCG agriculture by reducing dependence on imported feed ingredients and promoting the utilization of locally available biological resources (Gasco et al., 2019; Krongdang et al., 2025). The present results indicate that moderate inclusion of cricket meal was associated with altered estimated growth trajectories in indigenous chickens without evidence of severe growth impairment. These findings support continued investigation of insect-based feed ingredients as components of sustainable poultry production systems.
Several limitations should be considered when interpreting the results. First, the study was terminated at 16 weeks of age, whereas indigenous chickens may continue growing beyond this period (Chotesangasa & Gongruttananun, 1996). Consequently, estimates of the asymptotic parameter ( A ) were derived partly through model extrapolation and should be interpreted with appropriate caution. Second, only a single cricket meal inclusion level (15%) and two indigenous chicken breeds were evaluated, limiting assessment of dose-dependent responses and broader genotype × diet relationships (Moula & Detilleux, 2019). Third, growth-curve parameters were analyzed using a two-stage approach in which individual parameter estimates were subsequently treated as phenotypic observations, and uncertainty associated with the nonlinear fitting process was not propagated into the second-stage mixed-model analyses. In addition, because the estimated growth-rate parameter ( k ) is expressed in week−1 and depends on both the selected growth model and the underlying time scale used for fitting, it should be interpreted as a model-derived descriptor of estimated growth dynamics rather than a direct measure of biological maturation. Finally, no measurements of nutrient digestibility, endocrine function, oxidative status, gut microbial ecology, or meat-quality traits were obtained. Therefore, the biological mechanisms underlying the observed changes in growth-curve parameters remain unresolved.
Future studies should extend growth observations beyond 16 weeks, evaluate multiple levels of cricket meal inclusion, and include a broader range of indigenous genotypes. Integration of growth modeling with measurements of nutrient utilization, physiological responses, and carcass characteristics would provide a more comprehensive understanding of how insect-based diets influence growth trajectories and production performance. Such information will be essential for determining the practical value of growth-curve parameters in breeding, nutritional evaluation, and sustainable poultry production systems (Moula & Detilleux, 2019; Krongdang et al., 2025).
5. Conclusion
The VB model provided the most appropriate description of individual growth trajectories in Thai indigenous chickens. Inclusion of 15% CM significantly reduced the asymptotic parameter ( A ) and integration constant ( B ), while increasing the estimated growth-rate parameter ( k , week−1), indicating modifications in the fitted growth trajectories and their temporal progression. No significant breed × feed interactions were detected, suggesting that the effects of cricket meal supplementation on estimated growth-curve parameters were broadly consistent across BT and NK chickens. These findings demonstrate that cricket meal supplementation can influence estimated growth trajectories and growth-curve parameters derived from nonlinear modeling, highlighting the value of growth-curve analysis as a complementary approach for evaluating alternative protein sources in indigenous poultry production systems.
Acknowledgments
The authors gratefully acknowledge the Tropical Animal Genetic Special Research Unit (TAGU), Department of Animal Science, Faculty of Agriculture, Kasetsart University, for technical assistance, facilities, and logistical support during animal management and data collection.
Funding information
This research was funded by Kasetsart University through the Graduate School Fellowship Program and by the Kasetsart University Research and Development Institute under grant no. FF(KU)51.67.
Author contributions
Conceptualization, T.S. and S.K.; Methodology, T.S. and S.K.; Formal analysis, P.M. and S.K.; Investigation, P.M. and T.S.; Writing – original draft, P.M.; Writing – review and editing, P.M., S.K., and T.S.; and Supervision, S.K. and T.S. All authors have read and approved the final manuscript.
Conflict of interest statement
The authors declare that they have no competing interests related to this study.
Data availability statement
The data that support the findings of this study are available from the corresponding author upon reasonable request.