
Table 1
Effect of watery additives of pre/probiotics on water quality parameters of Nile tilapia reared under zero-water exchange for 84 days
| Items | Groups | P-value | ||||
|---|---|---|---|---|---|---|
| CA | CB | PRO | YUC | EMs | ||
| Temperature, °C | 27.75 ± 0.25 | 27.25 ± 0.55 | 27.65 ± 0.15 | 27.65 ± 0.35 | 27.80 ± 0.20 | 0.785 |
| pH | 8.17 ± 0.03 | 8.14 ± 0.02 | 8.16 ± 0.05 | 8.01 ± 0.12 | 8.14 ± 0.04 | 0.454 |
| Dissolved oxygen, mg/L | 6.80 ± 0.20 | 7.00 ± 0.20 | 7.00 ± 0.10 | 6.85 ± 0.35 | 6.90 ± 0.10 | 0.939 |
| Total ammonia, mg/L | 0.83 ± 0.06a | 0.59 ± 0.01b | 0.55 ± 0.02b | 0.48 ± 0.04b | 0.48 ± 0.05b | 0.007 |
| Unionized ammonia, mg/L* | 0.070 ± 0.001a | 0.050 ± 0.002b | 0.048 ± 0.001b | 0.041 ± 0.003c | 0.040 ± 0.001c | 0.001 |
| Nitrite, mg/L | 1.11 ± 0.08a | 0.83 ± 0.02ab | 0.72 ± 0.01ab | 0.65 ± 0.13bc | 0.42 ± 0.07c | 0.018 |
| TSS, mg/L | 247.00 ± 18a | 136.00 ± 4c | 166.00 ± 26bc | 191.50 ± 23.50abc | 209.50 ± 14.50ab | 0.054 |
Significant differences were determined at P ≤ 0.05 for means (± SE) in the same row with different superscript letters (a, b, c).
Control A (CA), fish were reared under unchanged water; Control B (CB), water exchange rate of 50% of tank volume weekly.
*Calculated according to Emerson et al. (1975).
Table 2
Effect of watery additives of pre/probiotics on growth and feeding utilization of Nile tilapia reared under zero-water exchange for 84 days
| Items | Groups | P-value | ||||
|---|---|---|---|---|---|---|
| CA | CB | PRO | YUC | EMs | ||
| Initial weight, g/fish | 20.96 ± 1.26 | 21.00 ± 1.32 | 20.77 ± 0.69 | 21.06 ± 1.16 | 21.06 ± 1.26 | 1.000 |
| Final weight, g/fish | 127.54 ± 0.87d | 145.01 ± 2.54c | 153.74 ± 2.98bc | 161.55 ± 0.93ab | 171.78 ± 4.81a | 0.001 |
| Weight gain, g/fish | 106.58 ± 0.39e | 124.01 ± 1.22d | 132.98 ± 2.29c | 140.49 ± 0.23b | 150.72 ± 3.55a | 0.000 |
| Daily weight gain, g/fish/day | 1.27 ± 0.01e | 1.48 ± 0.02d | 1.59 ± 0.03c | 1.68 ± 0.01b | 1.79 ± 0.05a | 0.000 |
| SGR, %/day | 2.16 ± 0.07c | 2.31 ± 0.06bc | 2.38 ± 0.01ab | 2.43 ± 0.06ab | 2.50 ± 0.04a | 0.028 |
| Feed intake, g feed/fish | 138.56 ± 1.57c | 157.51 ± 2.79b | 167.57 ± 4.22ab | 175.62 ± 1.69a | 181.66 ± 6.53a | 0.003 |
| FCR, g feed/g gain | 1.30 ± 0.01a | 1.27 ± 0.01ab | 1.26 ± 0.01ab | 1.25 ± 0.01b | 1.21 ± 0.02c | 0.015 |
| Survival rate, % | 91.67 ± 1.66b | 95.00 ± 1.67ab | 95.00 ± 1.67ab | 98.34 ± 1.67a | 98.34 ± 1.66a | 0.054 |
Significant differences were determined at P ≤ 0.05 for means (± SE) in the same row with different superscript letters (a, b, c).
Table 3
Effect of watery additives of pre/probiotics on hemato-biochemical indicators of Nile tilapia reared under zero-water exchange for 84 days
| Items | Groups | P-value | ||||
|---|---|---|---|---|---|---|
| CA | CB | PRO | YUC | EMs | ||
| RBCs (×106/mm3) | 1.43 ± 0.02c | 1.59 ± 0.03b | 1.76 ± 0.01a | 1.81 ± 0.02a | 1.81 ± 0.02a | 0.000 |
| Hb (g/dl) | 7.45 ± 0.07d | 9.65 ± 0.21c | 9.93 ± 0.04bc | 10.67 ± 0.25ab | 11.28 ± 0.39a | 0.001 |
| Hct (%) | 18.85 ± 0.95b | 24.80 ± 1.01a | 25.92 ± 0.36a | 26.52 ± 0.54a | 26.28 ± 0.87a | 0.004 |
| WBCs (×103/mm3) | 43.89 ± 0.68c | 54.91 ± 0.53b | 56.63 ± 0.76b | 68.76 ± 0.48a | 68.86 ± 1.59a | 0.000 |
| Glucose (mg/dl) | 130.00 ± 5.00 | 127.50 ± 2.50 | 123.00 ± 3.00 | 126.50 ± 1.50 | 123.00 ± 2.00 | 0.493 |
| AST (U/L) | 38.71 ± 0.95a | 34.47 ± 0.78b | 32.73 ± 0.54bc | 30.89 ± 1.01cd | 28.33 ± 0.49d | 0.003 |
| ALT (U/L) | 34.09 ± 0.48 | 35.29 ± 0.38 | 36.40 ± 0.58 | 36.44 ± 0.86 | 36.67 ± 1.84 | 0.409 |
| Uric acid (mg/dl) | 4.41 ± 0.14a | 3.37 ± 0.12b | 3.05 ± 0.16b | 2.29 ± 0.12c | 2.21 ± 0.08c | 0.000 |
| Urea (mg/dl) | 11.89 ± 1.37a | 9.61 ± 0.75a | 6.27 ± 0.68b | 5.58 ± 0.24b | 5.21 ± 0.09b | 0.006 |
| Creatinine (mg/dl) | 0.72 ± 0.02a | 0.64 ± 0.04ab | 0.55 ± 0.03bc | 0.51 ± 0.02c | 0.45 ± 0.04c | 0.006 |
Significant differences were determined at P ≤ 0.05 for means (±SE) in the same row with different superscript letters (a, b, c).
RBCs: red blood cells; Hb: hemoglobin; Hct: hematocrit; WBCs: white blood cells; AST: aspartate aminotransferase; ALT: alanine aminotransferase.
Table 4
Effect of watery additives of blood total protein and immunity indicators of Nile tilapia reared under zero-water exchange for 84 days
| Items | Groups | P-value | ||||
|---|---|---|---|---|---|---|
| CA | CB | PRO | YUC | EMs | ||
| Total protein (g/dl) | 4.16 ± 0.04d | 5.62 ± 0.19c | 6.69 ± 0.09b | 6.68 ± 0.07b | 7.28 ± 0.03a | 0.000 |
| Albumin (g/dl) | 2.39 ± 0.03d | 3.21 ± 0.05c | 3.37 ± 0.02b | 3.39 ± 0.03ab | 3.49 ± 0.02a | 0.000 |
| Globulin (g/dl) | 1.77 ± 0.02d | 2.41 ± 0.15c | 3.32 ± 0.07b | 3.29 ± 0.05b | 3.79 ± 0.02a | 0.000 |
| Serum IgM (µg/ml) | 4.02 ± 0.14c | 5.48 ± 0.36bc | 6.62 ± 0.37ab | 6.73 ± 0.55ab | 7.15 ± 0.58a | 0.018 |
| Lysozyme activity (U/ml) | 11.04 ± 0.19c | 12.91 ± 0.56b | 14.03 ± 0.09ab | 14.87 ± 0.34a | 15.03 ± 0.32a | 0.002 |
| Phagocytic activity (%) | 22.13 ± 1.31c | 26.47 ± 0.74b | 28.69 ± 0.56ab | 29.01 ± 0.55ab | 29.71 ± 0.84a | 0.007 |
| Phagocytic index (%)* | 1.12 ± 0.01d | 1.53 ± 0.02c | 1.60 ± 0.02b | 1.63 ± 0.01b | 1.79 ± 0.02a | 0.000 |
Significant differences were determined at P ≤ 0.05 for means (±SE) in the same row with different superscript letters (a, b, c).
*Phagocytic % = 100 × [Number of engulfing cells/Total number of phagocytic cells].
Table 5
Effect of watery additives of blood gases of Nile tilapia reared under zero-water exchange for 84 days
| Items | Groups | P-value | ||||
|---|---|---|---|---|---|---|
| CA | CB | PRO | YUC | EMs | ||
| Ammonia, µg/dl | 216.76 ± 1.81a | 201.81 ± 3.62ab | 194.64 ± 5.01bc | 180.52 ± 6.81c | 158.38 ± 3.41d | 0.002 |
| pH | 7.17 ± 0.01a | 7.14 ± 0.01ab | 7.13 ± 0.01b | 7.11 ± 0.01bc | 7.10 ± 0.01c | 0.017 |
| pCO2, mmHg | 30.18 ± 0.82a | 27.39 ± 0.97ab | 25.03 ± 0.65bc | 24.59 ± 0.76bc | 23.77 ± 0.62c | 0.010 |
| pO2, mmHg | 63.16 ± 2.18b | 71.92 ± 2.59ab | 72.69 ± 3.14ab | 73.34 ± 3.11a | 78.71 ± 1.19a | 0.054 |
| sO2,% | 79.38 ± 1.13c | 86.42 ± 1.06b | 89.38 ± 1.10ab | 90.16 ± 1.31ab | 91.42 ± 1.16a | 0.004 |
| HCO3 mmol/L | 10.77 ± 0.22 | 10.13 ± 0.09 | 9.99 ± 0.24 | 9.94 ± 0.28 | 9.97 ± 0.28 | 0.195 |
Significant differences were determined at P ≤ 0.05 for means (± SE) in the same row with different superscript letters (a, b, c).
Note: ammonia – NH3; pH – blood pH; pCO2 – partial pressure of carbon dioxide; pO2 – partial pressure of oxygen; sO2 – oxygen saturation; HCO3 – concentration of bicarbonate ions.
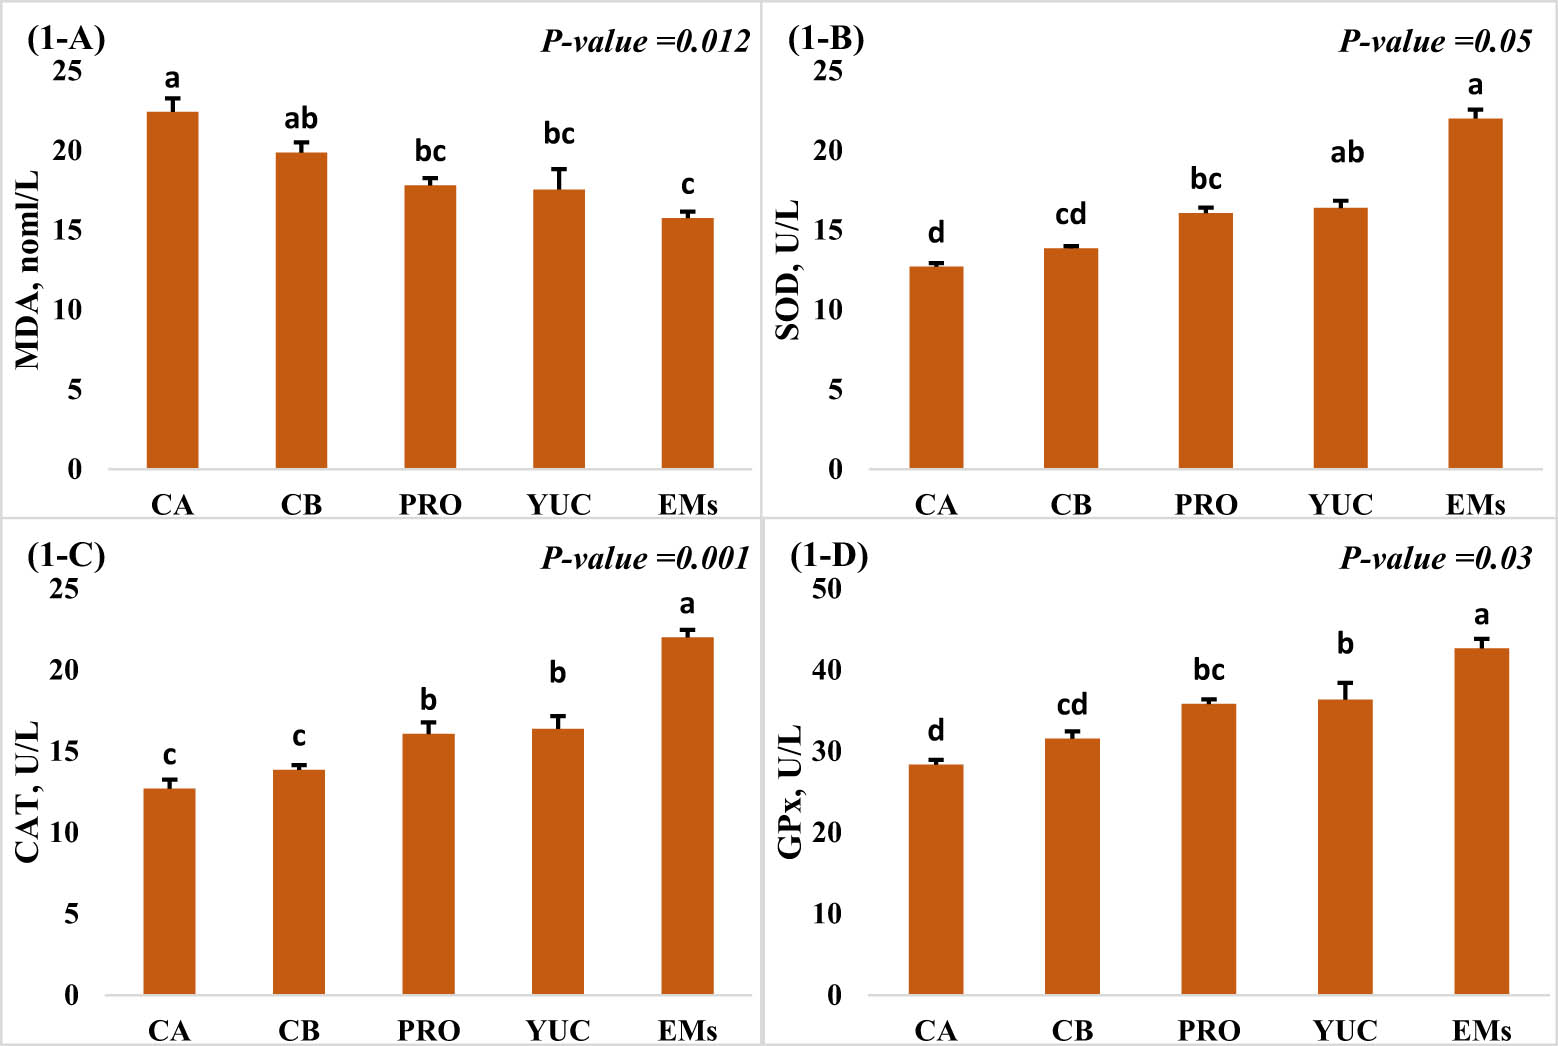
Figure 1
(A, B, C, and D) Effect of watery additives on antioxidant enzymes of Nile tilapia reared under zero-water exchange for 84 days. Significant differences were determined at P ≤ 0.05 for means (± SE) in bar chart with different superscript letters (a, b, c).
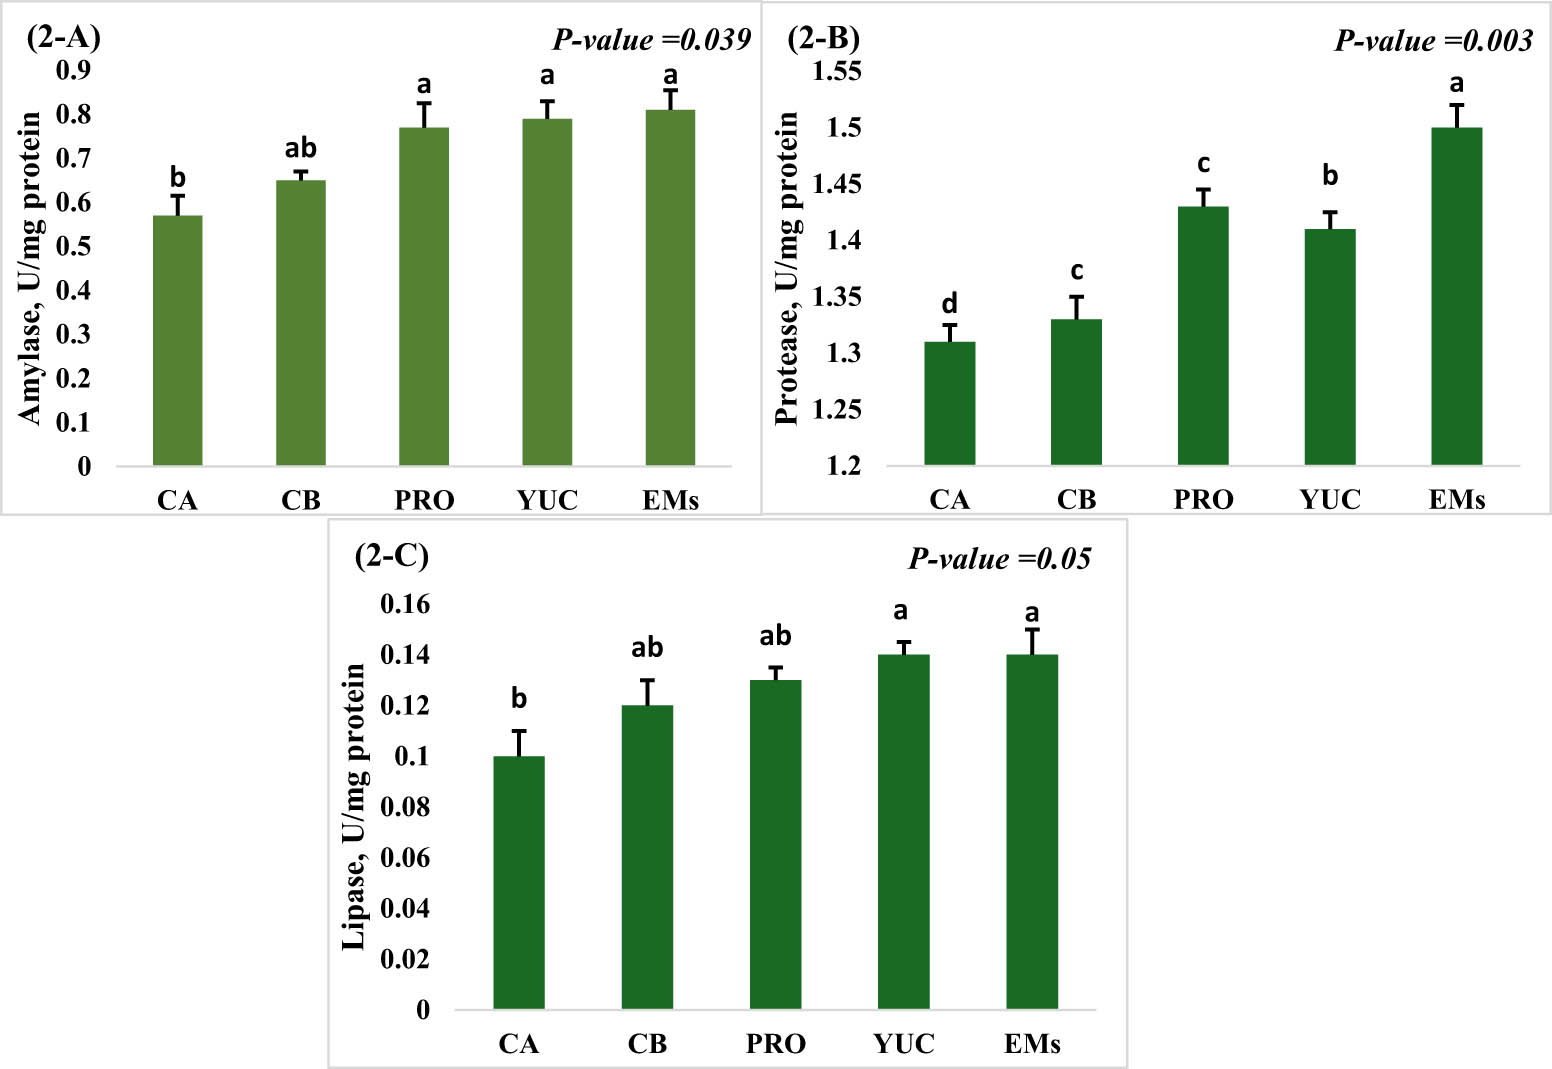
Figure 2
(A, B, and C). Effect of watery additives on intestinal digestive enzymes of Nile tilapia reared under zero-water exchange for 84 days. Significant differences were determined at P ≤ 0.05 for means (± SE) in bar chart with different superscript letters (a, b, c.).