
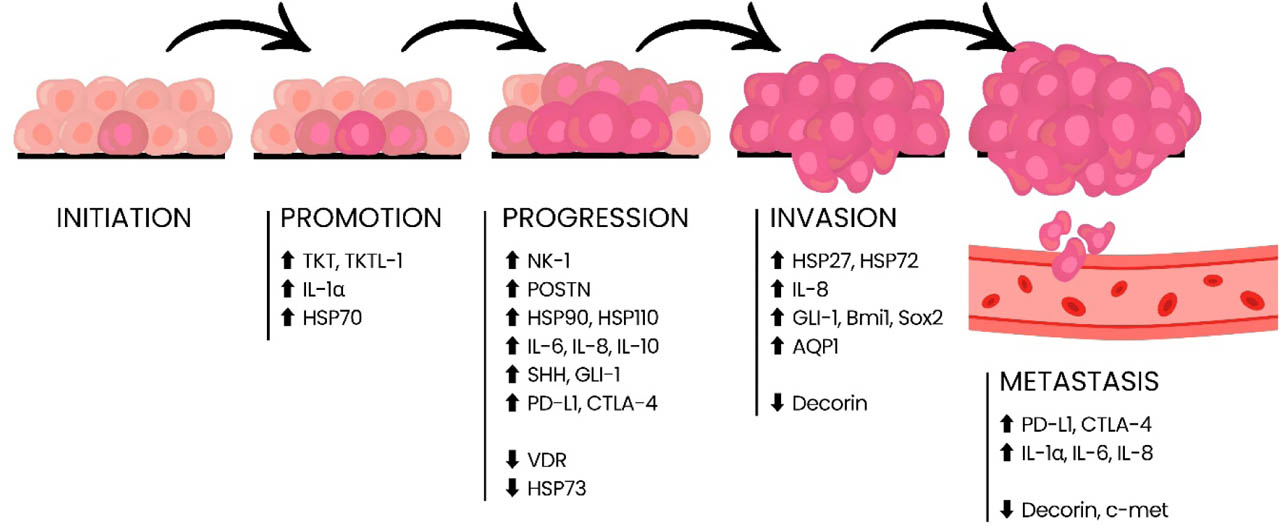
Figure 1.
Schematic representation of the development of malignant CMTs, together with the proteins associated with them, which are likely to be key to the given stage of carcinogenesis. The relationships between proteins and stages are suggested by the authors based on the evidence gathered in this review.
Table 1.
Summary of the collected study results of changes in protein concentrations and suggestion of their potential clinical use as CMTs blood biomarkers. More detailed data can be found in supplementary Table S1
| Group | Function | Full name | Short name | Change in concentration | Suggested clinical use of potential blood biomarker for assessment of | References |
|---|---|---|---|---|---|---|
| 1 | 2 | 3 | 4 | 5 | 6 | 7 |
| Proteins of the immune system | Interleukins are signalling proteins that coordinate innate and acquired immunity. They regulate the development, recruitment and activation of leukocytes. They also influence tissue repair and the resolution of inflammation. | Interleukin-1 | IL-1 | Higher in M than in N. | i.d. | Machado et al., 2015 |
| Interleukin-1α | IL-1α |
|
| Szczubiał et al., 2022; de Andrés et al., 2013 | ||
| Interleukin-6 | IL-6 |
|
| Ren et al., 2023; de Andrés et al., 2013; Szczubiał et al., 2018; Machado et al., 2015 | ||
| Interleukin-8 | IL-8 |
|
| Ren et al., 2023; de Andrés et al., 2013; Szczubiał et al., 2022 | ||
| Interleukin-10 | IL-10 |
|
| Ren et al., 2023; de Andrés et al., 2013; Szczubiał et al., 2018 | ||
| Chemokines are chemoattractant cytokines that orchestrate leukocyte trafficking and, in cancer, shape the tumour microenvironment by promoting cell migration, invasion, and angiogenesis through receptor-guided signalling. | Monocyte chemotactic protein 1 | CCL2 | Higher in MM than in N. | i.d. | Szczubiał et al., 2023 | |
| Stromal cell-derived factor 1 | CXCL12 | |||||
| Hedgehog signalling pathway protein | Hedgehog pathway proteins regulate tissue development and homeostasis by controlling proliferation, differentiation, and maintenance of stem cells. | Sonic hedgehog | SHH |
|
| |
| Glioma-associated oncogene 1 | GLI-1 |
|
| Koo et al., 2023 | ||
| Heat shock proteins | HSPs are stress-induced chaperone proteins that maintain proteostasis by assisting protein folding, stabilising proteins, and modulating apoptosis, cell cycle control, and signalling. | Heat shock protein 27 | HSP 27 |
| histological grade | Birdi et al., 2019 |
Table 2.
Summary of the collected study results of changes in protein expression and suggestion of their potential clinical use as CMTs tissue biomarkers. More detailed data can be found in supplementary Table S2.
| Group | Function | Full name | Short name | Change of expression | Suggested clinical use of potential tissue biomarker for assessment of | References |
|---|---|---|---|---|---|---|
| 1 | 2 | 3 | 4 | 5 | 6 | 7 |
| Proteins of the immune system | Interleukins are signalling proteins that coordinate innate and acquired immunity. They regulate the development, recruitment and activation of leukocytes. They also influence tissue repair and the resolution of inflammation. | Interleukin-6 | IL-6 |
|
| Ren et al., 2023; de Andrés et al., 2013 |
| Interleukin-8 | IL-8 |
|
| Ren et al., 2023; de Andrés et al., 2013 | ||
| Interleukin-10 | IL-10 |
|
| Ren et al., 2023; de Andrés et al., 2013 | ||
| Immune checkpoints are inhibitory pathways that restrain T-cell activity to maintain self-tolerance and limit immunopathology. |
| PD-L1 |
|
| Ariyarathna et al., 2020 | |
| Cytotoxic T-lymphocyte protein 4 | CTLA-4 | |||||
| Hedgehog signalling pathway protein | Hedgehog pathway proteins regulate tissue development and homeostasis by controlling proliferation, differentiation, and maintenance of stem cells. | Sonic hedgehog | SHH |
| tumour progression | Koo et al., 2023 |
| Glioma-associated oncogene 1 | GLI-1 |
|
| Koo et al., 2023 Liu et al., 2022 | ||
| Polycomb complex protein BMI-1 | Bmi1 | Higher in iM than in M and N. | tumour invasiveness | Liu et al., 2022 | ||
| Transcription factor Sox-2 | Sox2 | |||||
| Proteins of the extracellular matrix | The ECM proteins regulate adhesion, migration, proliferation and survival through integrin and growth factor signalling. | Periostin | POSTN |
|
| Borecka et al., 2020 a, b; Alani and Al-Biaty, 2024 |
| Decorin | DCN | Higher in nMM and B than in N and MM. |
| Szczubiał et al., 2020 | ||
| Heat shock proteins | HSPs are stress-induced chaperone proteins that maintain proteostasis by assisting protein folding, stabilising proteins, and modulating apoptosis, cell cycle control, and signalling. | Heat shock protein 27 | HSP27 |
| tumour invasiveness | Romanucci et al., 2006 |
| Heat shock protein 70 | HSP70 |
|
| Szczubiał et al., 2015 | ||
| Heat shock protein 72 | HSP72 |
| tumour invasiveness | Romanucci et al., 2006 | ||
| Heat shock protein 73 | HSP73 | Lower in M than in N. | i.d. | Romanucci et al., 2006 | ||
| Heat shock protein 90 | HSP90 | Higher in M than in N. | i.d. | Romanucci et al., 2006 | ||
| Heat shock protein 110 | HSP110 | Expression is dependent on tumour subtype and due to histological grade. |
| Okada et al., 2021 | ||
| Protein receptors | Protein receptors are cellular sensors that detect extracellular signals – soluble ligands, matrix components, or cell-to-cell signals and translate them into intracellular responses through diverse structures. By regulating pathways of proliferation, survival, differentiation, migration, and immunity, they coordinate tissue homeostasis. | Substance-P receptor/neurokinin-1 receptor | NK-1 |
| tumour progression | Song et al., 2020 |
| Vitamin D receptor | VDR |
|
| Sánchez-Céspedes et al., 2018, 2021 | ||
| Hepatocyte growth factor receptor | c-met |
|
| Chen et al., 2018 | ||
| Pentose phosphate pathway enzymes | The pentose phosphate pathway diverts glucose metabolism through oxidative and non-oxidative branches to generate NADPH (for antioxidant defence and reductive biosynthesis) and ribose-5-phosphate (for nucleotide synthesis). Cancer cells often up-regulate this pathway to buffer oxidative stress and sustain anabolic growth. | Transketolase | TKT |
|
| Burrai et al., 2017 |
| Transketolase-like 1 | TKTL-1 |
|
| Burrai et al., 2017 | ||
| Aquaporins | AQPs are cell membrane channel proteins that facilitate the rapid, selective transport of water (and in some cases also small solutes such as glycerol) across biological membranes, to maintain cellular water homeostasis by regulation of osmotic balance, cell volume and fluid flow in tissues. | Aquaporin 1 | AQP1 |
|
| Freeman et al., 2010; Fujimoto et al., 2024 |
| Aquaporin 3 | AQP3 | Lower due to higher histological grade. | histological grade | Fujimoto et al., 2024 | ||
| Aquaporin 5 | AQP5 | Absent in grade III samples. | histological grade | Fujimoto et al., 2024 |
[i] M – malignant tumour; iM – invasive malignant tumour; nM – non-invasive malignant tumour; MM – metastatic malignant tumour; nMM – non-metastatic malignant tumour; IMC – inflammatory mammary cancer; nIMC – non-inflammatory mammary cancer; B – benign tumour; N – normal (control); i.d. – insufficient data.
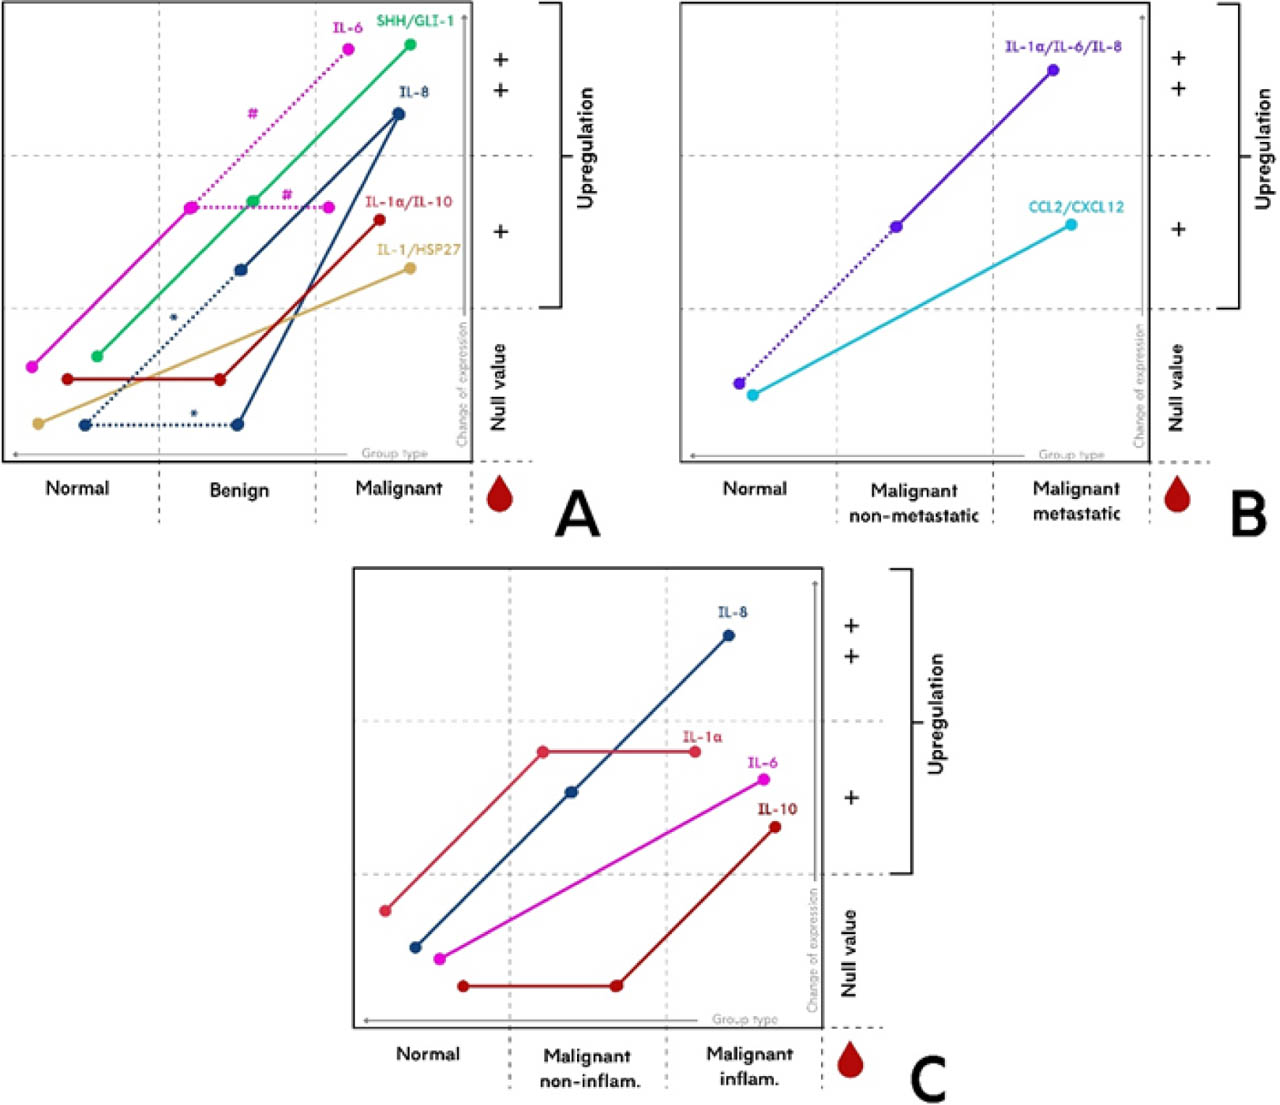
Figure 2.
Schematic representation of differences in concentrations of potential blood CMT bio-markers between groups. Colours denote expression patterns for individual proteins or grouped proteins that, in this review, showed a consistent upward regulation. The Y-axis reflects qualitative levels of change: + indicates overexpression relative to the reference level (Null value), and ++ indicates a higher-order overexpression relative to +. The X-axis presents the comparator groups between which expression differences were observed. Points mark the position of each group within a given pattern, and the connecting lines depict the trend in change across groups. Protein abbreviations are explained in Table 1. (A) Groups: normal (control), benign and malignant CMTs. Dashed lines indicate cases where concentrations are conflicting between groups; * denotes discrepancies between “Normal” and “Benign”, and # denotes discrepancies between “Benign” and “Malignant”. (B) Groups: normal (control), non-analysed. (C) Groups: normal (control), non-inflammatory and inflammatory CMTs.
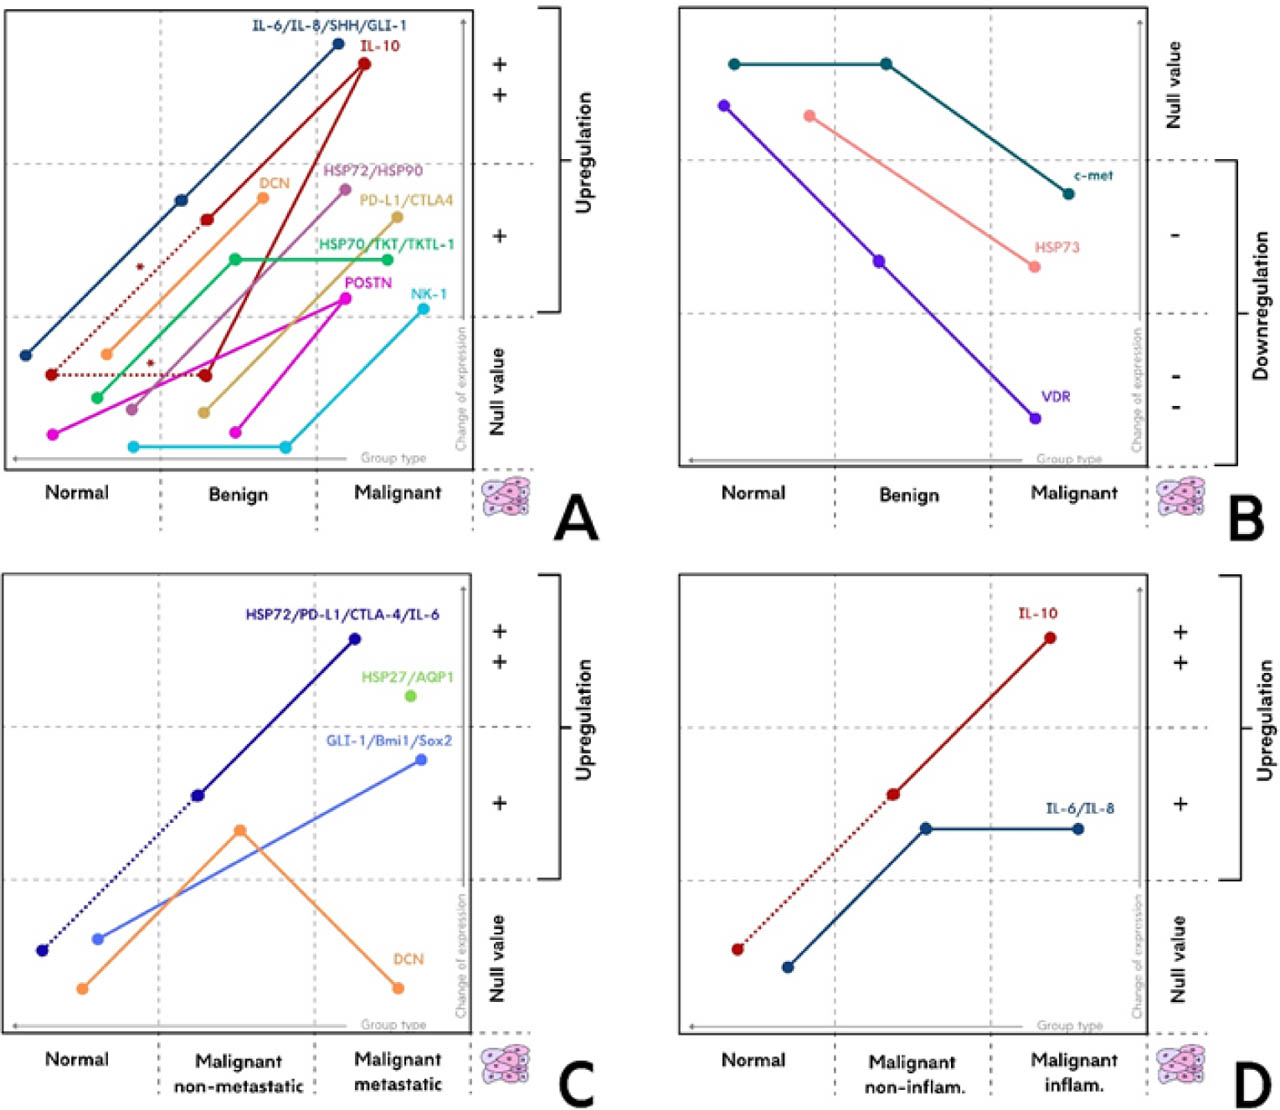
Figure 3.
Schematic representation of differences in expressions of potential tissue CMT biomarkers between groups. Colours denote expression patterns for individual proteins or grouped proteins that, in this review, showed a consistent upward regulation. The Y-axis reflects qualitative levels of change: +/− indicates up-/down-regulation relative to the reference level (Null value), and ++/−− indicates a higher-order up-/down-regulation relative to +/−. The X-axis presents the comparator groups between which expression differences were observed. Points mark the position of each group within a given pattern, and the connecting lines depict the trend in change across groups. The presence of a dot without a line means that the protein was identified only in this group, where it was not found in others. Protein abbreviations are explained in Table 2. (A) and (B) Groups: normal (control), benign and malignant CMTs. Dashed lines indicate cases where concentrations are conflicting between groups; * denotes discrepancies between “Normal” and “Benign” (C) Groups: normal (control), non-metastatic and metastatic CMTs. Dashed lines indicate that there was a difference in concentrations between normal and malignant (overall pool of malignant tumours) groups analysed. (D) Groups: normal (control), non-inflammatory and inflammatory CMTs. Dashed lines indicate that there was a difference in concentrations between normal and malignant (overall pool of malignant tumours) groups analysed.
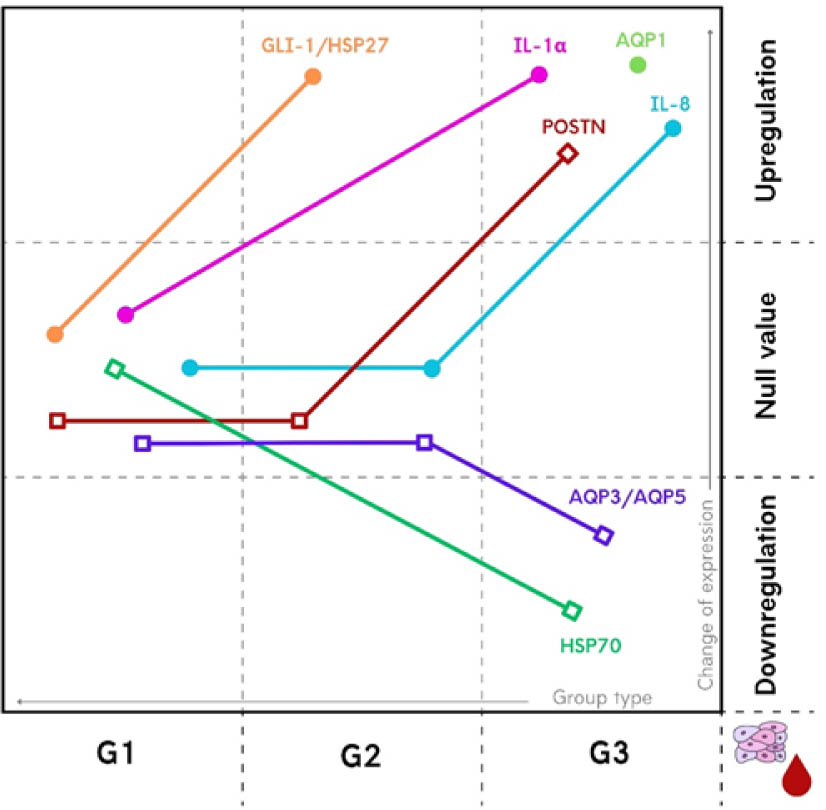
Figure 4.
Differences in concentration/expression of potential blood/tissue CMT biomarkers between tumours with different histological grade (G1, G2, G3). • – potential in blood; □ – potential in tissue. Colours denote expression patterns for individual proteins or grouped proteins that, in this review, showed a consistent change. The Y-axis reflects qualitative levels of change: up- or down-regulation relative to the reference level (Null value). The X-axis presents the comparator groups between which expression differences were observed. Points mark the position of each group within a given pattern, and the connecting lines depict the trend in change across groups. The presence of a dot without a line means that the protein was identified only in this group, where it was not found in others. Protein abbreviations are explained in Table 1 and Table 2.