
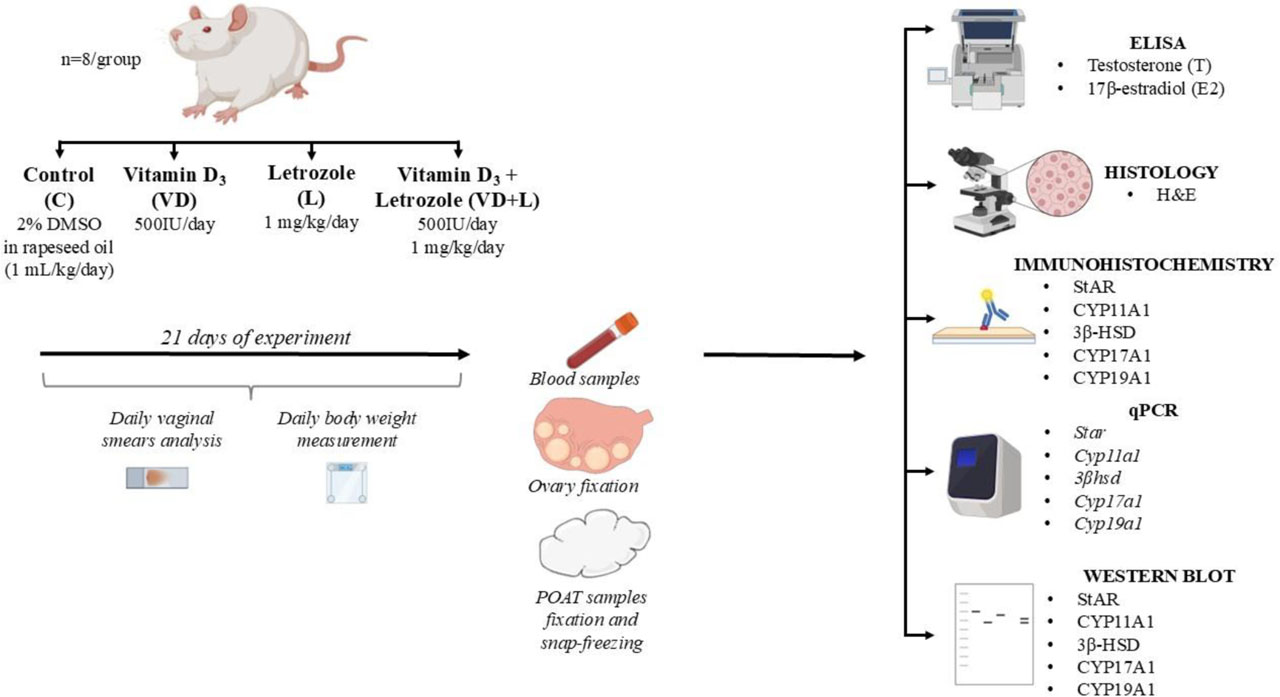
Figure 1.
Experimental design.
3β-HSD, 3β-hydroxysteroid dehydrogenase/Δ5-Δ4 isomerase; CYP11A1, cholesterol side-chain cleavage enzyme; CYP17A1, cytochrome P450 17α-hydroxylase/17,20-lyase; CYP19A1, cytochrome P450 aromatase ELISA, enzyme-linked immunosorbent assay; H&E, hematoxylin and eosin staining, POAT, periovarian adipose tissue; qPCR, quantitative polymerase chain reaction, StAR, steroidogenic acute regulatory protein
Table 1.
Primary antibodies used for Western blot (WB) and immunohistochemistry (IHC)
| Antibody | Serum | Host species | Supplier | WB dilution | IHC dilution | Secondary antibody |
|---|---|---|---|---|---|---|
| Anti-StAR | 5% NGS | Rabbit | Invitrogen, Carlsbad, CA, USA | 1:1000 | 1:50 | Goat anti-rabbit IgG |
| cat. no. PA5-10685 | ||||||
| Anti-CYP11A1 | 5% NGS | Rabbit | Proteintech, Chicago, IL, USA | 1:1000 | 1:200 | Goat anti-rabbit IgG |
| cat. no. 13363-1-AP | ||||||
| Anti-3β-HSD | 5% NHS | Mouse | Abcam, Cambridge, UK | 1:2000 | 1:200 | Horse anti-mouse IgG |
| cat. no. ab55268 | ||||||
| Anti-CYP17A1 | 5% NGS | Rabbit | Invitrogen, Carlsbad, CA, USA | 1:2000 | 1:50 | Goat anti-rabbit IgG |
| cat. no. MA5-38357 | ||||||
| Anti-CYP19A1 | 10% NHS | Mouse | AbD Serotec, Milan, Italy | 1:250 | 1:50 | Horse anti-mouse IgG |
| cat. no. MCA2077S | ||||||
| GAPDH | - | Rabbit | Proteintech, Chicago, IL, USA | 1:5000 | - | Goat anti-rabbit IgG |
| cat. no. 10494-1-AP |
[i] Abbreviations: 3β-HSD, 3β-hydroxysteroid dehydrogenase/Δ5-Δ4 isomerase; CYP11A1, cholesterol side-chain cleavage enzyme; CYP17A1, cytochrome P450 17α-hydroxylase/17,20-lyase; CYP19A1, cytochrome P450 aromatase; GAPDH, glyceraldehyde-3-phosphate dehydrogenase; NGS, normal goat serum; NHS, normal horse serum; StAR, steroidogenic acute regulatory protein.
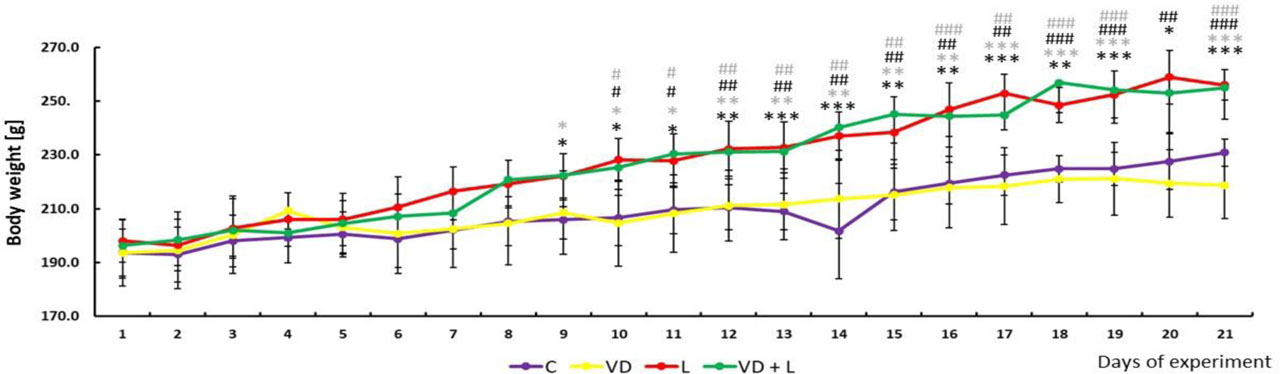
Figure 2.
Daily changes in body weight during the course of 21-day experiment in the control (C; purple line), vitamin D3-treated (VD; yellow line), letrozole-treated (L; red line), and both vitamin D3- and letrozole-treated (VD+L; green line) female rats. Values are expressed as mean ± standard deviation (SD). One-way ANOVA followed by Tukey post hoc test (*,# P<0.05; **,## P<0.01; ***,### P<0.001). Statistically significant differences between groups are denoted as: * C vs. L; * C vs. VD+L; # VD vs. L; # VD vs. VD+L
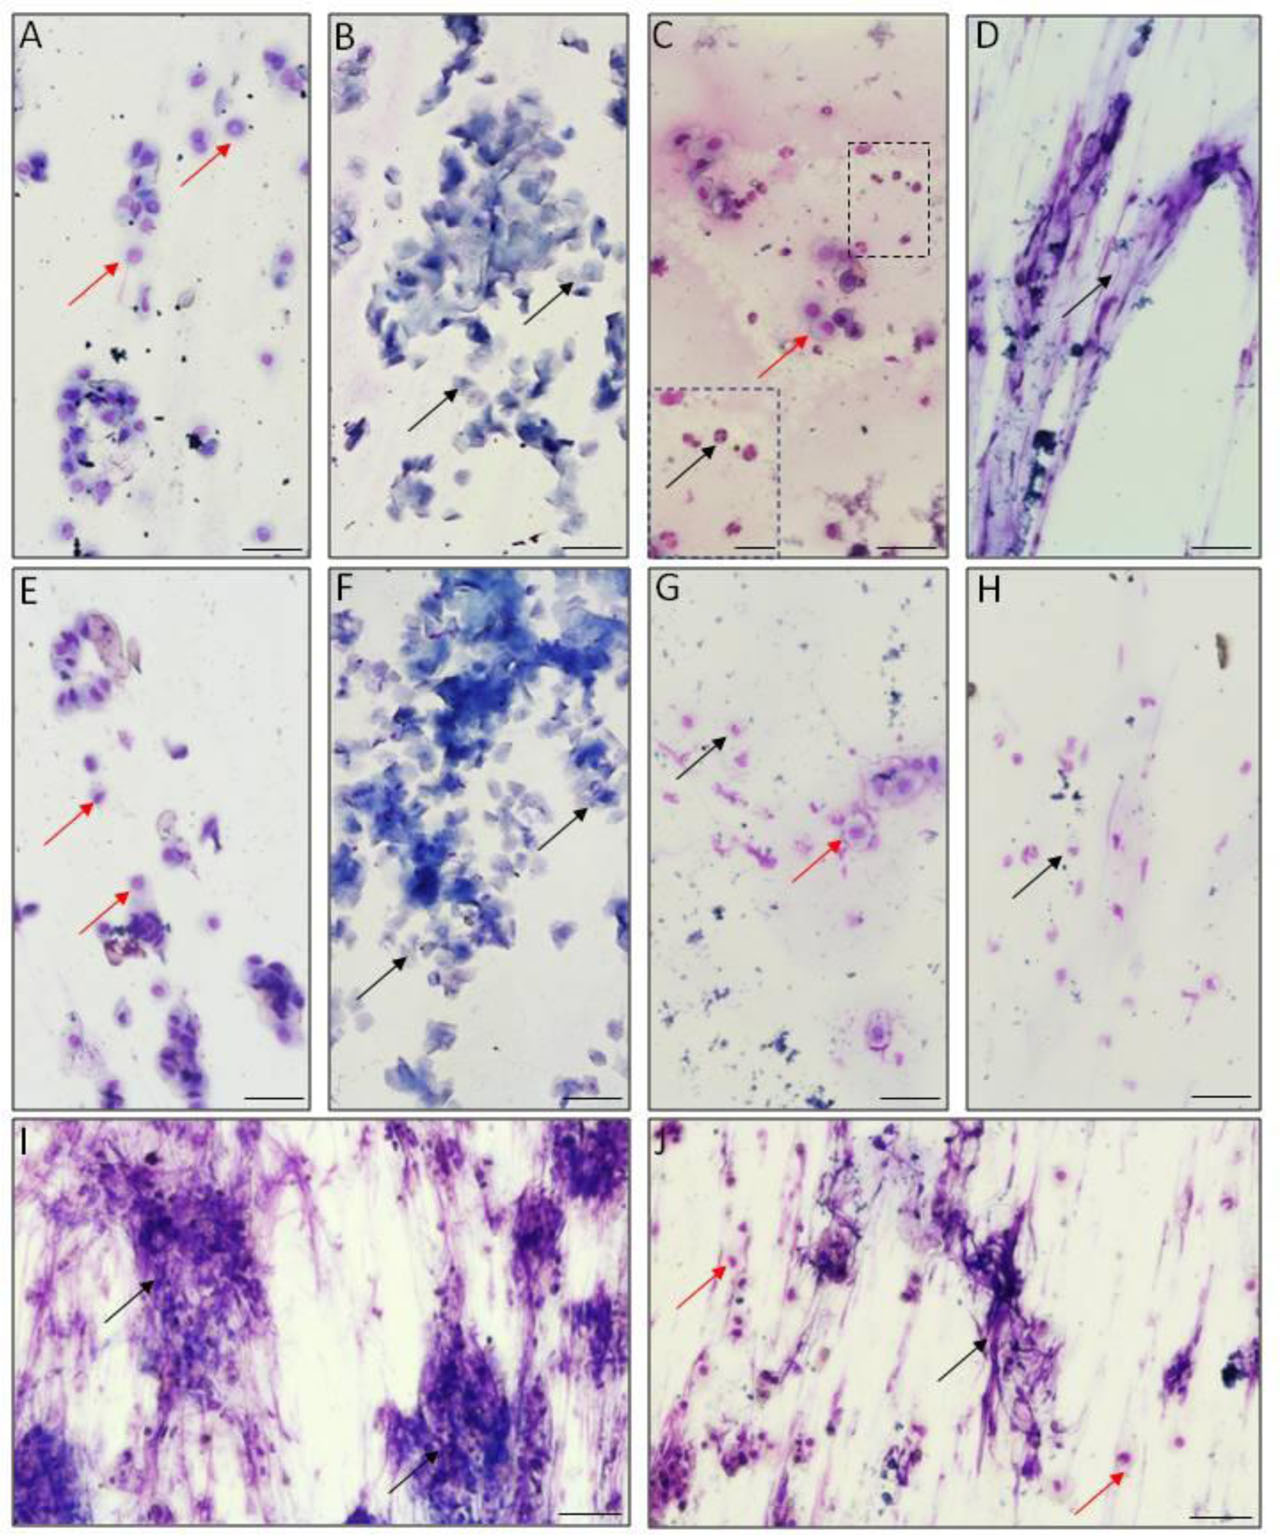
Figure 3.
Representative vaginal smears stained with May-Grünwald and Giemsa method from control (A-D), vitamin D3-treated (E-H), letrozole-treated (I), and both vitamin D3- and letrozole-treated (J) female rats. In the control and vitamin D3-treated groups, all phases of the estrous cycle were observed within the experiment duration: proestrus (A and E, respectively), estrus (B and F, respectively), metestrus (C and G, respectively) and diestrus (D and H, respectively). In both groups with induced polycystic ovary syndrome, animals became acyclic (I and J, respectively). Scale bar = 50 μm
A: → live epithelial cells; B: → cornified epithelial cells; C: → live epithelial cells, → leukocytes; D: → mucus; E: → live epithelial cells; F: → cornified epithelial cells; G: → live epithelial cells, → leukocytes; H: → leukocytes; I → mucus; J: → live epithelial cells, → mucus
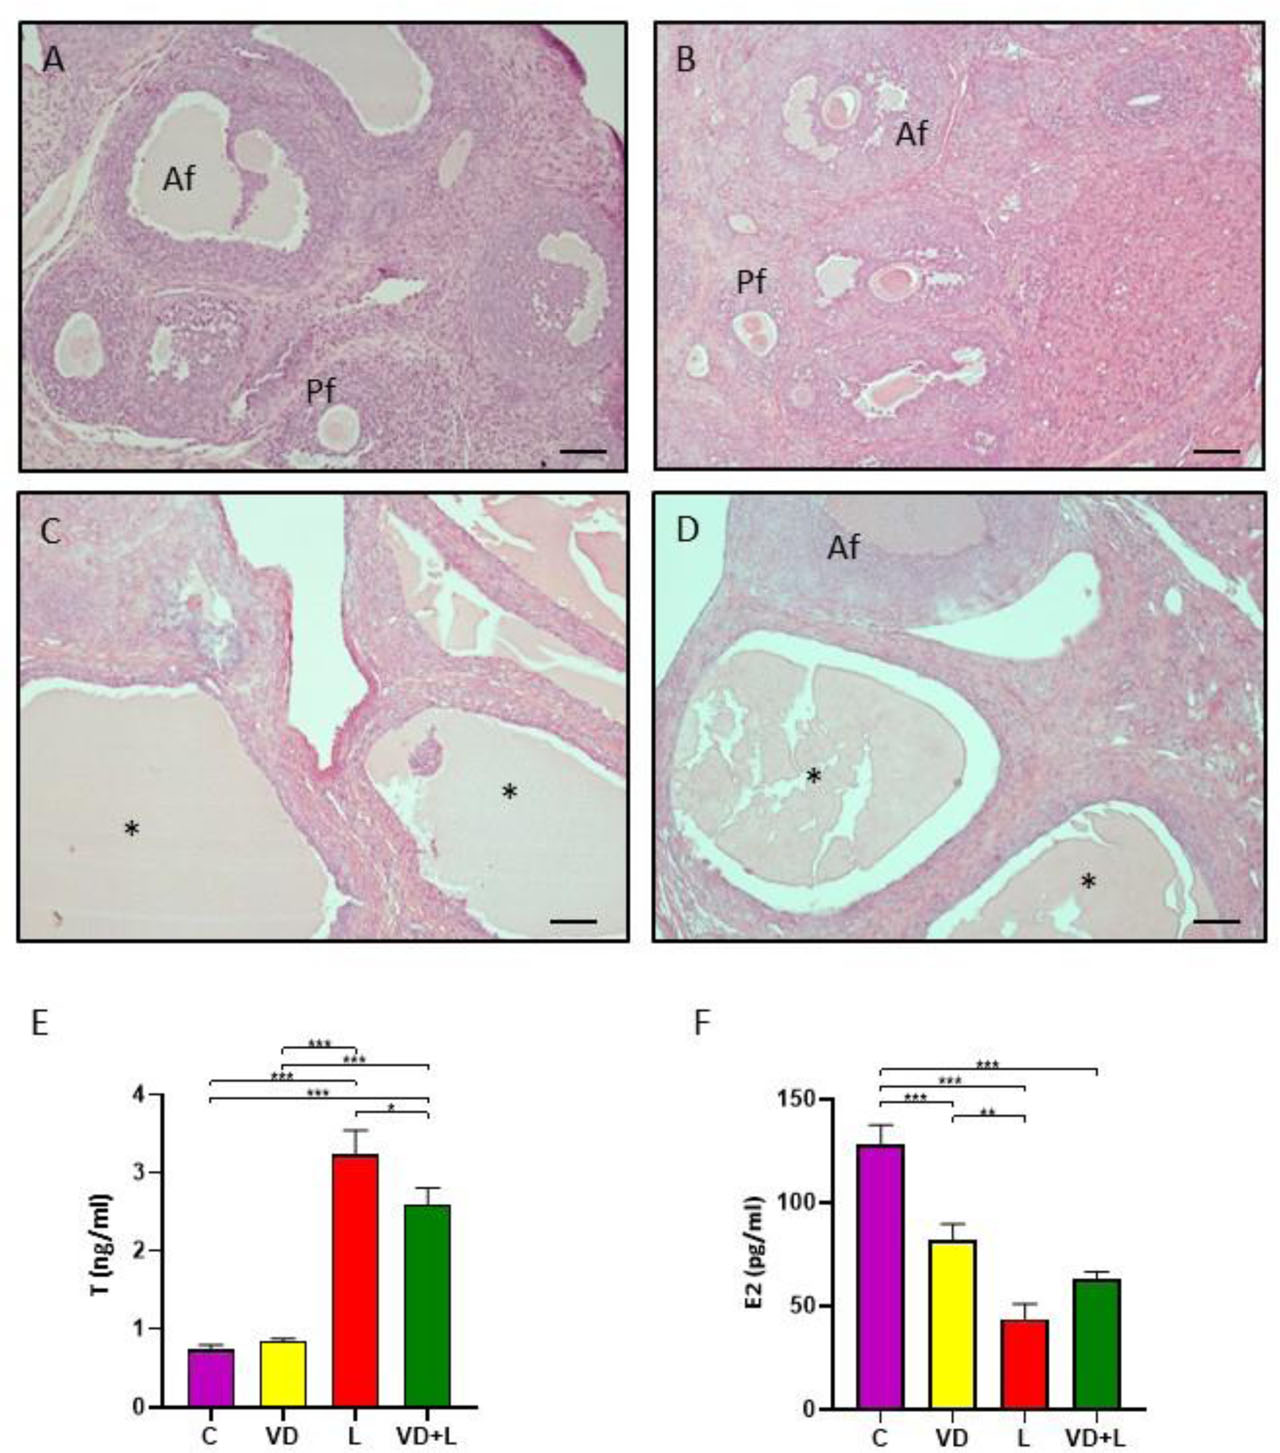
Figure 4.
Histology of ovaries obtained from control (A), vitamin D3-treated (B), letrozole-treated (C), and both vitamin D3- and letrozole-treated female rats. Af – antral follicle; Pf – preantral follicle; asterisks – ovarian cysts. Scale bar = 100 μm. Plasma concentrations of (E) testosterone (T) and (F) 17β-estradiol (E2) in the control (C), vitamin D3-treated (VD), letrozole-treated (L), and both vitamin D3- and letrozole-treated (VD+L) female rats. Values are expressed as mean ± standard deviation (SD). One-way ANOVA followed by Tukey post hoc test (*P<0.05, ** P<0.01, *** P<0.001)
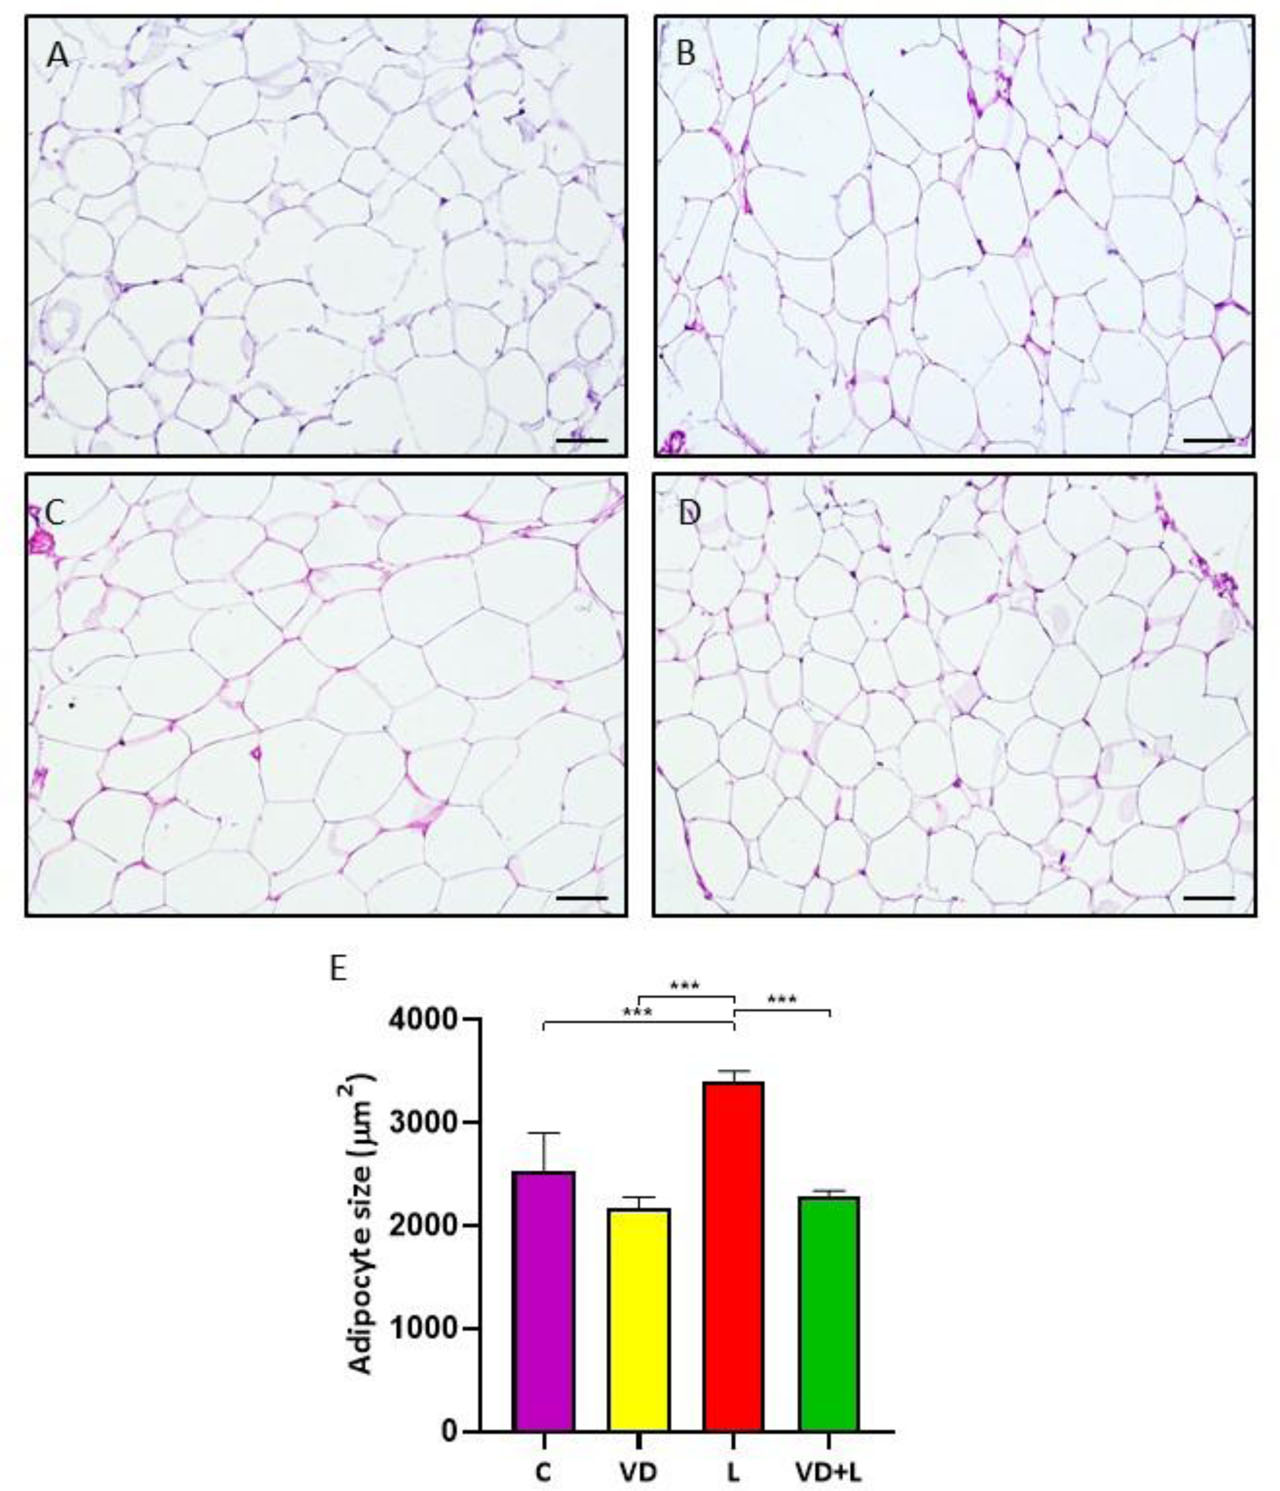
Figure 5.
Histology of periovarian adipose tissue obtained from control (A), vitamin D3-treated (B), letrozole-treated (C), and both vitamin D3- and letrozole-treated female rats. Chart (E) represents adipocyte size in each examined group. Values are expressed as mean ± standard deviation (SD). One-way ANOVA followed by Tukey post hoc test (***P<0.001). Scale bar = 50 μm
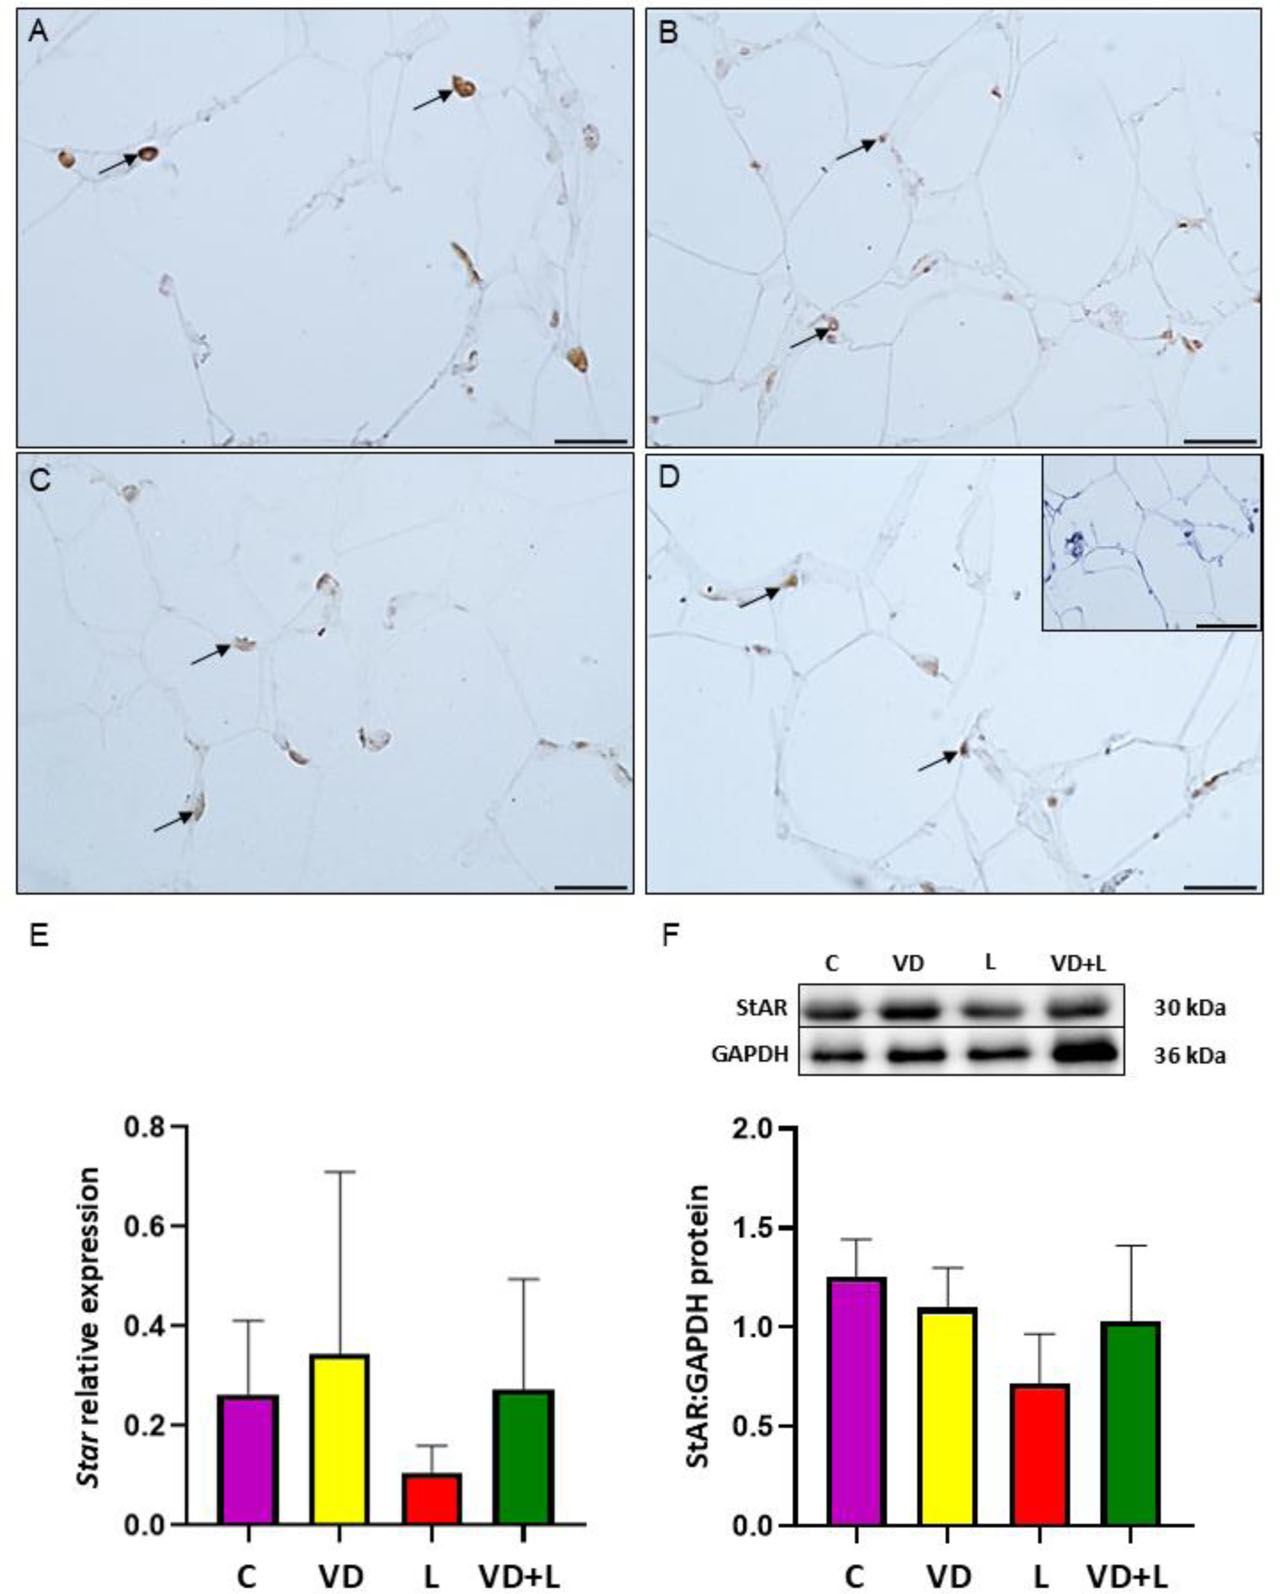
Figure 6.
Immunohistochemical localization of steroidogenic acute regulatory protein (StAR) in periovarian adipose tissue (POAT) in control group (A), vitamin D3-treated (B), letrozole-treated (C), and both vitamin D3- and letrozole-treated (D) groups. Positive immunoreaction is marked by arrows (→). Negative control (D inset). Scale bar = 25 μm or 50 μm for negative control. (E) Relative expression of Star mRNA transcript abundance in POAT. The mRNA level (quantitative real-time PCR) was expressed as the ratio relative to Gapdh (glyceraldehyde-3-phosphate dehydrogenase) and was presented as mean ± standard deviation (SD). (F) The abundance of StAR protein in POAT. Representative Western blots are shown. The relative protein abundance was examined by densitometry and expressed as the ratio relative to GAPDH. Each value represents the mean ± SD. One-way ANOVA followed by Tukey post hoc test (P<0.05)
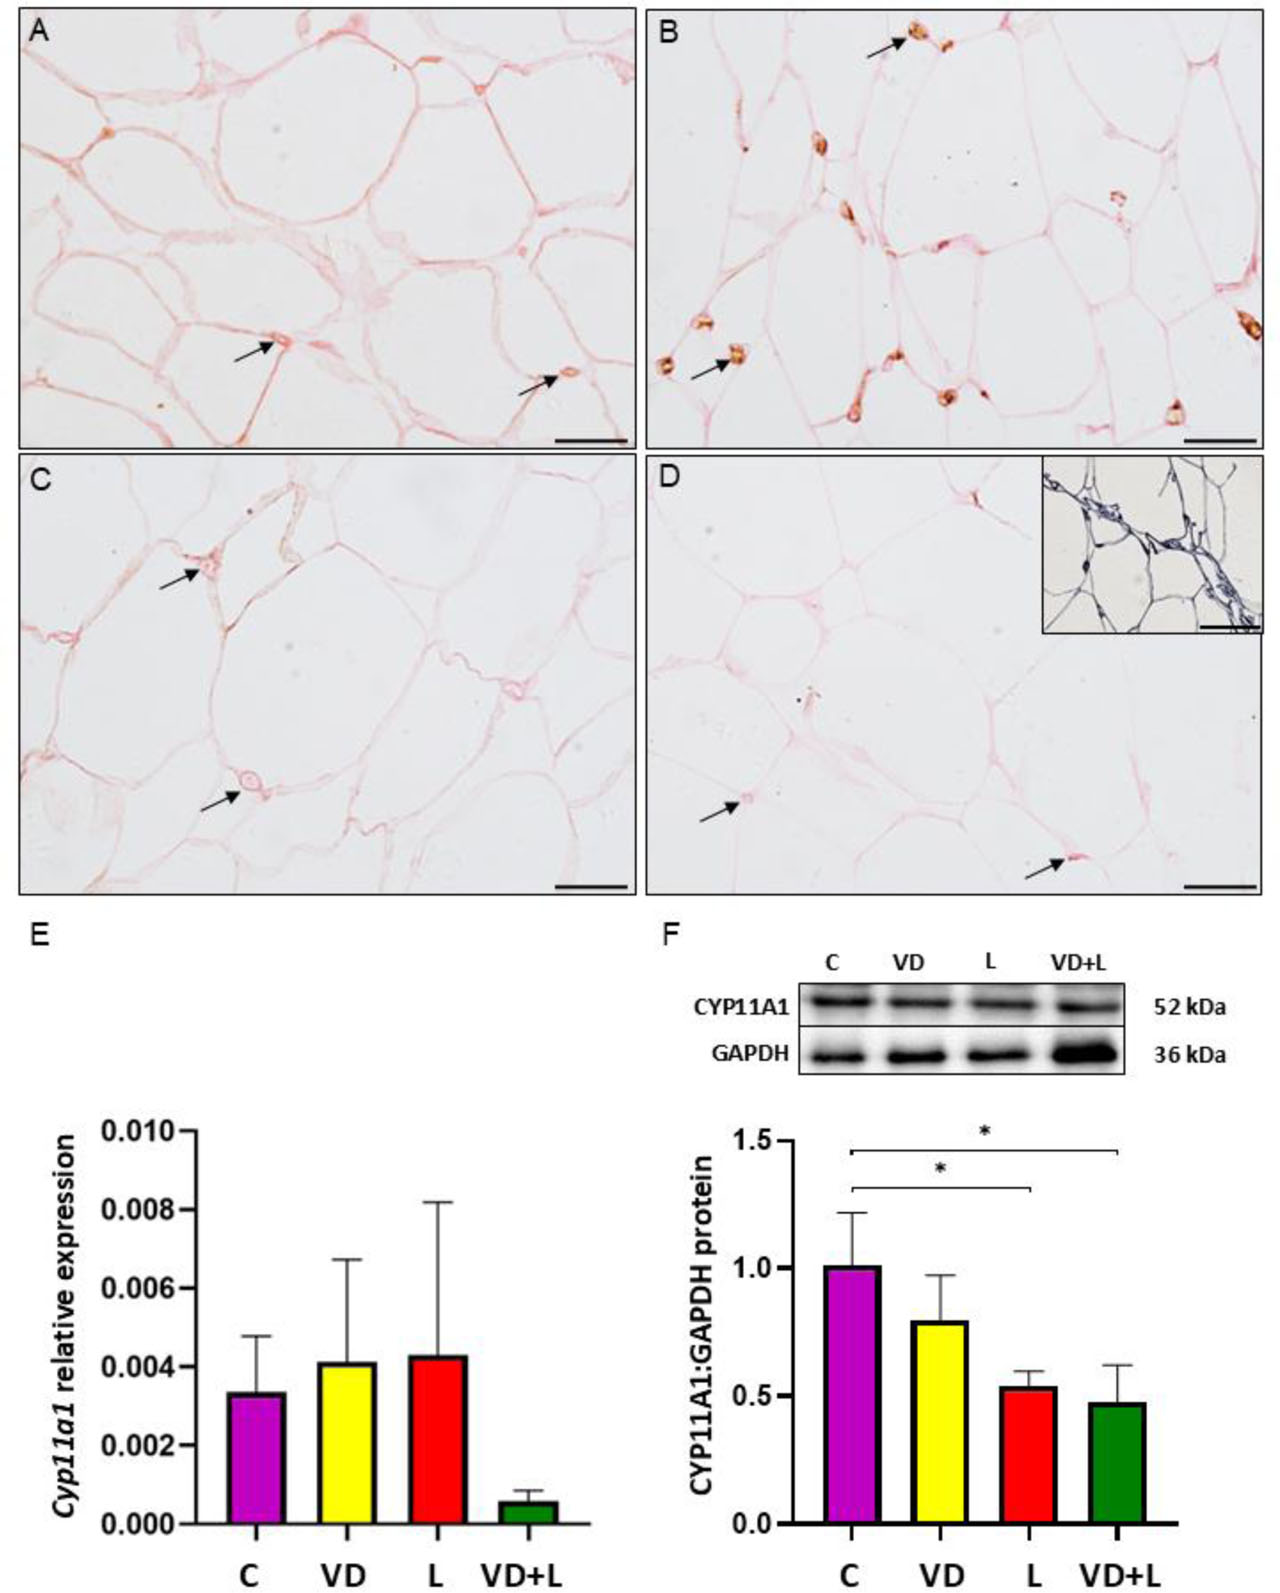
Figure 7.
Immunohistochemical localization of cholesterol side-chain cleavage enzyme (CYP11A1) in periovarian adipose tissue (POAT) in control group (A), vitamin D3-treated (B), letrozole-treated (C), and both vitamin D3- and letrozole-treated (D) groups. Positive immunoreaction is marked by arrows (→). Negative control (D inset). Scale bar = 25 μm or 50 μm for negative control. (E) Relative expression of Cyp11a1 mRNA transcript abundance in POAT. The mRNA level (quantitative real-time PCR) was expressed as the ratio relative to Gapdh (glyceraldehyde-3-phosphate dehydrogenase) and was presented as mean ± standard deviation (SD). (F) The abundance of CYP11A1 protein in POAT. Representative Western blots are shown. The relative protein abundance was examined by densitometry and expressed as the ratio relative to GAPDH. Each value represents the mean ± SD. One-way ANOVA followed by Tukey post hoc test (*P<0.05)
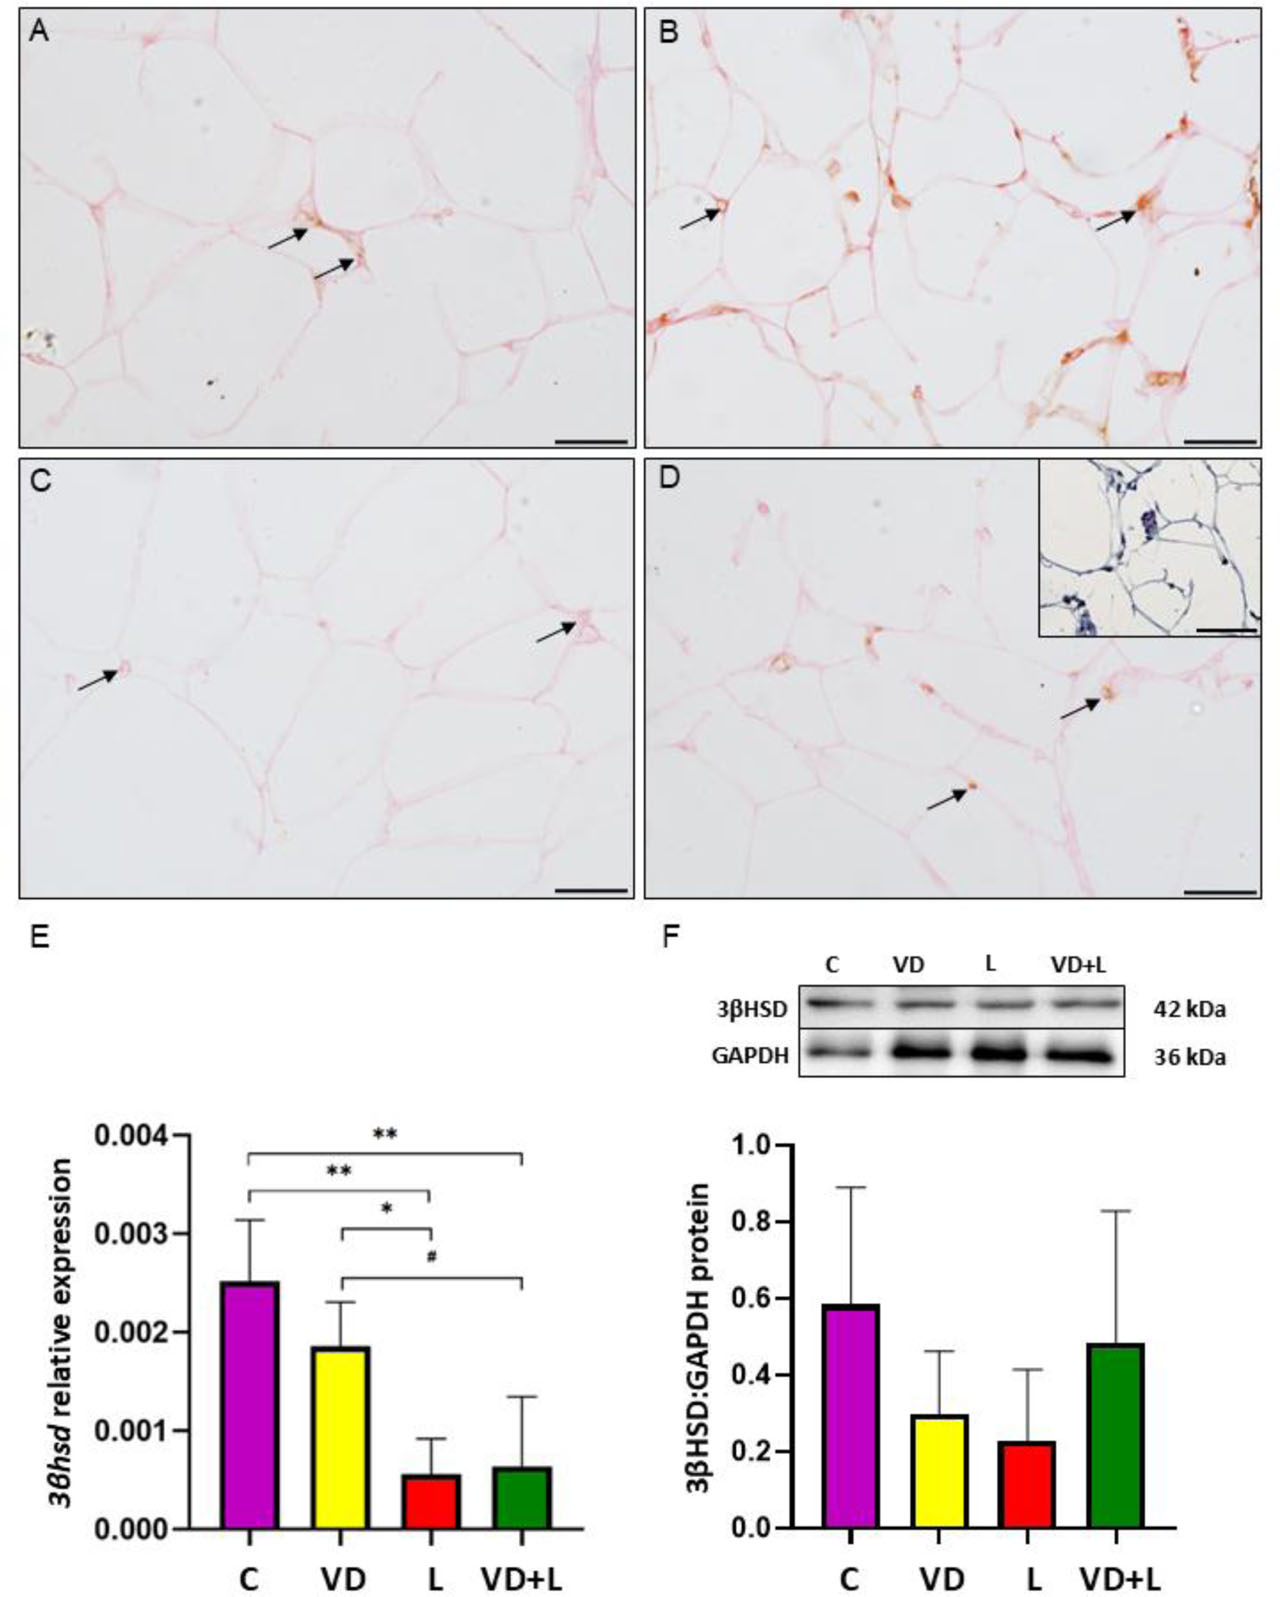
Figure 8.
Immunohistochemical localization of 3β-hydroxysteroid dehydrogenase/Δ5-Δ4 isomerase (3β-HSD) in periovarian adipose tissue (POAT) in control group (A), vitamin D3-treated (B), letrozole-treated (C), and both vitamin D3- and letrozole-treated (D) groups. Positive immunoreaction is marked by arrows (→). Negative control (D inset). Scale bar = 25 μm or 50 μm for negative control. (E) Relative expression of 3βhsd mRNA transcript abundance in POAT. The mRNA level (quantitative real-time PCR) was expressed as the ratio relative to Gapdh (glyceraldehyde-3-phosphate dehydrogenase) and was presented as mean ± standard deviation (SD). (F) The abundance of 3β-HSD protein in POAT. Representative Western blots are shown. The relative protein abundance was examined by densitometry and expressed as the ratio relative to GAPDH. Each value represents the mean ± SD. One-way ANOVA followed by Tukey post hoc test (*P<0.05, ** P<0.01)
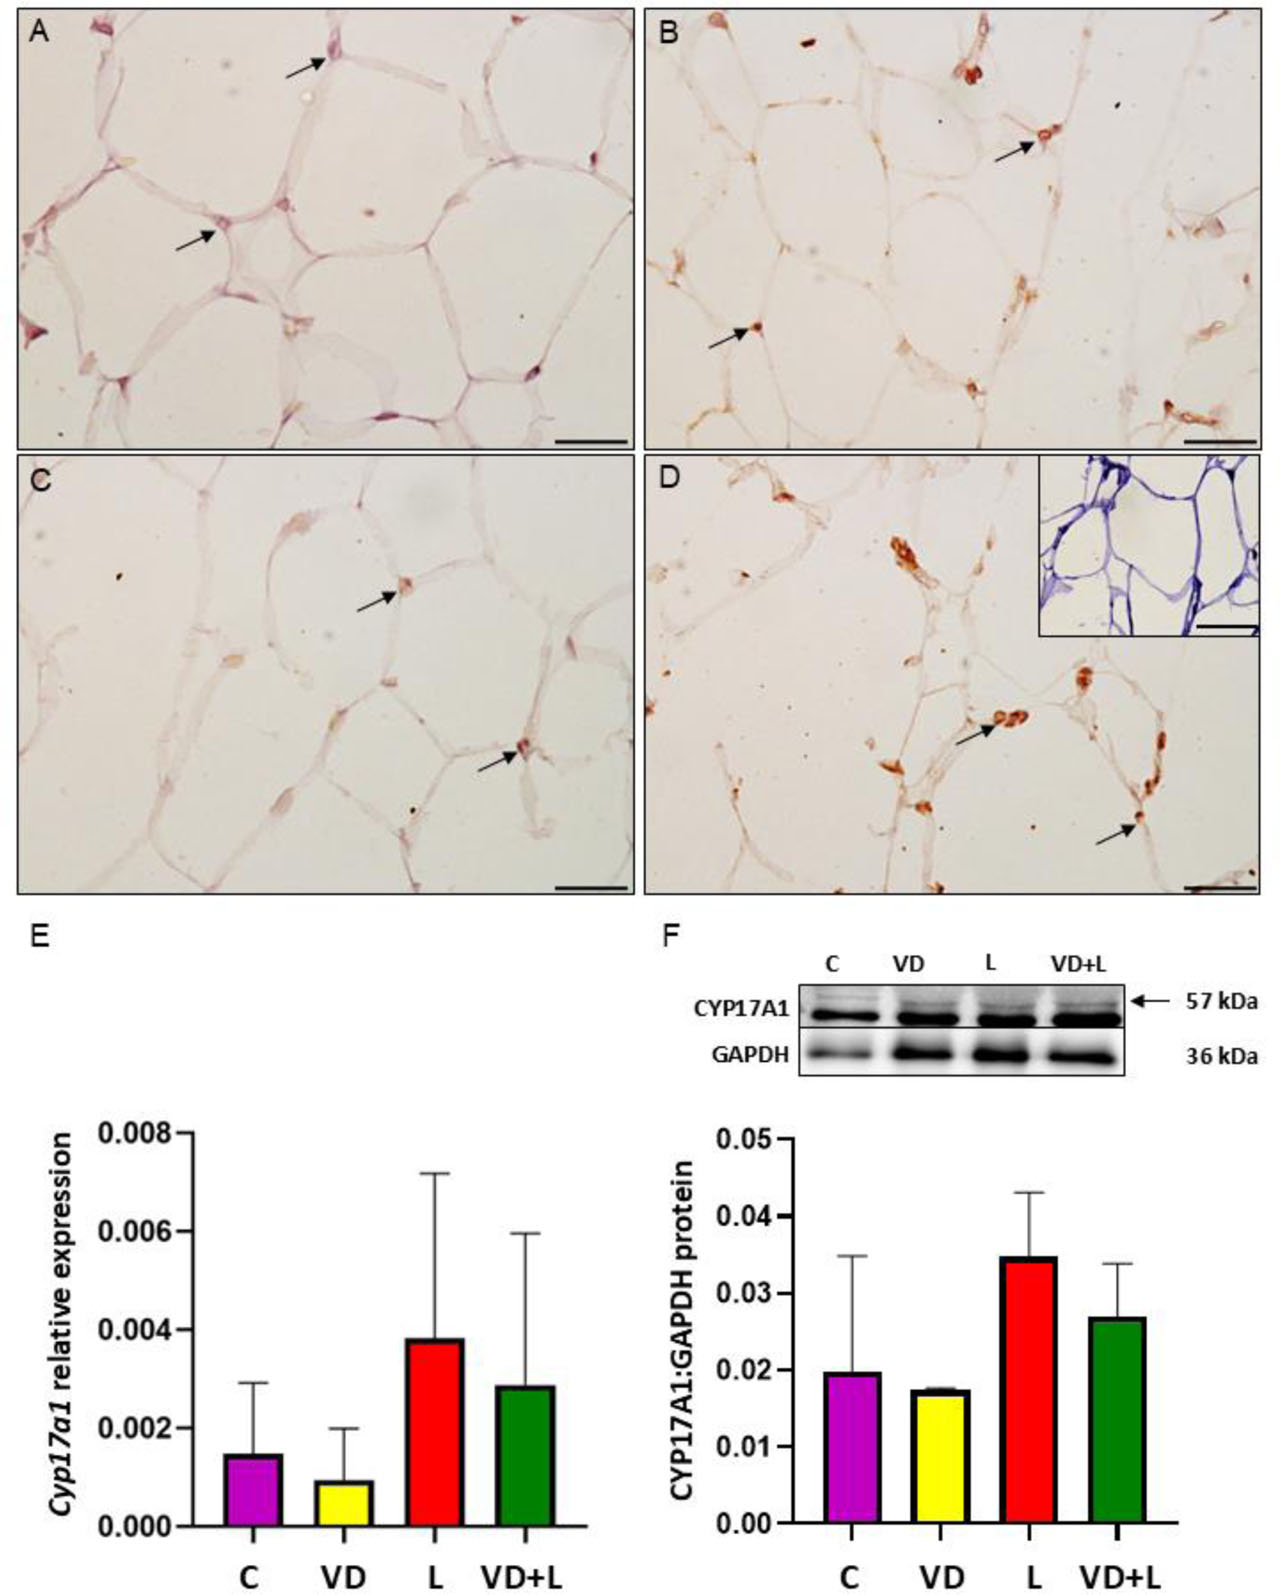
Figure 9.
Immunohistochemical localization of cytochrome P450 17α-hydroxylase/17,20-lyase (CYP17A1) in periovarian adipose tissue (POAT) in control group (A), vitamin D3-treated (B), letrozole-treated (C), and both vitamin D3- and letrozole-treated (D) groups. Positive immunoreaction is marked by arrows (→). Negative control (D inset). Scale bar = 25 μm or 50 μm for negative control. (E) Relative expression of Cyp17a1 mRNA transcript abundance in POAT. The mRNA level (quantitative real-time PCR) was expressed as the ratio relative to Gapdh (glyceraldehyde-3-phosphate dehydrogenase) and was presented as mean ± standard deviation (SD). (F) The abundance of CYP17A1 protein in POAT. Representative Western blots are shown. The relative protein abundance was examined by densitometry and expressed as the ratio relative to GAPDH. Each value represents the mean ± SD. One-way ANOVA followed by Tukey post hoc test (P<0.05)
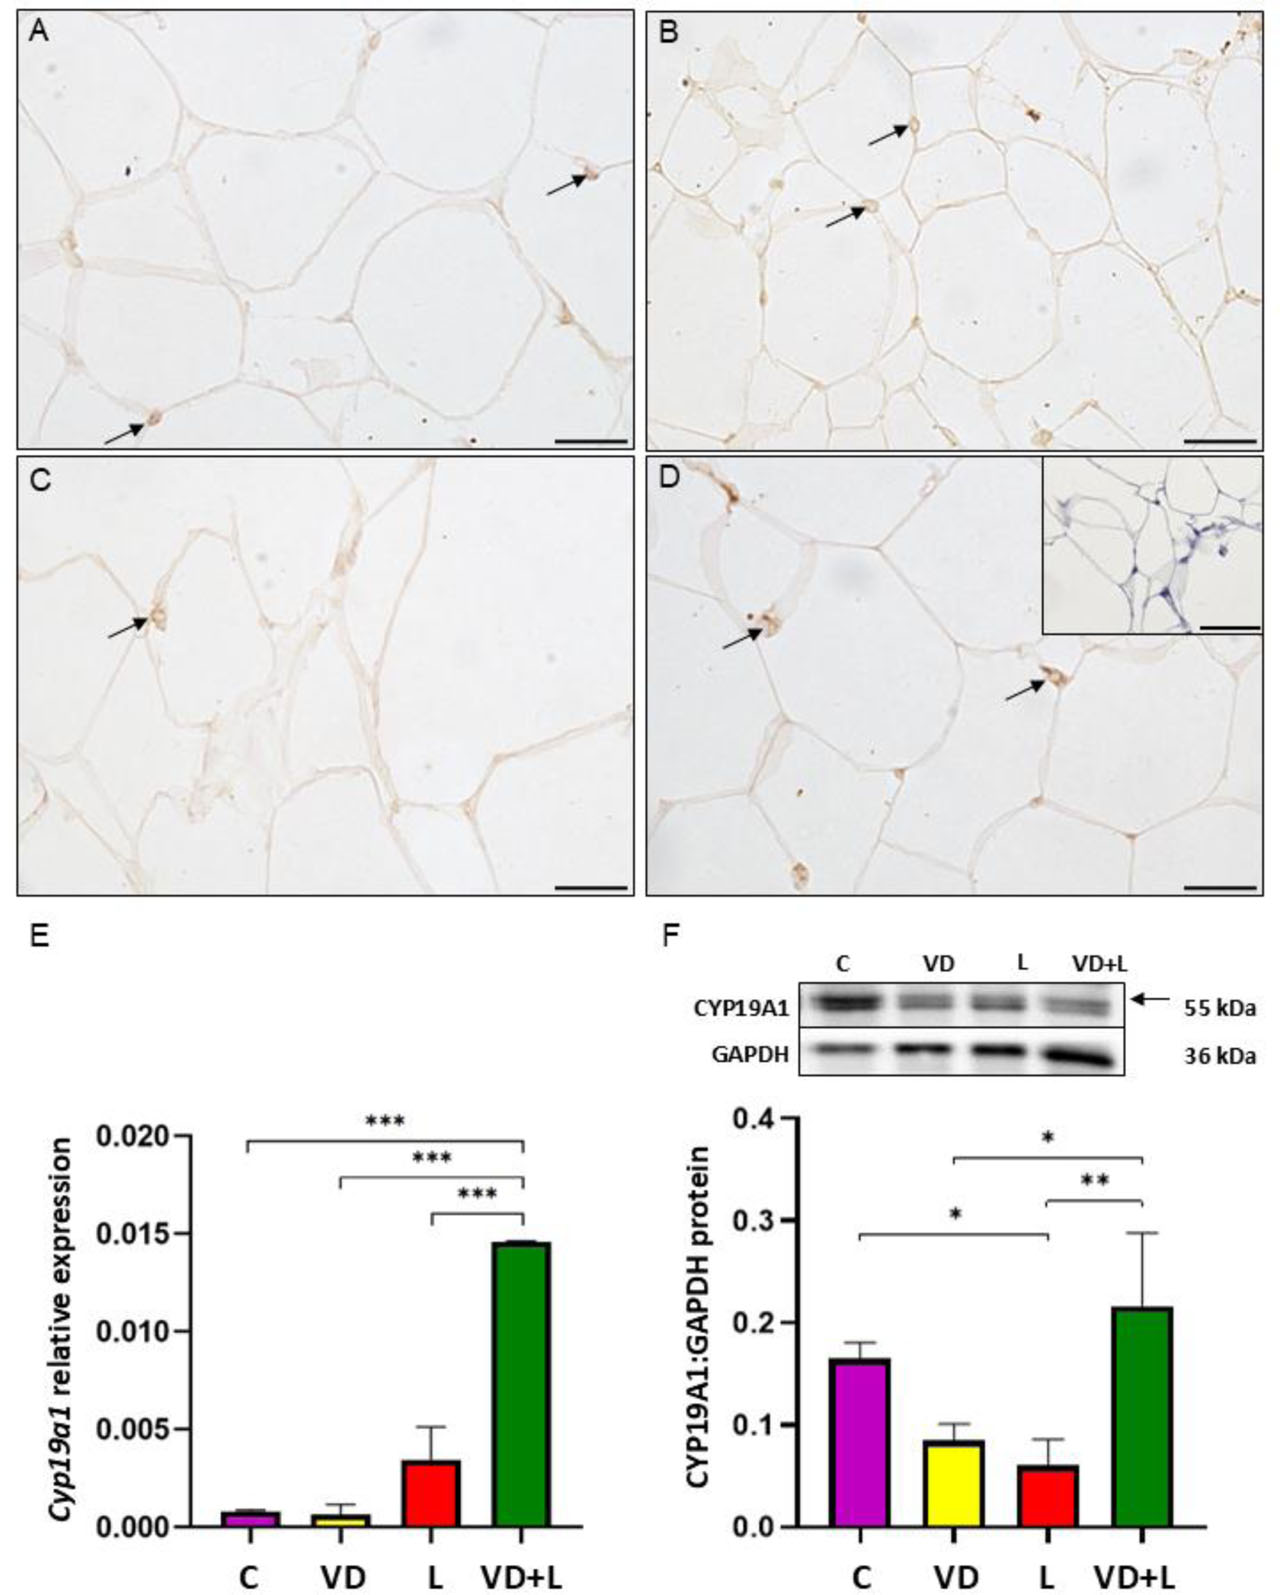
Figure 10.
Immunohistochemical localization of cytochrome P450 aromatase (CYP19A1) in periovarian adipose tissue (POAT) in control group (A), vitamin D3-treated (B), letrozole-treated (C), and both vitamin D3- and letrozole-treated (D) groups. Positive immunoreaction is marked by arrows (→). Negative control (D inset). Scale bar = 25 μm or 50 μm for negative control. (E) Relative expression of Cyp19a1 mRNA transcript abundance in POAT. The mRNA level (quantitative real-time PCR) was expressed as the ratio relative to Gapdh (glyceraldehyde-3-phosphate dehydrogenase) and was presented as mean ± standard deviation (SD). (F) The abundance of CYP19A1 protein in POAT. Representative Western blots are shown. The relative protein abundance was examined by densitometry and expressed as the ratio relative to GAPDH. Each value represents the mean ± SD. One-way ANOVA followed by Tukey post hoc test (* <0.05, ** P<0.01, *** P<0.001)