
Periovarian adipose tissue (POAT) is a type of white adipose tissue surrounding the ovary (Yang et al., 2022). This tissue produces a variety of adipokines, cytokines, chemokines, growth factors, and hormones, thereby influencing pivotal ovarian functions (Szyrzisko and Grzesiak, 2024). Studies on POAT-deficient mice have revealed disrupted folliculogenesis characterized by a reduced number of antral follicles, absence of corpora lutea, and increased follicular atresia (Yang et al., 2018), as well as altered expression of steroidogenic enzymes and subsequent changes in ovarian steroid production (Wang et al., 2017; Yang et al., 2018). Notably, the pro-inflammatory factors released by POAT can induce inflammation within the ovary, as demonstrated in obese mice (Nteeba et al., 2013; Wang et al., 2017). Thus, POAT forms a local microenvironment that plays an essential role in proper ovarian function.
Polycystic ovary syndrome (PCOS) is a common endocrinopathy, which affects women of reproductive age and leads to infertility (Azziz et al., 2016). The diagnostic criteria for PCOS include biochemical or clinical hyperandrogenism, oligo-/anovulation, and cystic ovarian morphology; several phenotypes can be distinguished based on these features (Helvaci and Yildiz, 2025). In addition to hormonal and reproductive symptoms, also metabolic disturbances such as obesity, dyslipidemia, hyperinsulinemia, insulin resistance, and type 2 diabetes mellitus are frequently associated with PCOS (Baba, 2025). The etiology of PCOS is therefore multifaceted, involving genetic, environmental, and endocrine components (Azziz et al., 2016). Recent studies have highlighted a crucial role of adipose tissue dysfunction in PCOS pathophysiology (Bril et al., 2023), although only a few have examined the morphological and functional impairment of POAT. Specifically, periovarian adipocytes in rats with letrozole-induced PCOS exhibited hypertrophy compared with healthy controls (Grzesiak et al., 2021). It has been shown that POAT can exacerbate ovarian inflammation in PCOS by increasing the secretion of pro-inflammatory cytokines such as tumor necrosis factor-α, C-reactive protein, interleukin-8, and interleukin-18 (Prabhu et al., 2021), as well as pro-inflammatory adipokines such as apelin, chemerin, and vaspin (Pich et al., 2025). However, no research has yet addressed potential alterations in other POAT processes, such as steroidogenesis, that may contribute to ovarian function during PCOS.
As aforementioned, hormonal disturbances in PCOS women are a predominant feature resulting from altered ovarian steroidogenesis (Helvaci and Yildiz, 2025). Among various therapeutic approaches, the ameliorative effect of vitamin D3 on steroidogenesis in granulosa cells has been demonstrated in both PCOS mice (Bakhshalizadeh et al., 2017, 2018) and women (Masjedi et al., 2020). Vitamin D3 is produced under ultraviolet B irradiation in the skin, where 7-dehydrocholesterol is transformed into pre-vitamin D3 (cholecalciferol). Cholecalciferol is subsequently hydroxylated in the liver to calcidiol, which is later converted in the kidneys to its active form, calcitriol. Calcitriol (1α,25(OH)2D3) influences the female reproductive organs, acting via its cognate receptors (nuclear VDR and membranous PDIA3), under both physiological and pathological conditions (Grzesiak et al., 2024). Because vitamin D3 deficiency has been observed in PCOS patients (van Tienhoven et al., 2025), as well as animal models (Grzesiak et al., 2021), its supplementation may represent an alternative strategy to improve reproductive parameters. Indeed, Behmanesh et al. (2019) showed the ability of vitamin D3 to restore normal folliculogenesis and ovulatory function in PCOS rats. In addition, our previous study revealed decreased expression of 1α-hydroxylase, the enzyme responsible for vitamin D3 bioactivation, in the ovary and POAT of PCOS-induced rats, which corresponded with reduced level of calcitriol in these tissues (Grzesiak et al., 2021). Taken together, the PCOS-associated reduction in vitamin D3 metabolism within POAT and the established impact of vitamin D3 on ovarian function lead us to hypothesize that vitamin D3 may affect the steroidogenic pathway in POAT, thereby improving overall hormonal balance during PCOS.
The present study was performed to determine the effect of vitamin D3 administration on steroidogenesis in POAT using a letrozole-induced PCOS rat model, which could help to clarify the potential contribution of this tissue to hormonal and reproductive alterations in PCOS. To achieve this we examined PCOS characteristics, POAT morphology, mRNA transcript and protein abundances for key steroidogenic molecules, as well as their immunolocalization in the POAT of control (C), vitamin D3-treated (VD), letrozole-treated (L), and vitamin D3- and letrozole-treated (VD+L) rats.
Material and methods
Experiment design
The study was performed under the approval of the 2nd Local Institutional Animal Care and Use Committee (ethics approval number 70/2021, Kraków, Poland) in accordance with the directives 2010/63/EU of the European Parliament (2010) and the Act on the Protection of Animals Used for Scientific or Educational Purposes (2015).
Six-week-old female Wistar rats (weighing 176.9 g±14.54 g) were obtained from the Faculty of Pharmacy at the Jagiellonian University Medical College (Kraków, Poland) and housed under standardized conditions, including temperature, humidity, and a 12-hour light/dark cycle, with unlimited access to food and water. The standard laboratory chow provided to all animals, contained approximately 800 IU of vitamin D3 per kilogram of diet, as specified by the manufacturer (Rodentia Basic, Agropol, Motycz, Poland). Given that adult female Wistar rats typically consume 15–20 g of chow per day, the estimated daily intake of vitamin D3 in the control group was approximately 12–16 IU per rat per day.
A total of 32 rats were randomly divided into four experimental groups (n=8 per each group): control (C), vitamin D3-treated (VD), PCOS-induced by letrozole (L), and PCOS-induced with vitamin D3 treatment (VD+L). All groups received the same vehicle to ensure consistency in solvent exposure. The vehicle consisted of 2% (v/v) dimethyl sulfoxide (DMSO; Sigma-Aldrich, St. Louis, MO, USA) diluted in rapeseed oil at a dose of 1 mL/kg/day. The treatment protocol lasted for 21 days and involved daily oral administration through gavage. The C group received a vehicle only, the VD group was given vitamin D3 (500 IU/day; Vigantol 20,000 IU/mL; P&G Health, GmbH, Germany) prepared in the same vehicle. The L group was treated with letrozole (1 mg/kg/day; a nonsteroidal aromatase inhibitor, Sigma-Aldrich), while the VD+L group received both letrozole and vitamin D3 prepared in the same vehicle solution (Figure 1). Doses were selected based on our prior research (Grzesiak et al., 2021; Pich et al., 2023; Kamińska et al., 2024). Animals in all groups were daily weighed and the estrous cycle phases were monitored by preparing vaginal epithelial cell smears. At the beginning of the study, animals exhibited various spontaneous phases of the estrous cycle. Tissues and blood were collected after 21 days of experiment. In the C and VD groups, samples were obtained during the naturally occurring proestrus phase, while in the PCOS-induced groups, samples were collected from acyclic animals. The induction of PCOS was verified through hyperandrogenism, the presence of ovarian cysts, irregular estrous cycle, and increased body weight as described in our established rat model (Grzesiak et al., 2021; Pich et al., 2023).
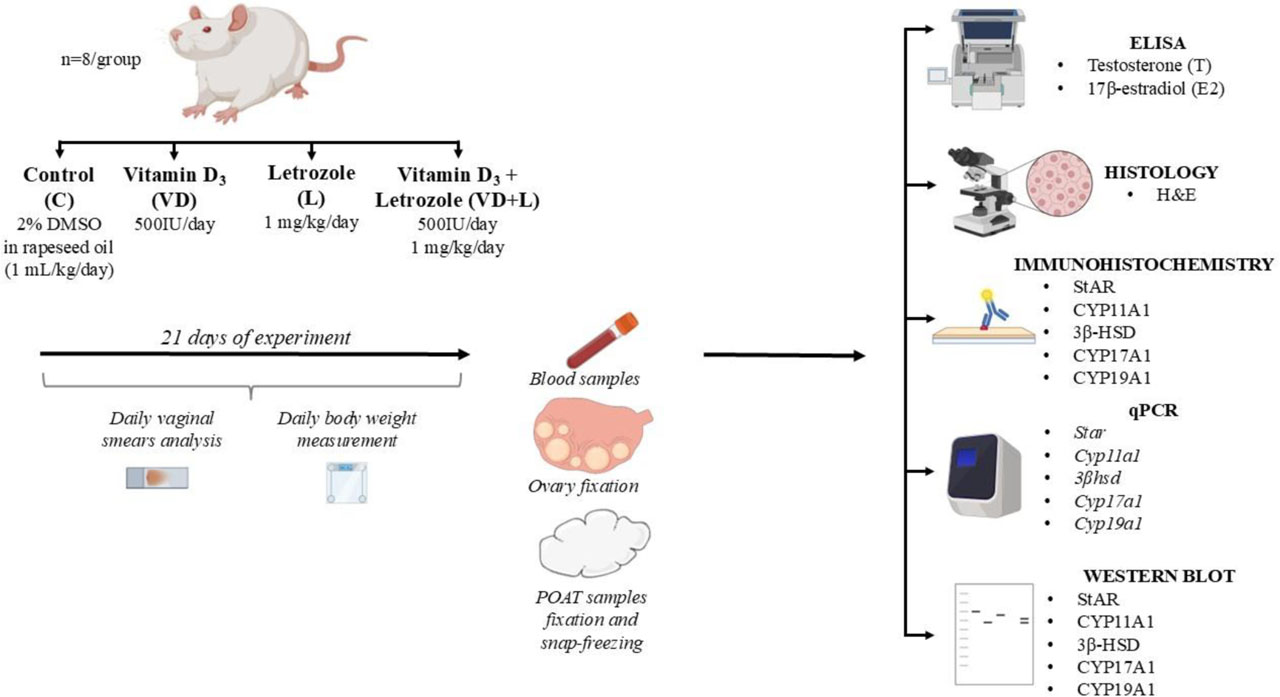
Figure 1.
Experimental design.
3β-HSD, 3β-hydroxysteroid dehydrogenase/Δ5-Δ4 isomerase; CYP11A1, cholesterol side-chain cleavage enzyme; CYP17A1, cytochrome P450 17α-hydroxylase/17,20-lyase; CYP19A1, cytochrome P450 aromatase ELISA, enzyme-linked immunosorbent assay; H&E, hematoxylin and eosin staining, POAT, periovarian adipose tissue; qPCR, quantitative polymerase chain reaction, StAR, steroidogenic acute regulatory protein
Vaginal smears analysis
To monitor the estrous cycle, vaginal epithelial cell smears were collected daily, stained with May-Grünwald and Giemsa method, and observed under microscope. Proestrus was characterized by the presence of nucleated and some cornified epithelial cells, estrus as mostly cornified cells, metestrus as some cornified epithelial cells and leukocytes, while diestrus as primarily leukocytes (Marcondes et al., 2002).
Blood and POAT sample collection
Animals were deeply anesthetized using 4% (v/v) isoflurane (Aerrane; Baxter, Warsaw, Poland) in an enclosed chamber. The absence of the corneal reflex was used to confirm adequate anesthesia before decapitation. Blood was drawn through the orbital sinus, collected into heparinized tubes, and centrifuged at 4000 × g for 10 min at 4°C. Plasma was separated and frozen at −20°C for steroids analysis. Ovaries were fixed in 10% buffered formalin for routine histological staining. POAT fragments were either snap-frozen in liquid nitrogen for mRNA and protein extraction or fixed for histology and immunohistochemistry staining.
Plasma T and E2 concentration
Testosterone (T) and 17β-estradiol (E2) concentrations were determined using commercially available enzyme-linked immunosorbent assay kits: Testosterone ELISA kit (EIA-1559; DRG MedTek, Warsaw, Poland) and Estradiol ELISA kit (EIA-2693; DRG MedTek) in ELISA plate reader Labtech LT-4500 (Labtech International Ltd., Uckfield, UK) at 450 nm. The sensitivity of each assay was 0.083 ng/mL for T and 10.6 pg/mL for E2, with ranges of 0.083–16 ng/mL and 10.6–2000 pg/mL, respectively. The intra- and inter-assay coefficients of variation for T were 3.59% and 7.13%, and for E2 were 8.97% and 10.87%, respectively. All analyses were performed in duplicate.
Ovarian and POAT histology
Paraplast-embedded ovaries and POAT from all experimental groups were cut into 5 μm-thick sections, mounted on 3′3′-aminopropyl-triethoxysaline-coated (Sigma-Aldrich), deparaffinized, rehydrated, and stained with hematoxylin QS (Vector Laboratories, Burlingame CA, USA) and eosin Y (Sigma-Aldrich). Next, stained slides were dehydrated, mounted in DPX (Sigma-Aldrich) and coverslipped. Digital images were collected using a Nikon Eclipse NieU microscope and a Nikon Digital DS-Fi1-U3 camera (Nikon, Tokyo, Japan) with corresponding software.
Periovarian adipocyte size was measured following Benrick et al. (2017). The quantification was conducted using ImageJ software (National Institutes of Health, Bethesda, MD, USA) and five representative micrographs per animal were analyzed. Following transformation to a 16-bit grayscale and setting the threshold to exclude anomalies such as blood vessels, the micrographs were transformed to black-and-white binary images and broken adipocyte plasma membranes were mended by applying the watershed function. Adipocytes were defined by circularity and cell area was measured in relation to a scale bar.
Quantitative real-time PCR analysis
Total RNA from frozen POAT samples was extracted using TRI Reagent solution (Ambion, Austin, TX, USA) according to the manufacturer’s protocol. Briefly, the RNA quantification and purity were evaluated using a NanoDrop™ Lite Spectrophotometer (Thermo Scientific,Wilmington, DE, USA; absorbance 260/280 nm ratio). Next, cDNA was synthesized from 1 μg of total RNA using High-Capacity cDNA Reverse Transcription Kit (Applied Biosystems, Foster City, CA, USA) in a Veriti Thermal Cycler (Applied Biosystems). Quantitative real-time PCR was carried out with TaqMan probe-based system (Applied Biosystems) and rat-specific TaqMan Gene Expression Assays (Applied Biosystems) as follows: Star (assay ID: Rn_00580695_m1), Cyp11a1 (assay ID: Rn_00568733_m1), 3βhsd (assay ID: Rn_01789220_m1), Cyp17a1 (assay ID: Rn_00664858_m1), and Cyp19a1 (assay ID: Rn_ 01422547_m1) (Grzesiak et al., 2021). Glyceraldehyde-3-phosphate dehydrogenase (Gapdh; assay ID: Rn_01775763_g1) was employed as an endogenous control. Real-time PCR reactions were performed in duplicate with StepOne™ Real-Time PCR System (Applied Biosystems) according to the recommended cycling program (2 min at 50°C, 10 min at 95°C, 40 cycles of 15 s at 95°C, and 1 min at 60°C). A non-template control was included in each run and genomic DNA amplification contamination was checked by control experiments in which reverse transcriptase was omitted during the reverse transcription step. PCR Miner Software (Zhao and Fernald, 2005) was used to estimate the mean PCR amplification efficiency and cycle threshold (Ct) values for each gene. Data were normalized to data obtained for Gapdh and expressed as the overall mean ± standard deviation (SD).
Western blot
Total protein extraction from POAT and Western blot analysis were performed as previously described (Grzesiak et al., 2022). Samples were separated by 12% (w:v) SDS-PAGE (Mini-Protean TGX Precast Gels; Bio-Rad Laboratories Inc., GmbH, München, Germany) and electroblotted onto a PVDF membrane (Trans-Blot Turbo Mini 0.2 mm PVDF Transfer Packs; Bio-Rad Laboratories Inc.) using a semi-dry Trans-Blot Turbo Transfer System (Bio-Rad Laboratories Inc.). The blotted membranes were blocked for 1 h at room temperature (RT) in 5% (w:v) non-fat dry milk containing 0.1% (v:v) Tween20 followed by overnight incubation at 4°C with respective primary antibodies (see Table 1) and then with anti-rabbit (dilution 1:3000; cat. no. 31460, Invitrogen) or anti-mouse (dilution 1:3000; cat. no. 170-6516, Bio-Rad Laboratories Inc.) secondary horseradish peroxidase-conjugated antibodies for 1.5 h at RT. Proteins were detected by chemiluminescence and images were captured with a ChemiDocTM XRS + System (Bio-Rad Laboratories Inc.). Each membrane was stripped and re-probed with anti-GAPDH antibody followed by anti-rabbit secondary antibody. The bands were densitometrically quantified and normalized to their corresponding GAPDH bands using the public domain ImageJ program.
Table 1.
Primary antibodies used for Western blot (WB) and immunohistochemistry (IHC)
| Antibody | Serum | Host species | Supplier | WB dilution | IHC dilution | Secondary antibody |
|---|---|---|---|---|---|---|
| Anti-StAR | 5% NGS | Rabbit | Invitrogen, Carlsbad, CA, USA | 1:1000 | 1:50 | Goat anti-rabbit IgG |
| cat. no. PA5-10685 | ||||||
| Anti-CYP11A1 | 5% NGS | Rabbit | Proteintech, Chicago, IL, USA | 1:1000 | 1:200 | Goat anti-rabbit IgG |
| cat. no. 13363-1-AP | ||||||
| Anti-3β-HSD | 5% NHS | Mouse | Abcam, Cambridge, UK | 1:2000 | 1:200 | Horse anti-mouse IgG |
| cat. no. ab55268 | ||||||
| Anti-CYP17A1 | 5% NGS | Rabbit | Invitrogen, Carlsbad, CA, USA | 1:2000 | 1:50 | Goat anti-rabbit IgG |
| cat. no. MA5-38357 | ||||||
| Anti-CYP19A1 | 10% NHS | Mouse | AbD Serotec, Milan, Italy | 1:250 | 1:50 | Horse anti-mouse IgG |
| cat. no. MCA2077S | ||||||
| GAPDH | - | Rabbit | Proteintech, Chicago, IL, USA | 1:5000 | - | Goat anti-rabbit IgG |
| cat. no. 10494-1-AP |
[i] Abbreviations: 3β-HSD, 3β-hydroxysteroid dehydrogenase/Δ5-Δ4 isomerase; CYP11A1, cholesterol side-chain cleavage enzyme; CYP17A1, cytochrome P450 17α-hydroxylase/17,20-lyase; CYP19A1, cytochrome P450 aromatase; GAPDH, glyceraldehyde-3-phosphate dehydrogenase; NGS, normal goat serum; NHS, normal horse serum; StAR, steroidogenic acute regulatory protein.
Immunohistochemistry
Immunohistochemistry was conducted as described previously (Grzesiak et al., 2021; Pich et al., 2023). Briefly, dewaxed and rehydrated sections were treated with 0.01 M citrate buffer (pH 6.0; microwave heating) for antigen retrieval followed by incubation in 0.3% (v:v) H2O2 to quench endogenous peroxidase activity. Blocking of non-specific binding sites was performed with the appropriate serum prior to overnight incubation at 4°C in a humidified chamber with respective primary antibodies (see Table 1). Next, the antigens were visualized using biotinylated secondary antibodies (1.5 h at RT) anti-mouse (1:300; cat. no. BA-2000; Vector Laboratories) or anti-rabbit (1:300; cat. no. BA-1000; Vector Laboratories), avidin-biotin-peroxidase complex (40 min at RT; Vectastain Elite ABC Reagent, Vector Laboratories), and 3,3’-diaminobenzidine (DAB; Sigma-Aldrich) as chromogen staining substrate. Sections were then dehydrated and mounted in DPX. Negative controls included sections incubated with non-immune mouse (NI03, Calbiochem, Darmstadt, Germany) or rabbit (NI01, Calbiochem, Darmstadt, Germany) IgG instead of primary antibody, processed as above. Selected sections were photographed using a Nikon Eclipse NieU microscope and a Nikon Digital DS-Fi1-U3 camera with corresponding software.
Statistical analysis
Statistical analysis was performed using GraphPad Software (La Jolla, CA, USA). The data are shown as the mean ± standard deviation (SD). The normal distribution of data was verified by the Shapiro-Wilk and Lilliefors tests and one-way ANOVA followed by Tukey post hoc test was used. Analysis of adipocytes size was performed on log 10 transformed means of original measurements. Differences were considered statistically significant at P<0.05.
Results
Effect of vitamin D3 on PCOS symptoms
The induction of PCOS was confirmed in the L group by increased body weight (Figure 2), the occurrence of acyclicity (Figure 3 I) and ovarian cysts (Figure 4 C), increased plasma T level (Figure 4 E), and decreased plasma E2 level (Figure 4 F).
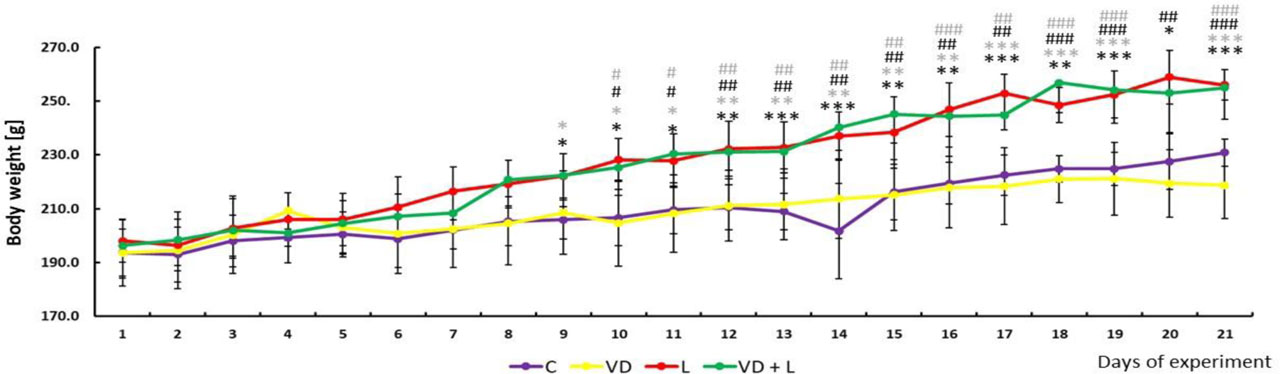
Figure 2.
Daily changes in body weight during the course of 21-day experiment in the control (C; purple line), vitamin D3-treated (VD; yellow line), letrozole-treated (L; red line), and both vitamin D3- and letrozole-treated (VD+L; green line) female rats. Values are expressed as mean ± standard deviation (SD). One-way ANOVA followed by Tukey post hoc test (*,# P<0.05; **,## P<0.01; ***,### P<0.001). Statistically significant differences between groups are denoted as: * C vs. L; * C vs. VD+L; # VD vs. L; # VD vs. VD+L
PCOS-induced rats gained more weight than controls starting from day 9 of the experiment (222.2±8.18 g vs 205.9±7.24 g; P<0.05). Similar differences (P<0.05) were observed between the C (205.9±7.24 g) and VD+L (222.4±11.7 g) groups. From day 10 onward, significant differences (P<0.05) were also noted between the VD (204.7±15.96 g) and L (228.2±7.24 g) groups, as well as between the VD (204.7±15.96 g) and VD+L (225.4 ± 10.32 g) groups. Rats in the L and VD+L groups, showed significantly higher (P<0.05) body weight compared with the VD group. At the end of the experiment, the final body weights of animals in the C, VD, L, and VD+L groups were as follows: 230.8±5.08 g, 218.7±12.32 g, 256±5.65 g, and 255±11.79 g, respectively (Figure 2).
In the C and VD groups, all phases of the estrous cycle were observed, each displaying characteristic cell types: in proestrus – nucleated epithelial cells (Figure 3 A and E, respectively); in estrus – mostly cornified epithelial cells (Figure 3 B and F, respectively); in metestrus – many leukocytes and occasional nucleated epithelial cells (Figure 3 C and G, respectively); and in diestrus – strands of mucus with rare leukocytes (Figure 3 D and H, respectively). In the L and VD+L groups, the animals became acyclic, and a typical anestrus appeared with thick mucus strands (Figure 3 I and J, respectively). Additionally, in the VD+L group, single nucleated epithelial cells were observed (Figure 3 J).
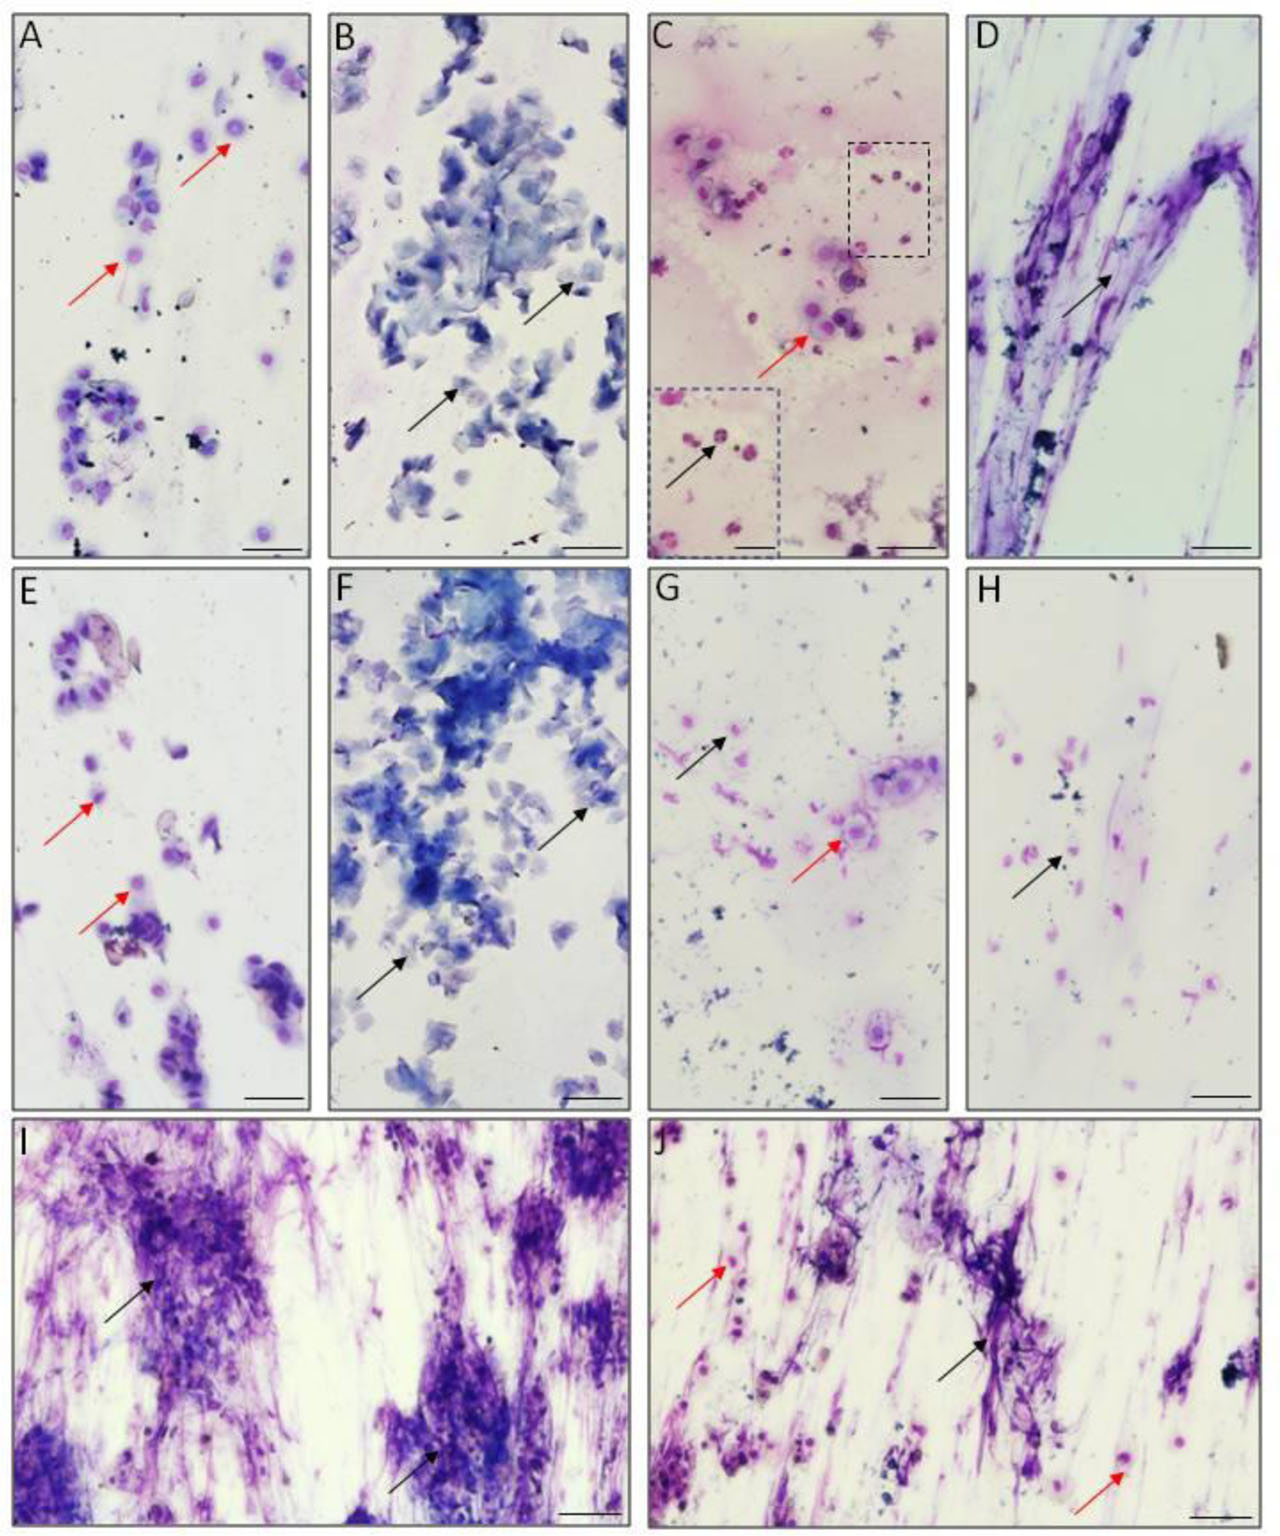
Figure 3.
Representative vaginal smears stained with May-Grünwald and Giemsa method from control (A-D), vitamin D3-treated (E-H), letrozole-treated (I), and both vitamin D3- and letrozole-treated (J) female rats. In the control and vitamin D3-treated groups, all phases of the estrous cycle were observed within the experiment duration: proestrus (A and E, respectively), estrus (B and F, respectively), metestrus (C and G, respectively) and diestrus (D and H, respectively). In both groups with induced polycystic ovary syndrome, animals became acyclic (I and J, respectively). Scale bar = 50 μm
A: → live epithelial cells; B: → cornified epithelial cells; C: → live epithelial cells, → leukocytes; D: → mucus; E: → live epithelial cells; F: → cornified epithelial cells; G: → live epithelial cells, → leukocytes; H: → leukocytes; I → mucus; J: → live epithelial cells, → mucus
In addition to acyclicity in the L group, the animals showed the presence of ovarian cysts and absence of corpora lutea (Figure 4 C), confirming the anestrus observed in the vaginal smears. Similarly, ovarian cysts were present in the VD+L group, however a few antral follicles (1–2 per ovary) were also observed (Figure 4 D). Animals in the C and VD exhibited normal follicular development, with preantral and antral follicles visible in the ovaries (Figure 4 A and B).
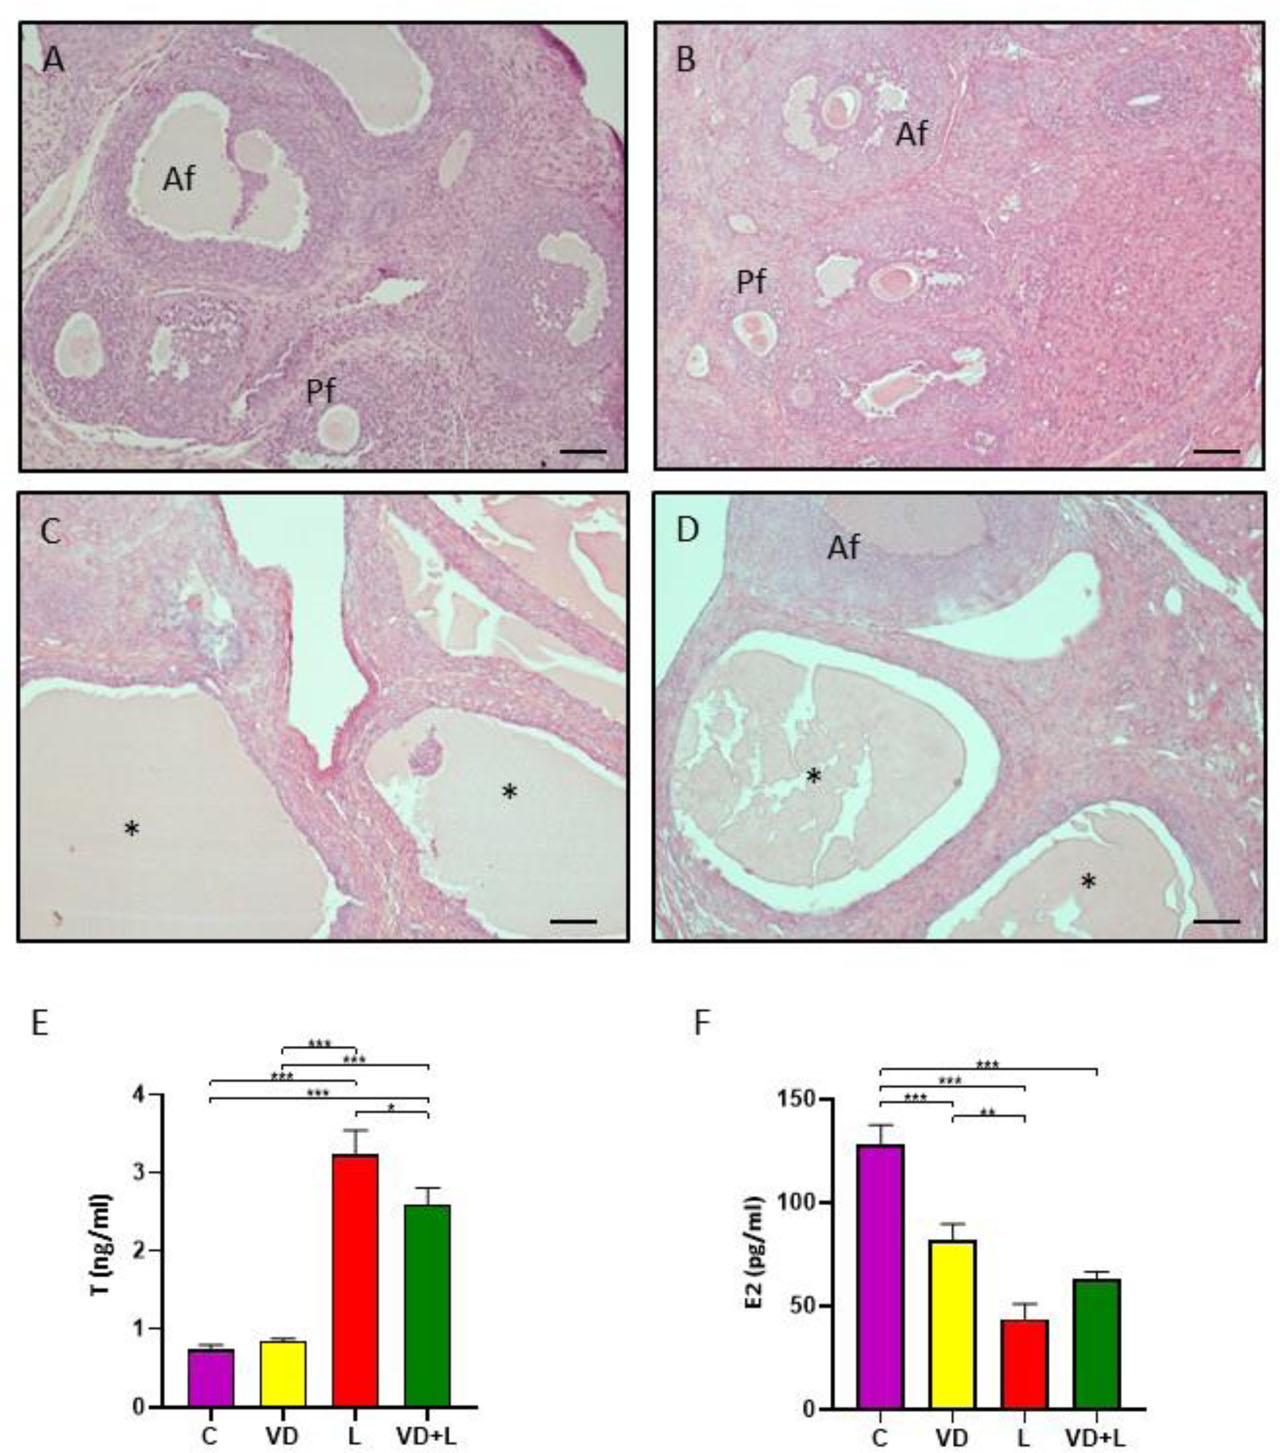
Figure 4.
Histology of ovaries obtained from control (A), vitamin D3-treated (B), letrozole-treated (C), and both vitamin D3- and letrozole-treated female rats. Af – antral follicle; Pf – preantral follicle; asterisks – ovarian cysts. Scale bar = 100 μm. Plasma concentrations of (E) testosterone (T) and (F) 17β-estradiol (E2) in the control (C), vitamin D3-treated (VD), letrozole-treated (L), and both vitamin D3- and letrozole-treated (VD+L) female rats. Values are expressed as mean ± standard deviation (SD). One-way ANOVA followed by Tukey post hoc test (*P<0.05, ** P<0.01, *** P<0.001)
The induction of PCOS was further confirmed by the increased T level in the L group, which was significantly reduced (P<0.01) in the VD+L group (Figure 4 E). Furthermore, the E2 concentration decreased following letrozole treatment (P<0.001) compared with the control group and vitamin D3 supplementation did not reverse this effect (Figure 4 F).
Effect of vitamin D3 on adipocyte size in POAT
Letrozole-induced PCOS by letrozole also led to an increase in the average size of POAT adipocytes compared with the C (P<0.001), VD (P<0.001), and VD+L (P<0.001) groups (Figure 5 A–E).
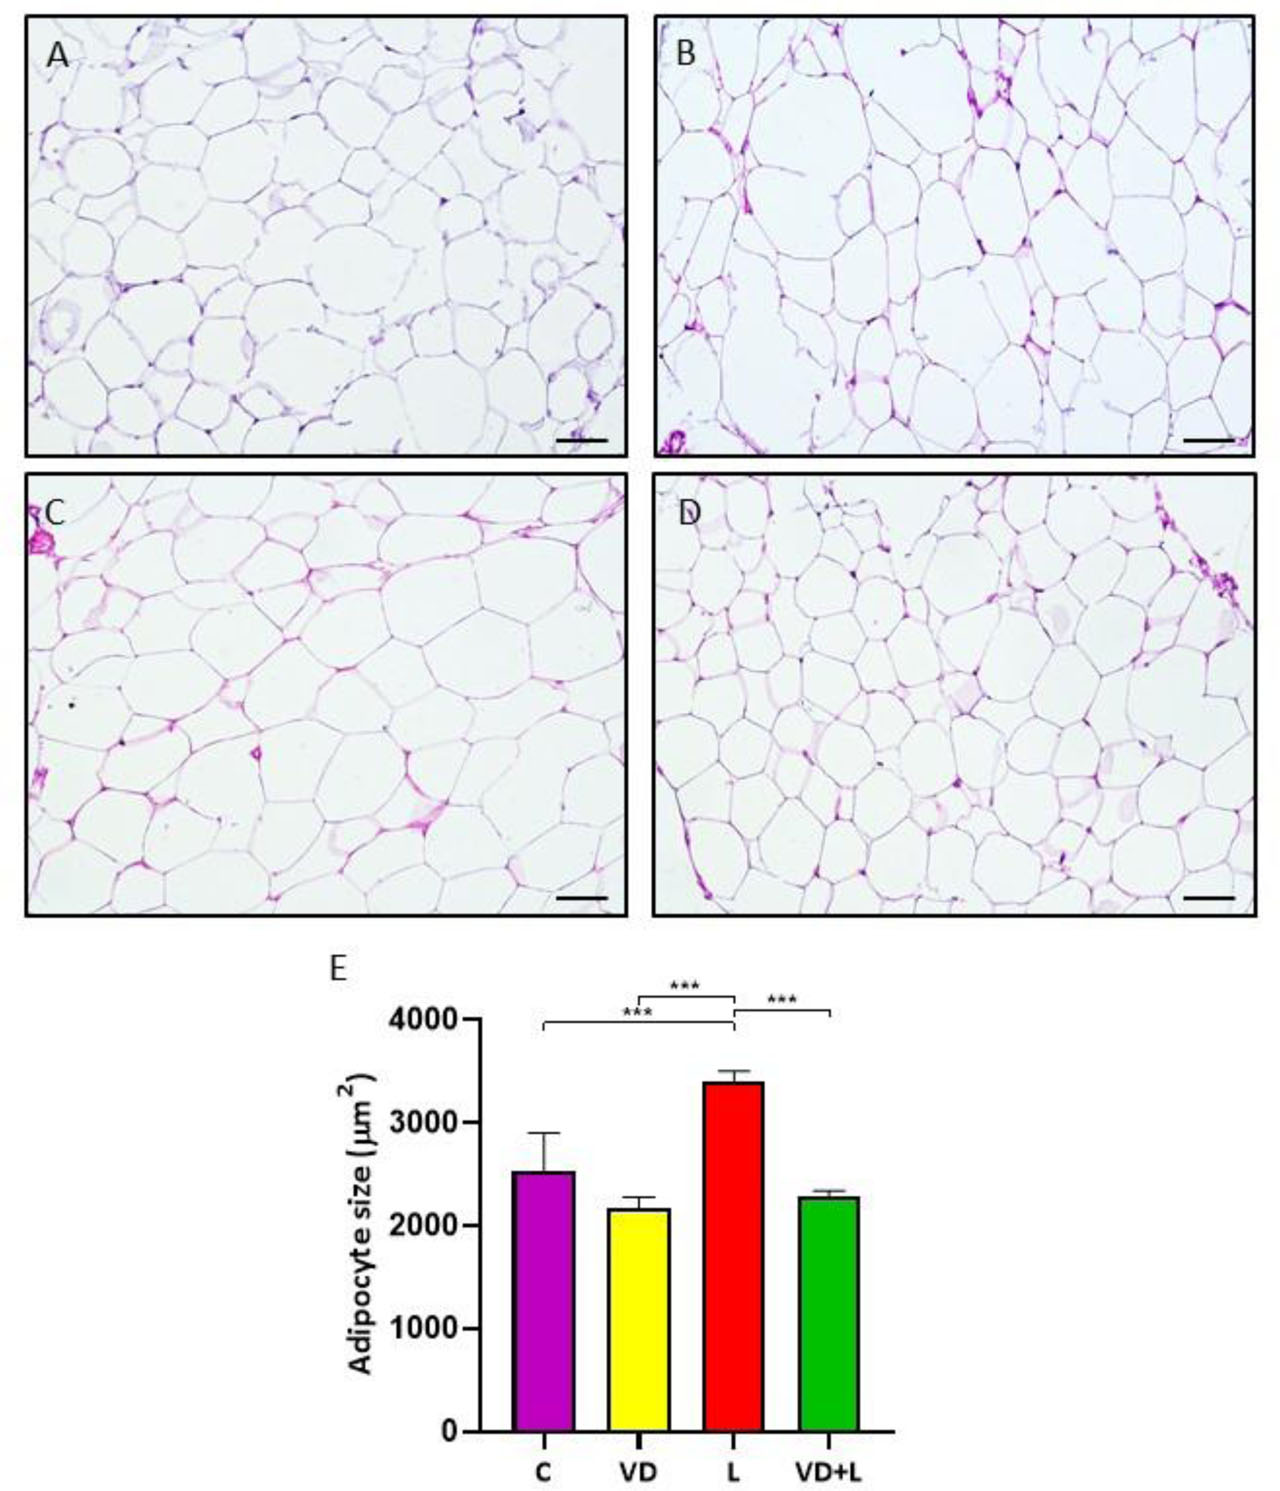
Figure 5.
Histology of periovarian adipose tissue obtained from control (A), vitamin D3-treated (B), letrozole-treated (C), and both vitamin D3- and letrozole-treated female rats. Chart (E) represents adipocyte size in each examined group. Values are expressed as mean ± standard deviation (SD). One-way ANOVA followed by Tukey post hoc test (***P<0.001). Scale bar = 50 μm
Effect of vitamin D3 on steroidogenic acute regulatory (StAR) protein localization, mRNA transcript and protein abundances
In all groups examined, StAR protein was positively immunolocalized in the cytoplasm of adipocytes (Figure 6 A–D). Both StAR mRNA transcript (Figure 6 E) and protein abundances (Figure 6 F) remained unchanged among the groups.
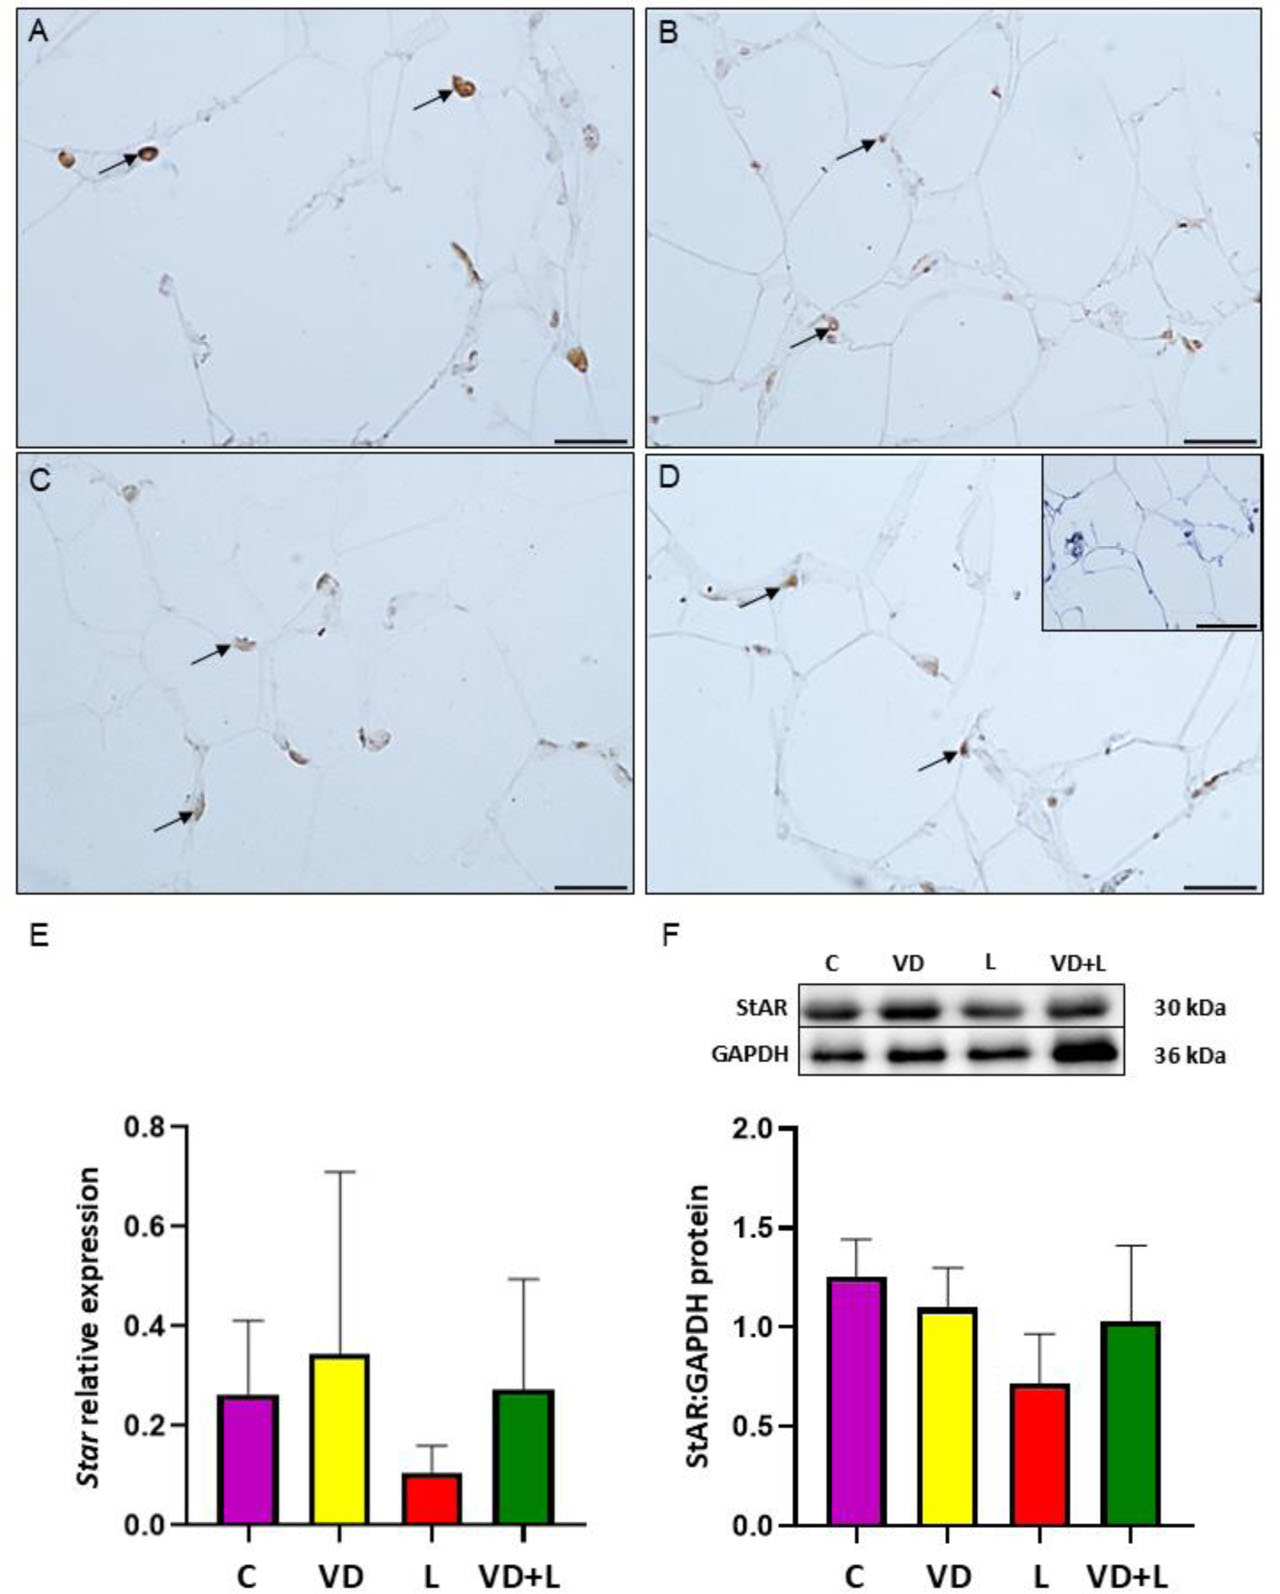
Figure 6.
Immunohistochemical localization of steroidogenic acute regulatory protein (StAR) in periovarian adipose tissue (POAT) in control group (A), vitamin D3-treated (B), letrozole-treated (C), and both vitamin D3- and letrozole-treated (D) groups. Positive immunoreaction is marked by arrows (→). Negative control (D inset). Scale bar = 25 μm or 50 μm for negative control. (E) Relative expression of Star mRNA transcript abundance in POAT. The mRNA level (quantitative real-time PCR) was expressed as the ratio relative to Gapdh (glyceraldehyde-3-phosphate dehydrogenase) and was presented as mean ± standard deviation (SD). (F) The abundance of StAR protein in POAT. Representative Western blots are shown. The relative protein abundance was examined by densitometry and expressed as the ratio relative to GAPDH. Each value represents the mean ± SD. One-way ANOVA followed by Tukey post hoc test (P<0.05)
Effect of vitamin D3 on side-chain cleavage cytochrome P450 (CYP11A1) localization, mRNA transcript and protein abundances
CYP11A1 displayed cytoplasmic localization in POAT sections across all examined groups (Figure 7 A–D). The Cyp11a1 mRNA transcript abundance was unchanged between groups (Figure 7 E), while CYP11A1 protein abundance was reduced in the L (P<0.05) and VD+L (P<0.05) groups compared with the control (Figure 7 F).
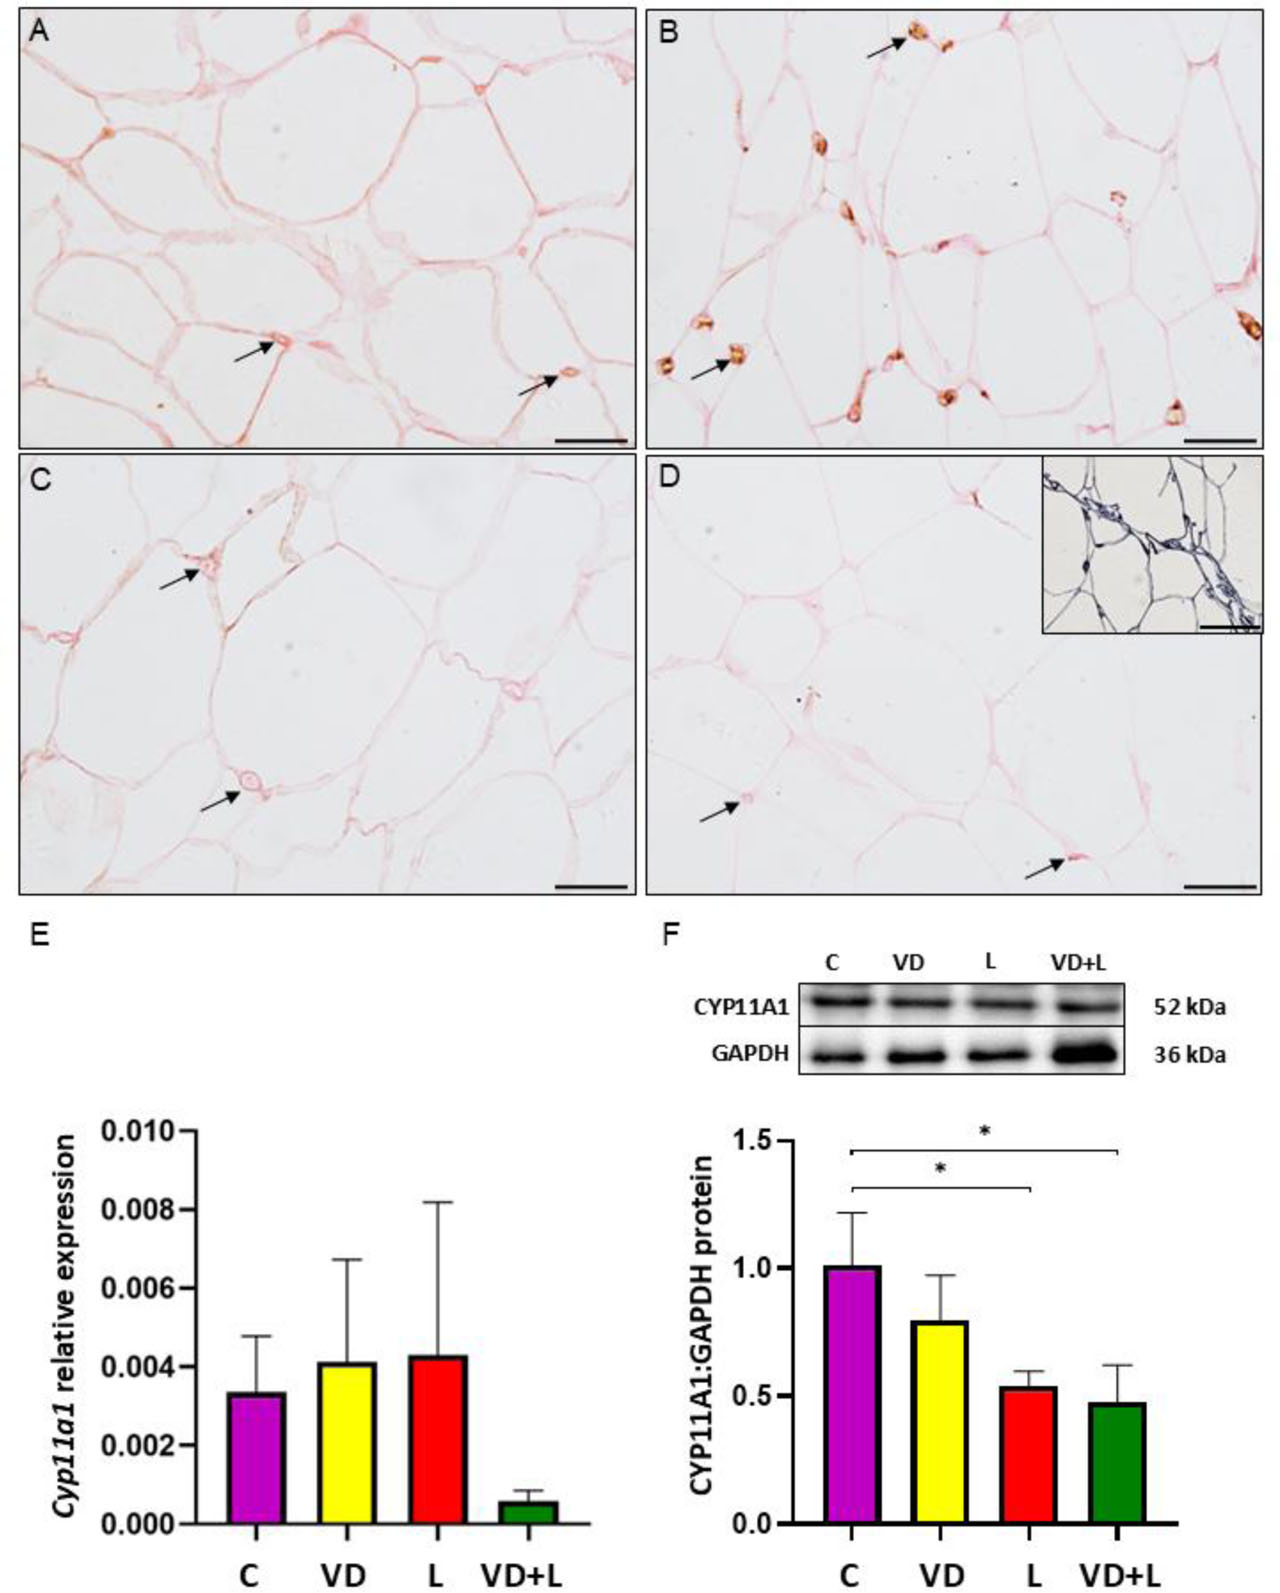
Figure 7.
Immunohistochemical localization of cholesterol side-chain cleavage enzyme (CYP11A1) in periovarian adipose tissue (POAT) in control group (A), vitamin D3-treated (B), letrozole-treated (C), and both vitamin D3- and letrozole-treated (D) groups. Positive immunoreaction is marked by arrows (→). Negative control (D inset). Scale bar = 25 μm or 50 μm for negative control. (E) Relative expression of Cyp11a1 mRNA transcript abundance in POAT. The mRNA level (quantitative real-time PCR) was expressed as the ratio relative to Gapdh (glyceraldehyde-3-phosphate dehydrogenase) and was presented as mean ± standard deviation (SD). (F) The abundance of CYP11A1 protein in POAT. Representative Western blots are shown. The relative protein abundance was examined by densitometry and expressed as the ratio relative to GAPDH. Each value represents the mean ± SD. One-way ANOVA followed by Tukey post hoc test (*P<0.05)
Effect of vitamin D3 on 3β-hydroxysteroid dehydrogenase/Δ4-Δ5 isomerase (3β-HSD) localization, mRNA transcript and protein abundances
Positive 3β-HSD immunolocalization was detected in the cytoplasm of adipocytes in all groups (Figure 8 A–D), with no change in protein abundance as revealed by Western blot analysis (Figure 8 F). However, 3βhsd mRNA transcript abundance decreased in the L and VD+L groups compared with both the C (P<0.01 and P<0.01, respectively) and VD (P<0.05 and P<0.05, respectively) groups (Figure 8 E).
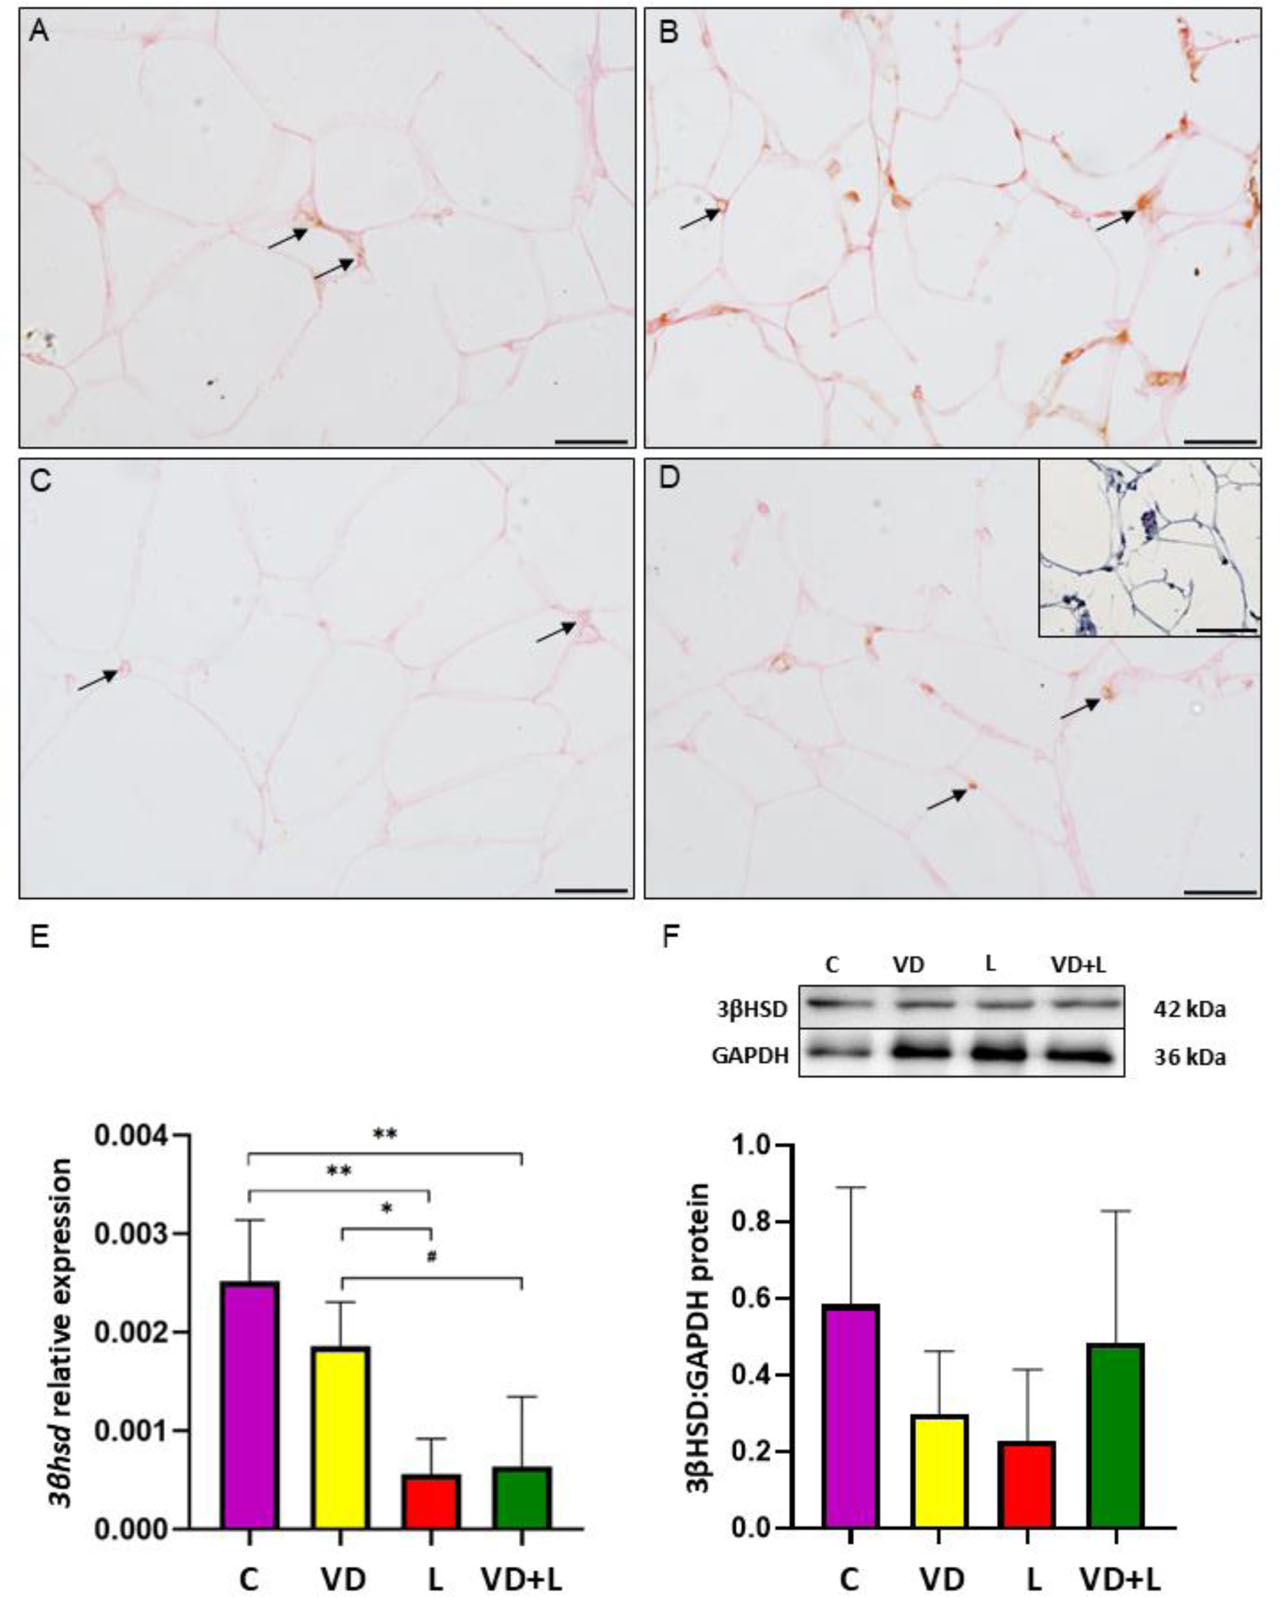
Figure 8.
Immunohistochemical localization of 3β-hydroxysteroid dehydrogenase/Δ5-Δ4 isomerase (3β-HSD) in periovarian adipose tissue (POAT) in control group (A), vitamin D3-treated (B), letrozole-treated (C), and both vitamin D3- and letrozole-treated (D) groups. Positive immunoreaction is marked by arrows (→). Negative control (D inset). Scale bar = 25 μm or 50 μm for negative control. (E) Relative expression of 3βhsd mRNA transcript abundance in POAT. The mRNA level (quantitative real-time PCR) was expressed as the ratio relative to Gapdh (glyceraldehyde-3-phosphate dehydrogenase) and was presented as mean ± standard deviation (SD). (F) The abundance of 3β-HSD protein in POAT. Representative Western blots are shown. The relative protein abundance was examined by densitometry and expressed as the ratio relative to GAPDH. Each value represents the mean ± SD. One-way ANOVA followed by Tukey post hoc test (*P<0.05, ** P<0.01)
Effect of vitamin D3 on cytochrome P450 17α-hydroxylase/17,20 lyase (CYP17A1) localization, mRNA transcript and protein abundances
In all groups analyzed, CYP17A1 positive localization was found in the cytoplasm of adipocytes (Figure 9 A–D). Both Cyp17a1 mRNA transcript (Figure 9 E) and CYP17A1 protein abundances (Figure 9 F) remained unchanged under the experimental conditions.
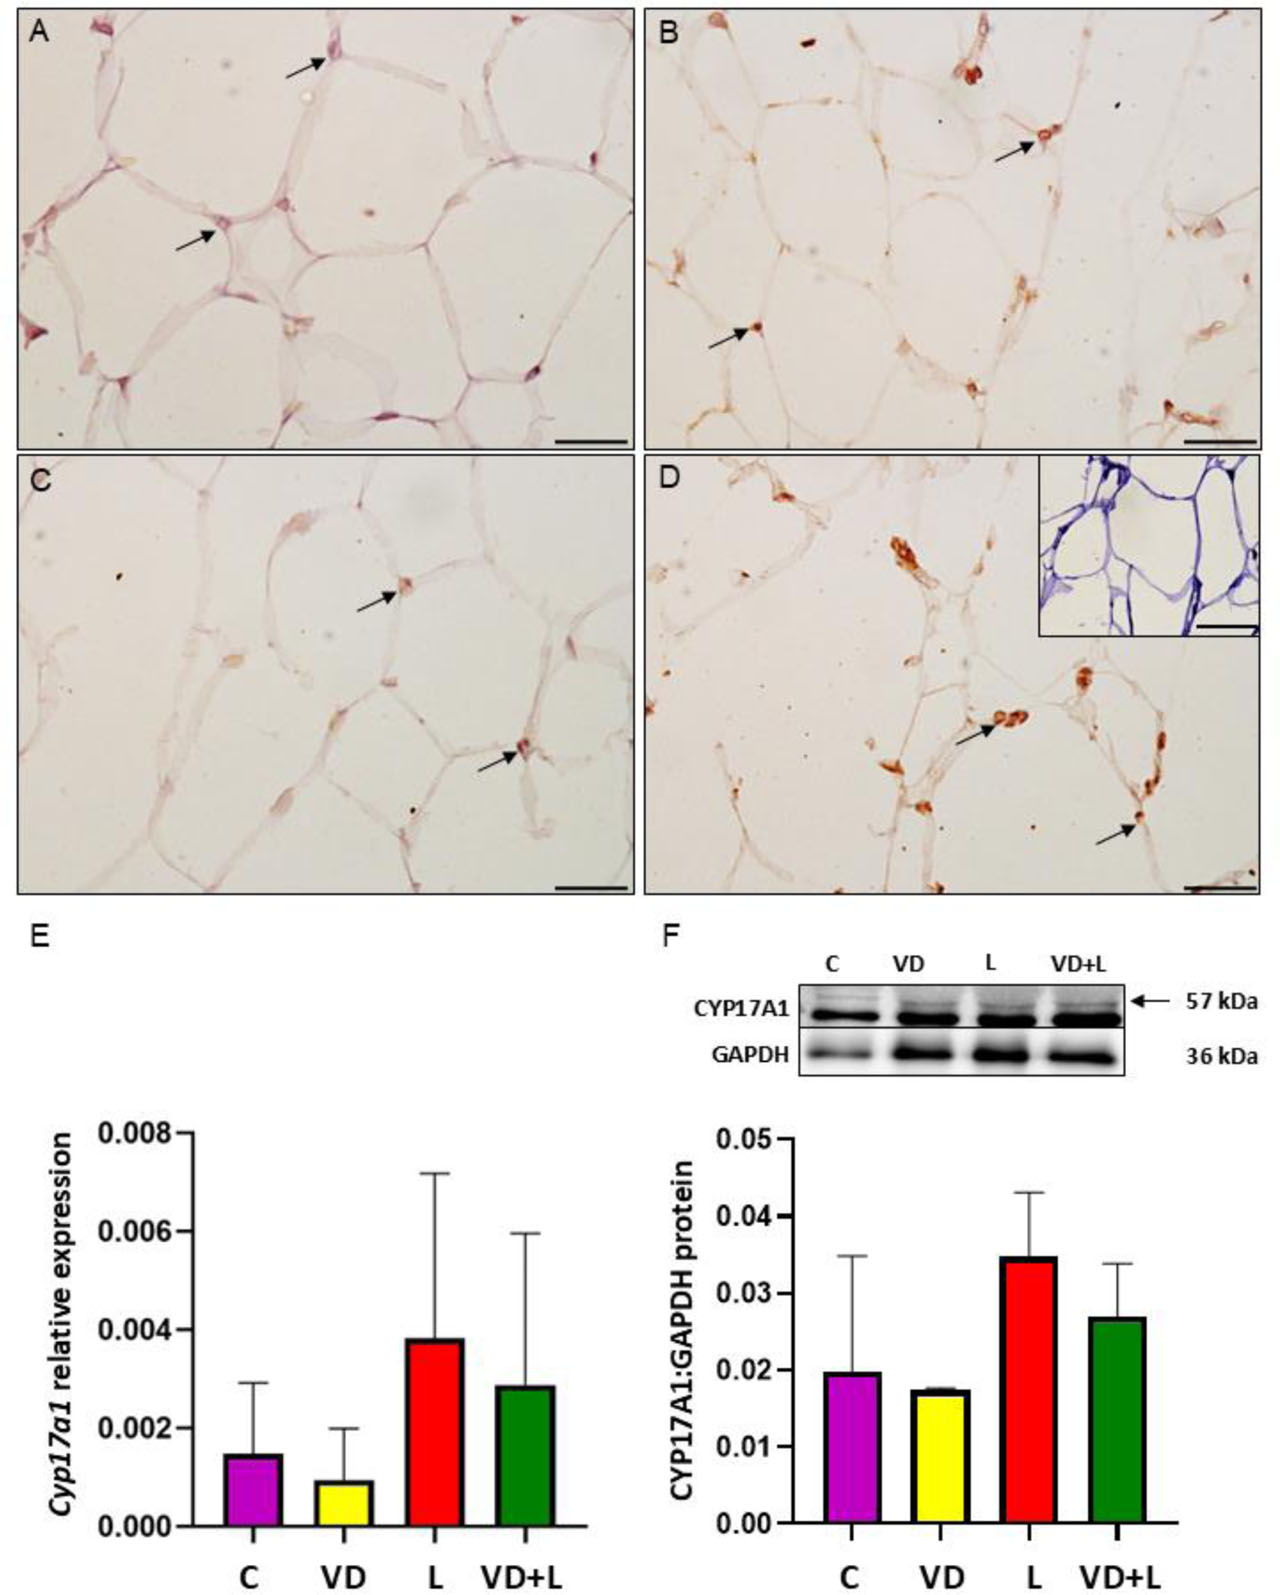
Figure 9.
Immunohistochemical localization of cytochrome P450 17α-hydroxylase/17,20-lyase (CYP17A1) in periovarian adipose tissue (POAT) in control group (A), vitamin D3-treated (B), letrozole-treated (C), and both vitamin D3- and letrozole-treated (D) groups. Positive immunoreaction is marked by arrows (→). Negative control (D inset). Scale bar = 25 μm or 50 μm for negative control. (E) Relative expression of Cyp17a1 mRNA transcript abundance in POAT. The mRNA level (quantitative real-time PCR) was expressed as the ratio relative to Gapdh (glyceraldehyde-3-phosphate dehydrogenase) and was presented as mean ± standard deviation (SD). (F) The abundance of CYP17A1 protein in POAT. Representative Western blots are shown. The relative protein abundance was examined by densitometry and expressed as the ratio relative to GAPDH. Each value represents the mean ± SD. One-way ANOVA followed by Tukey post hoc test (P<0.05)
Effect of vitamin D3 on cytochrome P450 aromatase (CYP19A1) localization, mRNA transcript and protein abundances
The CYP19A1 localization was observed in the cytoplasm of POAT sections in all examined groups (Figure 10 A–D). Its expression was changed at the transcript and protein levels. Specifically, Cyp19a1 mRNA transcript abundance was greater in the VD+L group than in the C (P<0.001), VD (P<0.001) and L (P<0.001) groups (Figure 10 E). Regarding CYP19A1 protein abundance, it was greater in the VD+L group compared with the L (P<0.01) and VD (P<0.05) groups, and lower (P<0.05) in the L group than in the C group (Figure 10 F).
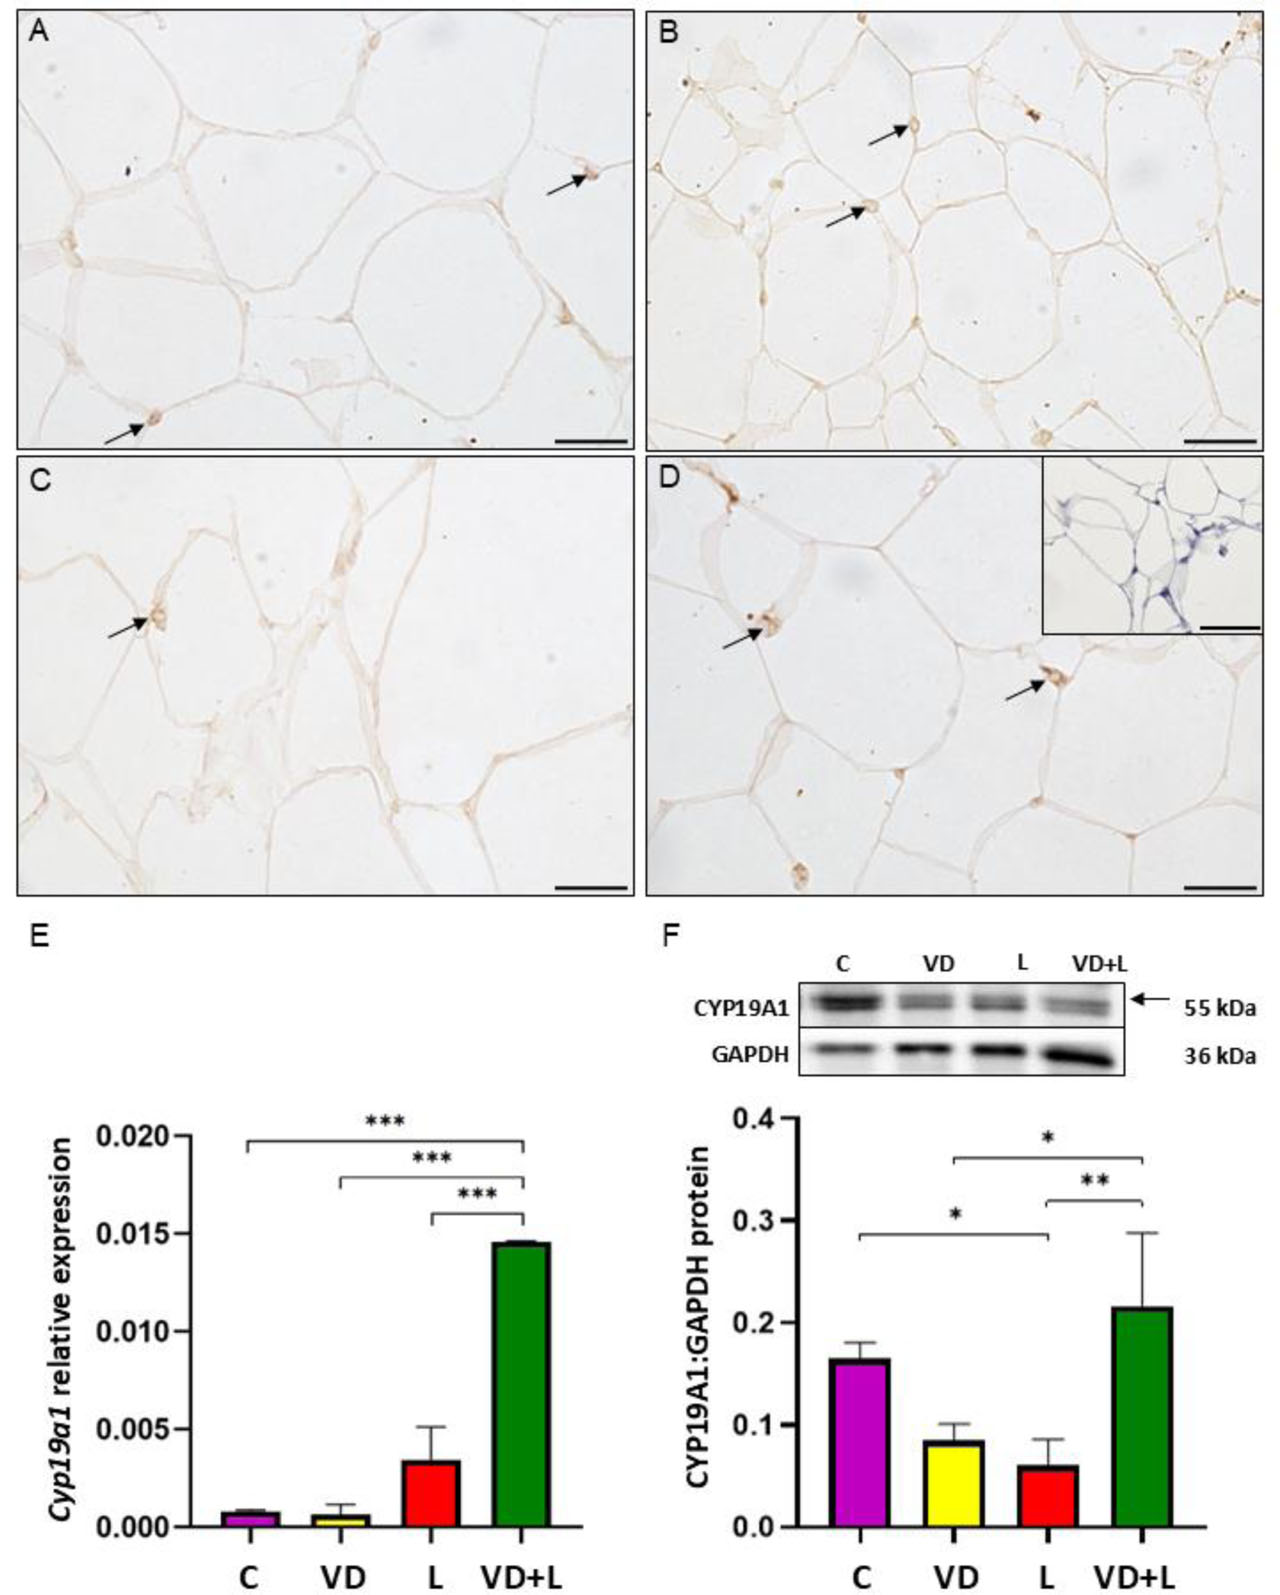
Figure 10.
Immunohistochemical localization of cytochrome P450 aromatase (CYP19A1) in periovarian adipose tissue (POAT) in control group (A), vitamin D3-treated (B), letrozole-treated (C), and both vitamin D3- and letrozole-treated (D) groups. Positive immunoreaction is marked by arrows (→). Negative control (D inset). Scale bar = 25 μm or 50 μm for negative control. (E) Relative expression of Cyp19a1 mRNA transcript abundance in POAT. The mRNA level (quantitative real-time PCR) was expressed as the ratio relative to Gapdh (glyceraldehyde-3-phosphate dehydrogenase) and was presented as mean ± standard deviation (SD). (F) The abundance of CYP19A1 protein in POAT. Representative Western blots are shown. The relative protein abundance was examined by densitometry and expressed as the ratio relative to GAPDH. Each value represents the mean ± SD. One-way ANOVA followed by Tukey post hoc test (* <0.05, ** P<0.01, *** P<0.001)
Discussion
PCOS is characterized by reproductive, hormonal, and metabolic disturbances (Azziz et al., 2016), among which vitamin D3 deficiency is increasingly common (van Tienhoven et al., 2025). Our previous research demonstrated reduced vitamin D3 metabolism in both the ovary and periovarian adipocytes (Grzesiak et al., 2021), suggesting a potential role for vitamin D3 in regulating POAT functions during PCOS. Given that POAT secretes multiple factors, including steroid hormones that can influence ovarian processes (Szyrzisko and Grzesiak, 2024), and that ovarian steroid synthesis during PCOS can be modulated by vitamin D3 (Bakhshalizadeh et al., 2017), the present study examined the effect of vitamin D3 on steroidogenesis in POAT using a letrozole-induced PCOS rat model.
In this study, administration of letrozole to female rats successfully induced PCOS-like symptoms, including increased body weight, acyclicity, anovulation evidenced by the absence of corpora lutea and numerous ovarian cysts, and hyperandrogenism. These phenotypic changes confirm the successful induction of PCOS, consistent with previous reports using the letrozole-induced PCOS rat model (Kafali et al., 2004; Baravalle et al., 2006; Mannerås et al., 2007; Caldwell et al., 2014), and our recent findings (Kalamon et al., 2020; Grzesiak et al., 2021). Within this experimental framework, we assessed whether vitamin D3 supplementation could ameliorate PCOS characteristics. Rats treated with letrozole exhibited significantly higher body weight than both the C and VD groups, in line with earlier studies (Skarra et al., 2017). These animals also demonstrated an elevated insulin level and an increased homeostatic model assessment for insulin resistance (HOMA-IR) index (Kamińska et al., 2024), which may contribute to the observed weight gain. In the VD+L group, vitamin D3 did not significantly reduce body weight, similar to rats receiving vitamin D3 alone. These results align with clinical observations in patients with PCOS, whose body weight remained unchanged after supplementation with 3200 IU/day of vitamin D3 for 3 months (Javed et al., 2019). Likewise, supplementation with 2000 IU/day for 12 months during weight loss interventions did not enhance weight reduction in postmenopausal women (Mason et al., 2014, 2016). Similarly, vitamin D3 supplementation (1000 IU/day) in healthy and overweight women over a 90-day period did not directly decrease body mass (Salehpour et al., 2012). Although some animal studies suggest a potential therapeutic role of vitamin D3 in obesity associated with PCOS (Xu et al., 2024), further research is required to determine the optimal dosage and confirm its efficacy in reducing body mass.
Herein we demonstrated that induction of PCOS led to cessation of the estrous cycle and anovulation, as confirmed by vaginal smear cytology. In animals from the VD+L group, single nucleated epithelial cells were observed in the smears; however, a normal estrous cycle was not restored. These results suggest a beneficial effect of vitamin D3, consistent with the findings of Abban et al. (2008), who reported increased proliferation of vaginal epithelial cells in female rats following vitamin D3 administration. Similarly, Refaat and El-Boshy (2021) observed a higher frequency of shorter cycles in rats supplemented with vitamin D3. In women, vitamin D3 deficiency has been associated with prolonged menstrual cycles characterized by an extended follicular phase and shortened luteal phase (Jukic et al., 2018). These outcomes may be explained by the regulatory influence of vitamin D3 and calcium on sex hormone production. In mice, vitamin D3 deficiency leads to delayed sexual maturation, disrupted estrous cyclicity, and dysregulation of the hypothalamic–pituitary–ovarian axis (Sun et al., 2010; Dicken et al., 2012; Refaat and El-Boshy, 2021). In the present study, cessation of the estrous cycle in the letrozole-treated groups was likely due to decreased E2 level. However, vitamin D3 supplementation did not restore the E2 concentration and, consequently, did not establish a normal estrous cycle.
In both the L and VD+L groups, ovarian cysts were predominant. Nevertheless, in the VD+L group, the presence of single antral follicles suggested a partial restoration of folliculogenesis following vitamin D3 treatment. The plasma E2 concentration was slightly elevated in this group, which may be attributed to the development of growing follicles (Marcondes et al., 2002). Furthermore, the presence of a few nucleated epithelial cells in vaginal smears from the VD+L group, supports the notion that vitamin D3 exerts a positive effect on follicular development and steroids level. Indeed, accelerated growth and maturation of antral follicles, along with ovulation, have previously been demonstrated after vitamin D3 administration (Refaat and El-Boshy, 2021). Collectively, these findings suggest that vitamin D3 may help support the resumption of folliculogenesis under conditions of hormonal imbalance, such as those observed in letrozole-induced PCOS.
In the present study, we demonstrated that the largest adipocytes occurred in rats with letrozole-induced PCOS, while vitamin D3 markedly decreased their size. The differences in adipocyte area observed herein may be related to the increased body weight in rats with PCOS, in agreement with our previous study (Grzesiak et al., 2021). In line with the present findings, reduced visceral and omental adipocyte size has been reported in women with higher dietary vitamin D3 intake and serum levels (Caron-Jobin et al., 2011). Similarly, obese mice supplemented with vitamin D3 showed smaller adipocyte diameters in epididymal white adipose tissue (Chang, 2022). Borges et al. (2020) demonstrated hypertrophied POAT adipocytes in mice model of menopause with associated vitamin D3 deficiency. In the present study, vitamin D3 alleviated adipocyte hypertrophy in POAT without reducing PCOS-induced body weight, further highlighting its potential role in regulating adipocyte function. Indeed, enhanced proinflammatory cytokines level and increased inflammatory markers were found in mouse POAT with dietary restriction of vitamin D3 (Borges et al., 2020). Changes in adipocyte morphology have been linked to altered lipid profiles in ageing mice (Dipali et al., 2019) and to increased lipid peroxidation in the POAT of PCOS rats fed a high-fat diet (Vulcan et al., 2024), which may further affect the ovarian microenvironment. As we previously reported, PCOS is associated with vitamin D3 deficiency (Kamińska et al., 2024) and metabolic disturbances, such as insulin resistance (Kamińska et al., 2024) and increased cholesterol level (Pich et al., 2023). Consequently, vitamin D3 deficit may negatively influence POAT function, promoting cholesterol release from hypertrophied adipocytes and potentially compromising ovarian health.
Herein, despite the lack of a significant increase in the plasma E2 concentration in the VD+L group, signs of improved folliculogenesis and the presence of nucleated epithelial cells in vaginal cytology were observed. This raises the question whether vitamin D3 administration could influence local POAT steroidogenesis and thereby modulate ovarian function in PCOS rats. To our knowledge, this is the first study demonstrating the cellular localization and expression of StAR protein, and key steroidogenic enzymes: CYP11A1, 3β-HSD, CYP17A1 and CYP19A1 in the POAT of a PCOS rat model. All examined steroidogenic molecules displayed cytoplasmic localization as presented in other adipose tissue deposits (Li et al., 2015; Byeon and Lee, 2016). Regarding mRNA transcript and protein abundances, the differences were observed for CYP11A1, 3β-HSD, and CYP19A1, whereas StAR protein and CYP17A1 expression remained unchanged under our experimental conditions. These results might be explained by the presence of a vitamin D response element in the promoter region of the gene encoding CYP19A1 (Sun et al., 1998; Krishnan et al., 2010), in the upstream promoter region of CYP11A1 (Schedel et al., 2016; Hu et al., 2023) and 3βHSD1 (Xue et al., 2022) indicating its direct regulation by vitamin D3. These results confirm the modulatory capacity of vitamin D3 on POAT steroidogenesis in a step-dependent manner.
In the present study, StAR protein, which mediates cholesterol transport into the mitochondrial compartment, was not affected by experimental treatment at either the transcript or protein level. Increased Star mRNA transcript abundance has been reported in sheep visceral adipose tissue after prenatal T exposure (Puttabyatappa et al., 2018) and in subcutaneous adipose tissue of PCOS women (Emami et al., 2021). Likewise, both StAR transcript and protein abundances were increased in the ovaries of PCOS-induced mice (Bakhshalizadeh et al., 2017; Kyei et al., 2020), while vitamin D3 supplementation reduced their expression (Bakhshalizadeh et al., 2017). It appears that in the POAT of the letrozole-induced PCOS rat model, the initial step of steroidogenesis mediated by StAR protein was not influenced by vitamin D3.
CYP11A1 protein and 3βhsd mRNA transcript abundances were decreased in both PCOS-induced groups (L and VD+L) compared with the control, suggesting that letrozole affected the early stages of the POAT steroidogenic pathway, namely pregnenolone and progesterone synthesis (Li et al., 2015) while vitamin D3 did not reverse this effect. By contrast, vitamin D3 induced down-regulation of both CYP11A1 and 3β-HSD at the mRNA and protein levels in granulosa cells of PCOS mice (Bakhshalizadeh et al., 2017). Taking into account that Cyp11a1 mRNA transcript abundance was higher in subcutaneous adipose tissue from the abdominal region, whereas 3βhsd transcript abundance remained unchanged in PCOS patients (Emami et al., 2021), the step in steroidogenesis leading to progesterone synthesis appears to be differentially regulated across various adipose depots. The differences in the CYP11A1 and 3β-HSD mRNA transcript and protein abundances might be a result of posttranscriptional modifications induced by vitamin D3 as previously described (Lundqvist et al., 2010).
CYP17A1 converts pregnenolone and progesterone into 17-hydroxypregnenolone and 17-hydroxyprogesterone, respectively, through its 17α-hydroxylase and 17,20-lyase activities and subsequently converts these intermediates into dehydroepiandrosterone and 4-androstenedione (Patel et al., 2010). CYP17A1 has been shown to be overexpressed in ovarian theca cells, resulting in increased androgen production and reduced aromatase activity (Ashraf et al., 2019). Previous studies using letrozole model showed increased ovarian expression of Cyp17a1 transcript (Ryan et al., 2018; Ryu et al., 2023). In the present study, CYP17A1 transcript and protein abundances were unaltered among the examined groups, and vitamin D3 did not affect this step of steroidogenesis in POAT. This may be explained by the fact that theca interna cells, rather than adipocytes, are the primary source of androgen excess in PCOS (Ashraf et al., 2019).
CYP19A1 is responsible for the aromatization of T to E2, and its high expression has previously been demonstrated in the rat ovarian fat pad (Byeon and Lee, 2016). In the present study, we found decreased CYP19A1 protein abundance but not transcript level in the POAT of PCOS rats. These adipose tissue results contrast with previous findings from ovaries of PCOS models induced by dehydroepiandrosterone injection, where both CYP19A1 mRNA transcript and protein abundances were increased in the whole ovary (Kyei et al., 2010) and in granulosa cells (Bakhshalizadeh et al., 2017). Because our model was induced by the aromatase inhibitor letrozole, this could have directly influenced CYP19A1 expression. Increased aromatase expression has been observed in sheep visceral adipose tissue following prenatal T exposure (Bakhshalizadeh et al., 2017). By contrast, Cyp19a1 mRNA transcript abundance was unchanged in subcutaneous abdominal adipose tissue of PCOS patients (Emami et al., 2021), suggesting that CYP19A1 expression in adipose tissue during PCOS may depend on the specific fat deposition. With respect to vitamin D3, we found increased CYP19A1 transcript and protein abundances in the VD+L group. This contrasts with observations in granulosa cells of PCOS mice, where vitamin D3 induced down-regulation of both mRNA and protein for CYP19A1 (Bakhshalizadeh et al., 2017, 2018). The tissue-specific effects of vitamin D3 on CYP19A1 expression are well documented. In human macrophages, vitamin D3 suppresses CYP19A1 expression, thereby reducing estrogens synthesis (Villaggio et al., 2012). Conversely, vitamin D3 enhances CYP19A1 expression in human glioma cells (Yague et al., 2009) and osteoblasts (Enjuanes et al., 2003) through activation of specific promoters. However, vitamin D3 did not affect FSH-induced aromatase mRNA transcript abundance or E2 production in human cumulus granulosa cells (Merhi et al., 2014). Taken together, our findings suggest that POAT may develop a predominantly estrogenic intracrine milieu following vitamin D3 administration, which could positively influence ovarian function in PCOS.
In the present study, we report for the first time, the crucial role of vitamin D3 modulating POAT steroidogenesis using a letrozole-induced PCOS rat model. The most pronounced effect of vitamin D3 was observed on CYP19A1 expression, which was markedly increased. Such upregulation may enhance estrogen synthesis, thereby influencing ovarian function and potentially improving reproductive parameters in PCOS.
Notes
Acknowledgements
The cost of Open Access publication was covered by the Society for Biology of Reproduction in Poland.