
Table 1.
List of dogs diagnosed with spleen tumours (STs), histopathological assessment, and characteristics of individuals
| Number | Breed/Crossbreed | Sex | Age of dog | Size* | Tumour profile | Tumour type | Malignant/Benign |
|---|---|---|---|---|---|---|---|
| ST002 | Crossbreed | F | 10 | M | one | haemangiosarcoma | M |
| ST008 | Fox Terrier Smooth | M | 10 | S | one | liposarcoma | |
| ST010 | English Cocker Spaniel | F | 15 | M | two | haemangiosarcoma | |
| ST017 | Crossbreed | M | 12 | L | one | histiocytic sarcoma | |
| ST030 | Boxer | M | 12 | L | one | haemangiosarcoma | |
| ST056 | German Shepherd | M | 10 | L | one, disintegrative | ||
| ST073 | Crossbreed | F | 10 | M | two | haemangioma | B |
| ST074 | Dachshund | M | 12 | S/M | one | haemangiosarcoma | M |
| ST076 | Crossbreed | F | 12 | S | one | haemangioma | B |
| ST088 | Crossbreed | M | 13 | M | one, disintegrative | lymphoma | M |
| ST089 | English Pointer | F | 12 | M/L | one | haemangiosarcoma | |
| ST094 | Crossbreed | M | 15 | M | one | ||
| ST126 | German Shepherd | F | 9 | L | many, disintegrative | ||
| ST145 | Miniature Schnauzer | F | 11 | S | one | ||
| ST148 | Crossbreed | M | 12 | M | one, disintegrative | ||
| ST164 | Jack Russell Terrier | M | 5 | S | one | ||
| ST174 | Miniature Schnauzer | F | 10 | S | one | ||
| ST177 | Crossbreed | M | 8 | L | one | ||
| ST197 | German Shepherd | M | 11 | L | one, disintegrative |
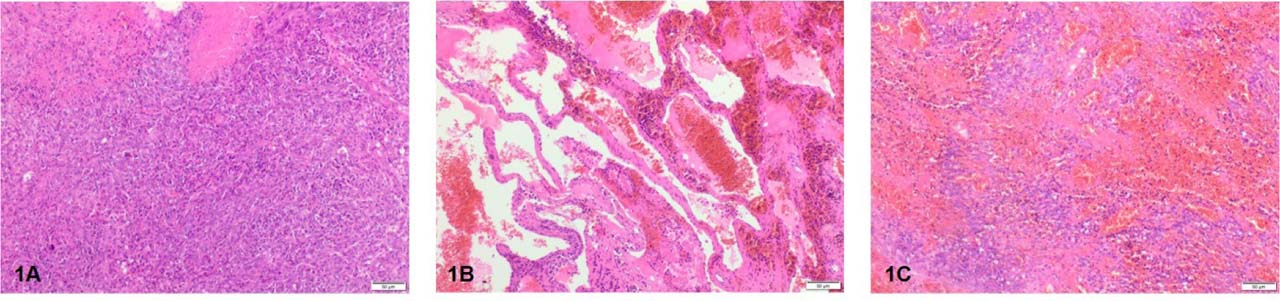
Figure 1.
Histopathological evaluations of spleen tumours in dogs: 1A. Histiocytic sarcoma – visible infiltration of polymorphic round to spindyloid multinucleate cells and foci of necrosis, 1B. Haemangioma – visible irregularly dilated vascular channels in stromal collagen, 1C. Haemangiosarcoma – visible bundles of spindle-shaped cells and slit-like vascular spaces. All tissues were H&E stained × 100
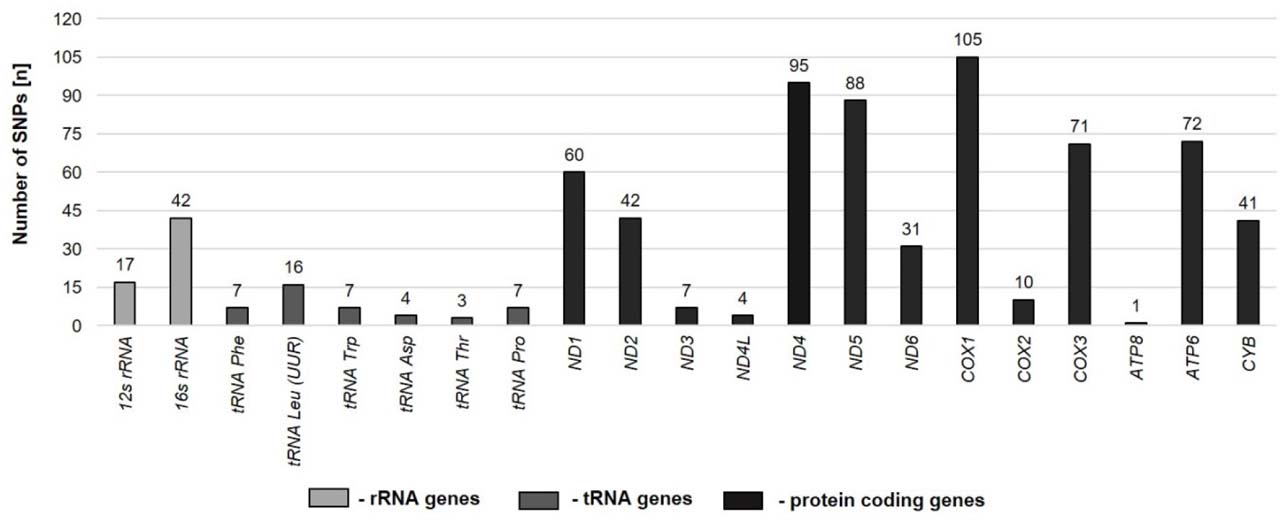
Figure 2.
Number of SNPs found in mtDNA genes
Table 2.
List of common polymorphisms present in all the dogs diagnosed with spleen tumours (STs)
| Gene/Region | Reference sequence | Sequence variant | Codon change/position in tRNA | Amino acid change/tRNA region | SIFT1 for nonsynonymous changes |
|---|---|---|---|---|---|
| tRNA Leu (UUR) | m.2678 | m.2678_2679insG | 8_9 | between acceptor stem and DHU stem | – |
| COX1 | m.5367C | m.5367C>T | CTG→TTG | p.Leu7= | |
| m.5444T | m.5444T>C | GCT→GCC | p.Ala32= | ||
| m.6065A | m.6065A>G | GGA→GGG | p.Gly239= | ||
| ATP6 | m.8368C | m.8368C>T | CTC→CTT | p.Leu135= | |
| COX3 | m.8807G | m.8807G>A | TGC→TAC | p.Cys55Tyr | tolerant |
| ND4L | m.9911_9912 | m.9911_9912insGT | ATG→GTG | p.Met1Val | intolerant |
| ND5 | m.13299T | m.13299T>A | TCA→ACA | p.Ser508Thr | tolerant |
| D-loop | m.15814C | m.15814C>T | – | – | – |
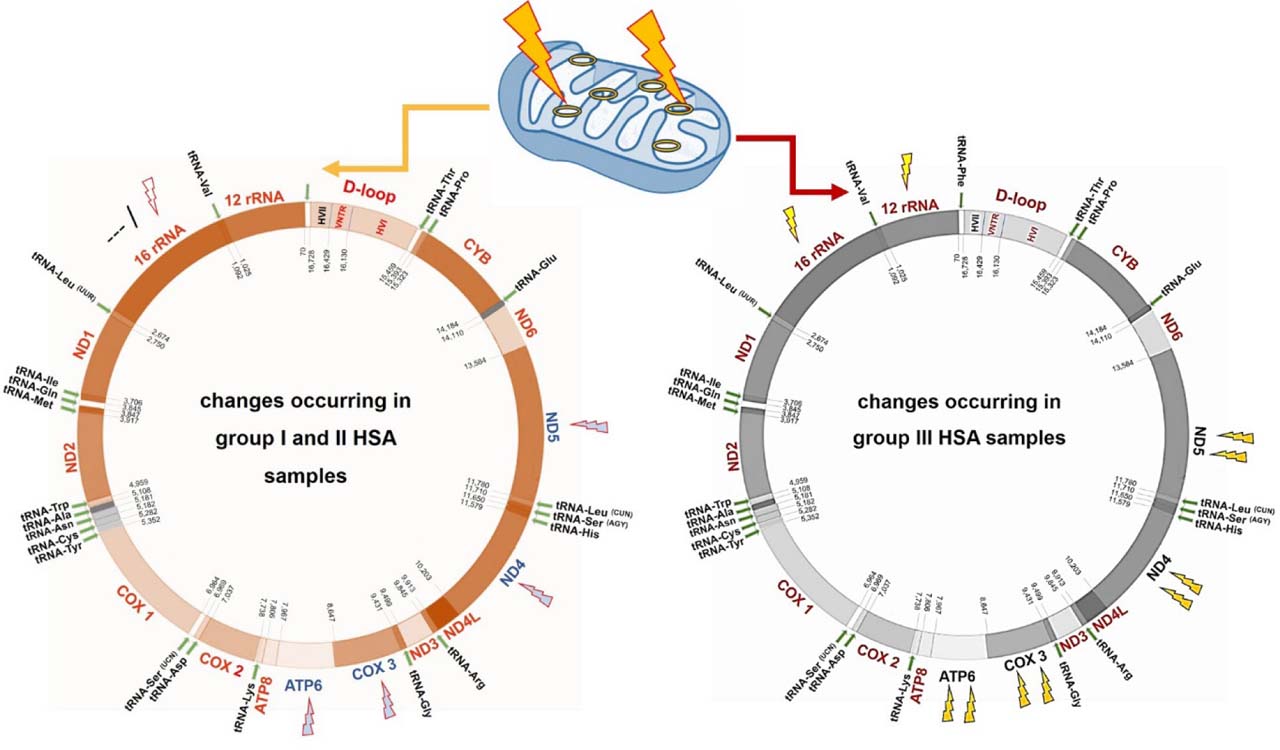
Figure 3.
Association between the HSA sample group (I, II, III) and the increasing number of SNPs in the ND4, ND5, COX3, and ATP6 genes