
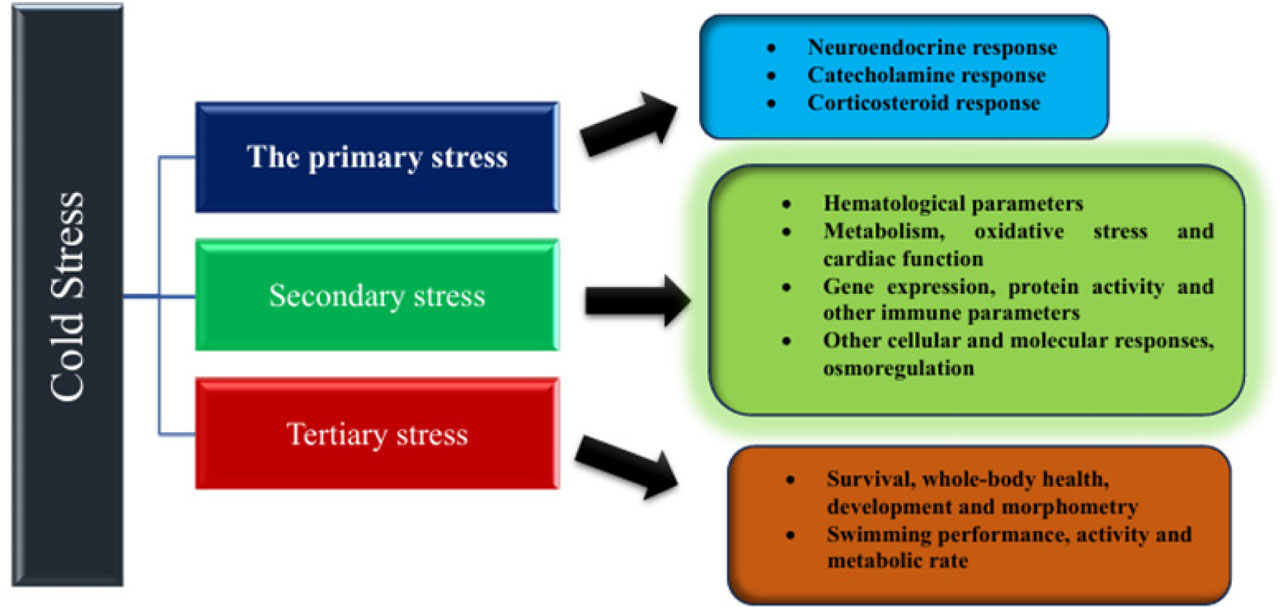
Figure 1.
Classification of fish response to stress resulting from cold stress.
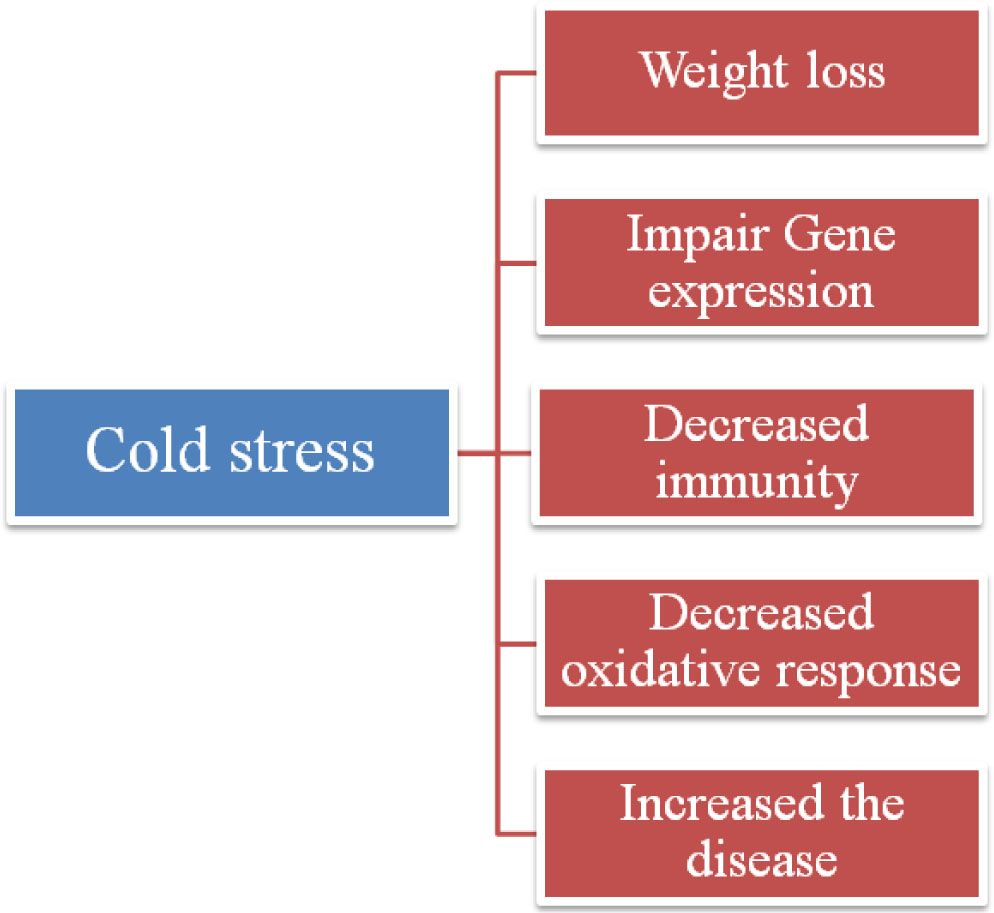
Figure 2.
Effects of cold stress on the biological functions of fish.
Table 1.
Low temperature effects on biochemical and hematological parameters of different fish and crustacean species
| Hematology indices | Fish species | IBW | Temperature | Days | Low temperature effect | References | |
|---|---|---|---|---|---|---|---|
| increase | decrease | ||||||
| 1 | 2 | 3 | 4 | 5 | 6 | 7 | 8 |
| Fish | |||||||
| White blood cell, hemoglobin, and hematocrit | Carp | 210.2±15 g | 15°C | 12 days | √ | Amin and Khan, 2016 | |
| White blood cell, hemoglobin, and hematocrit | Snow trout | - | 5–10°C | - | √ | Kapila et al., 2002 | |
| Blood leukocytes | Gilthead sea bream | 98.8±3.5 g | 12–8°C | 24 h | √ | Sala-Rabanal et al., 2003 | |
| Hematocrit | Red spotted grouper, Epinephelus akaara | 47.6 to 90.8 g | 15°C | 7 days | √ | Cho et al., 2015 | |
| Red blood cell count, hemoglobin, and PVC | Snow trout | - | 5–10°C | - | √ | Kapila et al., 2002 | |
| Triglyceride and cholesterol contents | Nile tilapia | 25.40±0.84 g | 16–19°C | 60 days | √ | Hassaan et al., 2019 | |
| The expression of Δ 9D gene, liver superoxide dismutase, hematocrit, hemoglobin, red blood cell count and white blood cell count | Nile tilapia | 25.40±0.84 g | 16–19°C | 60 days | √ | Hassaan, et al., 2019 | |
| Alanine amino transferase, aspartate amino transferase, alkaline phosphatase, lactate dehydrogenase, triglyceride and cholesterol | Nile tilapia | 25.40±0.84 g | 16–19°C | 60 days | √ | Hassaan et al., 2019 | |
| Serum glutamic-oxaloacetic transaminase activity | Red spotted grouper, Epinephelus akaara | 47.6 to 90.8 g | 15°C | 7 days | √ | Cho et al., 2015 | |
| Plasma glucose | Sea bream | 98.8±3.5 g | 12–8°C | 24 h | √ | Sala-Rabanal et al., 2003 | |
| Plasma potassium and calcium levels, leukocytes | Sea bream | 98.8±3.5 g | 12–8°C | 24 h | √ | Sala-Rabanal et al., 2003 | |
| Plasma magnesium concentration | Sea bream, Sparus aurata | 98.8±3.5 g | 12–8°C | 24 h | √ | Sala-Rabanal et al., 2003 | |
| Glutathione level | Asian catfish, Clarias batrachus | 80.60±5.34 g | 10–15°C | 7 days | √ | Singh et al., 2013 | |
| Aspartate aminotransferase (AST), alanine aminotransferase (ALT), and oxidative stress | Hybrid red tilapia, ♂Oreochromis niloticus × ♀O. mossambicus | 11.11±1.03 g | 13°C | 15 days | √ | Refaey et al., 2023 | |
| Blood biochemical indices and hepatic oxidative response | Nile tilapia | 28.50±0.25 g | 16–19°C | 47 days | √ | Soaudy et al., 2021 | |
| Total blood cell counts and DNA | Grouper, Epinephelus coioides | 150±5 g | 13°C | 48 h | √ | Zhenzhu et al., 2018 | |
| AST, ALT, LDH, genes related to lipid metabolism and gene expression of inflammatory cytokines | Grouper, Epinephelus coioides | 150±5 g | 13°C | 48 h | √ | Zhenzhu et al., 2018 | |
| Serum cortisol | Nile tilapia, Oreochromis niloticus | 120±20 g | 15°C | 28 days | √ | Dellagostin et al., 2022 | |
| Total cholesterol (TC), triglycerides (TG), LDL-C | Schizothora× prenanti | 124.87±3.44 g | 6°C | 30 days | √ | Wang et al., 2024 | |
| Glucose | Schizothora× prenanti | 124.87±3.44 g | 6°C | 30 days | √ | Wang et al., 2024 | |
| Crustaceans | |||||||
| Hepatopancreatic duct damage, alanine aminotransferase (ALT), alkaline phosphatase (ALP), lactate dehydrogenase (LDH L), and uric acid (UA) | Pacific white shrimp, Litopenaeus vannamei | 32 g | 18°C and 10°C | 24 h | √ | Zhu et al., 2024 a | |
| Total hemocyte count (THC) and RBC | Pacific white shrimp, Litopenaeus vannamei | 1.59±0.03 g | 20°C | 8 weeks | √ | Mai et al., 2025 | |
Table 2.
Effects of various diet supplementations on fish and crustacean responses at suboptimal temperatures (note: these results compared to the control without any additives)
| Reference | Species | IW | Temperature | Added nutrient and dose | Main results |
|---|---|---|---|---|---|
| 1 | 2 | 3 | 4 | 5 | 6 |
| Fish | |||||
| Šegvić-Bubić et al., 2013 | European sea bass, Dicentrarchus labrax | 1.60±0.03 g | 12°C for 24 h | Propolis at 2.5 g kg−1 for 10 weeks | ↕survival; ↑SGR; ↑FCE; ↑triglycerides; ↕AST; ↕ALP; ↓glucose; ↑SOD |
| Soltanian et al., 2014 | Striped catfish, Pangasianodon hypophthalmus | 1.27±0.24 g | 15°C for 24 h | β-glucan at 2% for 9 weeks | ↕serum cortisol; ↕glucose; ↓mortality |
| Kim et al., 2017 | Olive flounder, Paralichthys olivaceus | 19.5 g | 16.4±0.36°C | Taurine up to 1% for 10 weeks | ↑WG; ↓FCR; ↑SGR; ↑PER; ↕proximate compositions; ↑Ht; ↑Hb; ↑glucose; ↑TP; ↓total cholesterol; ↑NBT; ↑MPO; ↑Ig; ↑SOD; ↑lysozyme; ↕expression IGF-1 |
| Gunathilaka et al., 2019 | Red seabream, Pagrus major | 108.9±1.58 g/fish | 14.15±1.95°C | Taurine 1% with soybean meal up to 35% for 20 weeks | ↑hepatic IGF-1 mRNA; ↑FBW; ↑WG; ↑FI; ↑PER; ↑FCR; ↑hematocrit; ↑hemoglobin; ↑cholesterol; ↕whole body proximate composition |
| Hassaan et al., 2019 | Nile tilapia, Oreochromis niloticus | 25.40±0.84 g | 16–19°C | Propolis-extract at 4 g kg−1 for 8 weeks | ↑survival; ↑FBW; ↑WG; ↑SGR; ↑FI; ↓FCR; ↑Ht; ↑Hb; ↑RBCs; ↑WBCs; ↓ALT; ↓AST; ↓ALP; ↓LDH; ↓triglyceride; ↓cholesterol; ↑LDL-C; ↑HDL-C |
| Reda et al., 2020 | Nile tilapia, Oreochromis niloticus | 7.31±0.05 g | 21°C | Total substitution of dietary fish oil with plant oils (corn, sunflower and linseed) for 4 weeks | ↕hematological parameters; ↕alpha globulin-1; ↕alpha globulin-2; ↕beta globulin |
| Abdel-Ghany et al., 2021 | Nile tilapia, Oreochromis niloticus | 7.33±0.12 g fish−1 | 15°C | A mixture of fish oil and corn oil (1:1 ratio) at 70–85 g kg−1 for 60 days | ↑FBW; ↑ADG; ↑SGR; ↑FCR; ↑PER; ↑surviving the acute cold stress; ↓SFA |
| Ale et al., 2021 | Piaractus mesopotamicus | 12.2±2.5 g | 14±0.1°C | Red seaweed (Pyropia columbina) for 60 days | ↑hemoglobin; ↓triglycerides; ↓cholesterol; ↓hepatic glycogen; ↑SOD; ↑MCHC; ↕MCV; ↕Ht |
| Barriviera et al., 2021 | Nile tilapia, Oreochromis niloticus | 1027.7±10.5 g | 18°C | Substitution of soybean oil with linseed oil at 30 g kg−1 for 7 weeks | ↑DWG; ↑FIN; ↕mortality; ↑PER; ↑FY; ↕fatty acid deposition and ratio; ↕fillet quality |
| Soaudy et al., 2021 | Nile tilapia, Oreochromis niloticus | 28.50±0.25 g | 16–19° | Propylene glycol at 7.5 mL kg−1 for 47 days | ↑WG; ↑SGR; ↑FI; ↓FCR; ↑PER; ↑survival; ↓ALT; ↓AST; ↓ALP; ↑CAT; ↑GSH; ↑MDA; ↑SOD; ↑GPx; ↑TP; ↑albumin; ↑globulin; ↑cholesterol; ↑Δ 9D; ↑HDL-C; ↓LDL-C; ↑triglyceride |
| Tewodros et al., 2023 | Nile tilapia (Oreochromis niloticus) fry | 1.6±0.074 g | 22.88±0.48°C | Prebiotics – mannan-oligosaccharide (MOS) at 3 g kg−1 for 9 weeks | ↕FW; ↕WG; ↕SGR; ↕FCR; ↕fish carcass composition; ↑fatty acid profile; ↑intestinal morphology |
| Bano et al., 2023 | Striped catfish, Pangasianodon hypophthalmus | 101.60±1.27 g | 17°C | β-glucan for 12 weeks | ↑FW; ↑NWG; ↑SGR; ↑survival; ↕whole-body proximate analysis; ↕fatty acid profile; ↓serum cortisol; ↓glucose; ↑CAT; ↑SOD |
| Refaey et al., 2023 | Hybrid red tilapia (♂Oreochromis niloticus × ♀O. mossambicus) | 11.11±1.03 g | 13°C | Aquafat-O®(a commercial product rich in high polyunsaturated fatty acids) up to 69.60 g kg−1 | ↑FBW; ↑HSI; ↓AST; ↓ALT; chemical composition of the fish body (↑moisture; ↑protein contents, ↓fat); severely altered histopathological conditions in the liver and gills; ↓SOD; ↓TAC; ↓GSH; ↓CAT; ↑LPO |
| Alrashada et al., 2023 | Nile tilapia, Oreochromis niloticus | 28.61±0.20 g | 18°C | Propolis at 10 g kg−1 for 4 weeks | ↓FBW; ↓BWG; ↓SGR; ↑FI; ↑FCR; ↓GSH; ↓SOD; ↓CAT; ↓MDA; ↕MPO |
| Vakili et al., 2023 | Zebrafish, Danio rerio | 0.47±0.04 g | 10±2°C | Nutmeg seed meal (Myristica fragrans) | ↑total protein; ↑total immunoglobulin (Ig); ↑lysozyme; ↑SOD; ↑CAT; ↑growth hormone (gh); ↑insulin growth factor-1 (igf-1) |
| El Basuini et al., 2024 | Nile tilapia | 4.39±0.08 g/fish | 21°C | Nano-curcumin at 150 mg kg−1 for 56 days | ↕WG; ↕FI; ↕FCR; ↕FER; ↕SGR; ↕CF; ↕survival rates; ↕intestinal enzymes; ↑lysozyme; ↑GPx; ↑SOD; ↑CAT |
| Behairy et al., 2024 | Nile tilapia, Oreochromis niloticus | 31.03±0.07 g | 18°C | Alpha-lipoic acid (ALA) at 600 mg kg−1 diet for 60 days | ↑FBW; ↑WG; ↑FI; ↑SGR; ↑FCR; ↕whole body proximate composition; serum glucose and cortisol; ↕RBCs; ↕Hb; ↕total protein; ↕albumin; ↕globulin;↕cholesterol; ↑triglycerides; ↑glucose; ↑cortisol; ↓AChE; ↑antioxidant capacity; ↓gene expression (Hsp70, caspase-3, p53, and PCNA) |
| Sutili et al., 2024 | Nile tilapia, Oreochromis niloticus | 9.13±0.04 g | 20°C | β-glucan, citral, and eugenol (GCE) at the same concentrations (1.0, 0.5, and 0.5 g kg−1, respectively) for 60 days | ↕WG; ↕FW; ↕FE; ↕survival; ↑crude protein; ↓crude fat; ↑lysozyme; ↑MPO; ↑lysozyme; ↑blood leukocytes; ↑hemolytic |
| Soaudy et al., 2024 | Nile tilapia, Oreochromis niloticus | 7.56±0.10 g | 14–16°C | Gum Arabic and lecithin at 4 g kg−1 gum Arabic and 10 g kg−1 lecithin for 60 days | ↑FBW; ↑WG; ↑SGR; ↓FCR; ↑FI; ↑survival; ↓cholesterol; ↑triglycerides; ↑HDL-C; ↑Δ 9D;↓AST; ↓glucose; ↓ALT; ↓cortisol; ↓GPx; ↓SOD; ↓GSH; ↓CAT; ↓total antioxidant capacity |
| Mustafa et al., 2024 | Nile tilapia, Oreochromis niloticus | -- | 15±2°C | 500 mg kg−1 vitamin C, 30 mg kg−1 zinc | ↕WG; ↕FW; ↑histological analysis; ↑immune respons |
| Youssuf et al., 2025 | Nile tilapia, Oreochromis niloticus | 5.32±1.1 g | 12°C | Microalgae (Chlorella vulgaris nanoparticle) up to 5 g kg−1 for 6 weeks | ↑WG; ↓FCR; ↓MDA; ↑meat quality parameters; ↑SOD; ↑GSSG; ↓ATP; ↕AMP; ↓AST; ↑fatty and amino acids |
| Shehata et al., 2025 | Nile tilapia, Oreochromis niloticus | 5.02±0.02 g | 16°C | Essential oil of bay laurel (Laurus nobilis) at 1.5 g kg−1 for 84 days | ↑FCR; ↑FI; ↑FW; ↑HIS; ↑ISI; ↑K; ↑SGR; ↑SR; ↑VSI; ↑WG; ↑intestinal morphometry indices; ↑TP; ↓cholesterol; ↑lysozyme; ↑bacterial inhibition; ↑CAT, catalase; ↑GPx, glutathione peroxidase; ↓MDA, malondialdehyde; ↑SOD; ↑GLUT4; ↑IGF–1; ↓TNF–α |
| Crustacean | |||||
| Hoffling et al., 2024 | Pacific white shrimp, Penaeus vannamei | 10.9±0.06 g | 22°C for 108 h | Microalgae Aurantiochytrium sp. at 1% for 9 weeks | ↕growth performance; ↑mortality; ↕hematoimmunological parameters |
| Zabolinia et al., 2024 | Pacific white shrimp, Litopenaeus vannamei | 7.1±2.1 g | 7°C for 12 h | Prosopis juliflora at 0.5–1% for 60 days | ↑SOD; ↑lysozyme; ↑GPx; ↑survival; |
| Mai et al., 2025 | Pacific white shrimp, Litopenaeus vannamei | 1.59±0.03 g | 20°C for 8 weeks | Taurine up to 1.0% for 8 weeks | ↓WGR, ↓FE, ↓PER; ↑THC; ↑SOD; ↑CAT; ↓intracellular ROS content; ↓mRNA expression of cell apoptosis genes; ↑mRNA expression of cell autophagy genes |
[i] AChE: acetylcholine esterase; ADG: average daily gain; ALT: alanine transaminase; AMP: adenosine monophosphate; AST: aspartate transaminase; ATP: adenosine 5′-triphosphate; CAT: catalase; CF: condition factor; DWG: daily weight gain; FBW: fish body weight; FCE: feed conversion efficiency; FCR: feed conversion ratio; FE: feed efficiency; FER: feed efficiency ratio; FI: feed intake; FIN: relative feed intake; FW: final weight; FY: fillet yield; G6PD: glucose-6-phosphate dehydrogenase deficiency; GLU: glucose; GLUT4: glucose transporter type 4; GPx: glutathione peroxidase; GR: growth rate; GSH: glutathione; GSSG: glutathione disulfide; Hb: hemoglobin; HDL-C: high-density lipoprotein cholesterol; HSI: hepatosomatic index; hsp70: heat shock protein 70; Ht: hematocrit; Ig: total immunoglobulin; IGF: insulin-like growth factor; il-1β: interleukin-1 beta; ISI: intestinal somatic index; LDH: lactate dehydrogenase; LDL-C: low-density lipoprotein cholesterol; LPO: lipid peroxidase; MCHC: corpuscular hemoglobin concentration; MCV: corpuscular volume; MDA: malondialdehyde; MPO: myeloperoxidase; NBT: nitro blue tetrazolium activity; NEFA: non-esterified fatty acid; NWG: net weight gain; p53: tumor protein p53; PCNA: proliferating cell nuclear antigen; PER: protein efficiency ratio; PR: protein retention efficiency; RBCs: red blood cell count; SFA: saturated fatty acids; SGR: specific growth rate; SOD: super oxide dismutase; TAC: hepatic total antioxidant capacity; TAN: total adenine nucleotide; T-CHO: total cholesterol; THC: total hemocyte count; TNF-α: tumor necrosis factor-alpha; TP: total protein; WBCs: white blood cell count; WG: weight gain; WGR: weight gain rate; Δ 9D: gene expression of delta-9-desaturase in livers.
Table 3.
Optimum feeding frequency of some fish species at low temperatures
| Optimum feeding frequency | Fish species | IBW | Temperature | References |
|---|---|---|---|---|
| Once a day, five times a week | Sub-adult olive flounder | 271.44±0.37g | 13.5±2.10°C | Cho, 2011 |
| Once a day, five times a week | Catfish | 4.7±0.1 g | – | Li et al., 2006 |
| Once a day, daily | Juvenile turbot | 62 g | 14.1±1.5°C | Blanquet and Oliva-Teles, 2010 |
| Twice a week | Fathead minnow | 0.88±0.04 g | 6°C | Roy et al., 2019 |
| Golden shiners | 0.88±0.02 g | 8°C | ||
| Every other day/more than once a day | Juvenile Atlantic halibut | 22–75 g | 13±1°C | Schnaittacher et al., 2005 |
| Twice a week | Juvenile bluegill (Lepomis macrochirus) | 1.46±0.06 g | 7–9°C | Roy et al., 2017 |
| Twice a week | Hybrid bluegill (L. cyanellus × L. macrochirus) | 2.58±0.22 g | 7–9°C | Roy et al., 2017 |
| Twice a day or every other day | Juvenile turbot (Psetta maxima Linnaeus, 1758) | 15.23±2.99 g | 5–7.5°C | Türker, 2006 |
Table 4.
Different physical methods used to mitigate the cold stress condition of fish to maintain their production during the winter
| Overwintering methods | Fish type | IBW | References |
|---|---|---|---|
| Underground warm water | Tilapia | 20 g | Cruz and Ridha, 1994 |
| Increase the depth of the pond | Tilapia | 122–262 g; 250 g | Dan and Little, 2000; El-Sayed et al., 1996 |
| Green houses | Tilapia | 2.6±0.3 g | Zvavahera et al., 2018 |
| Heated effluent from power plants | Tilapia | 0.25 g; 2.90 g | Kirk et al., 1972; Behrends et al., 1990 |
| Plastic sheet covering | Tilapia | 6.4 g | Nour et al., 1996; |
| Biofloc technology | Tilapia | 6.34±0.01 g; 28.50±0.25 g | Soltan et al., 2015; Soaudy et al., 2021 |
| Biofloc technology | Channel catfish | 560.8±5.8 g | Green et al., 2015 |
| Selecting fish strains that can tolerate low temperatures | Tilapia | 5.1 g; 77±23 g | Charo-Karisa et al., 2005; Sifa et al., 2002 |
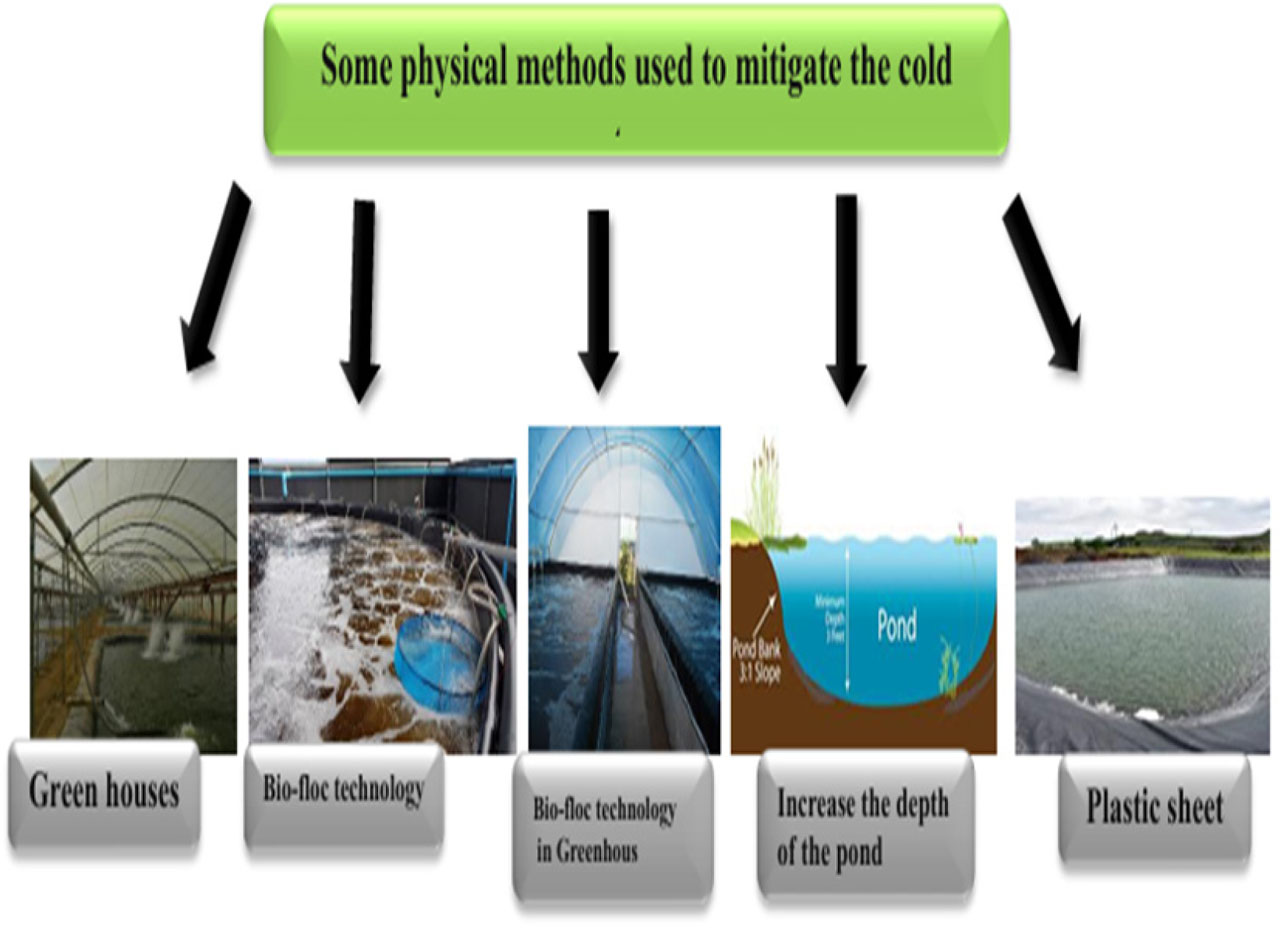
Figure 3.
Physical methods used to mitigate the cold.
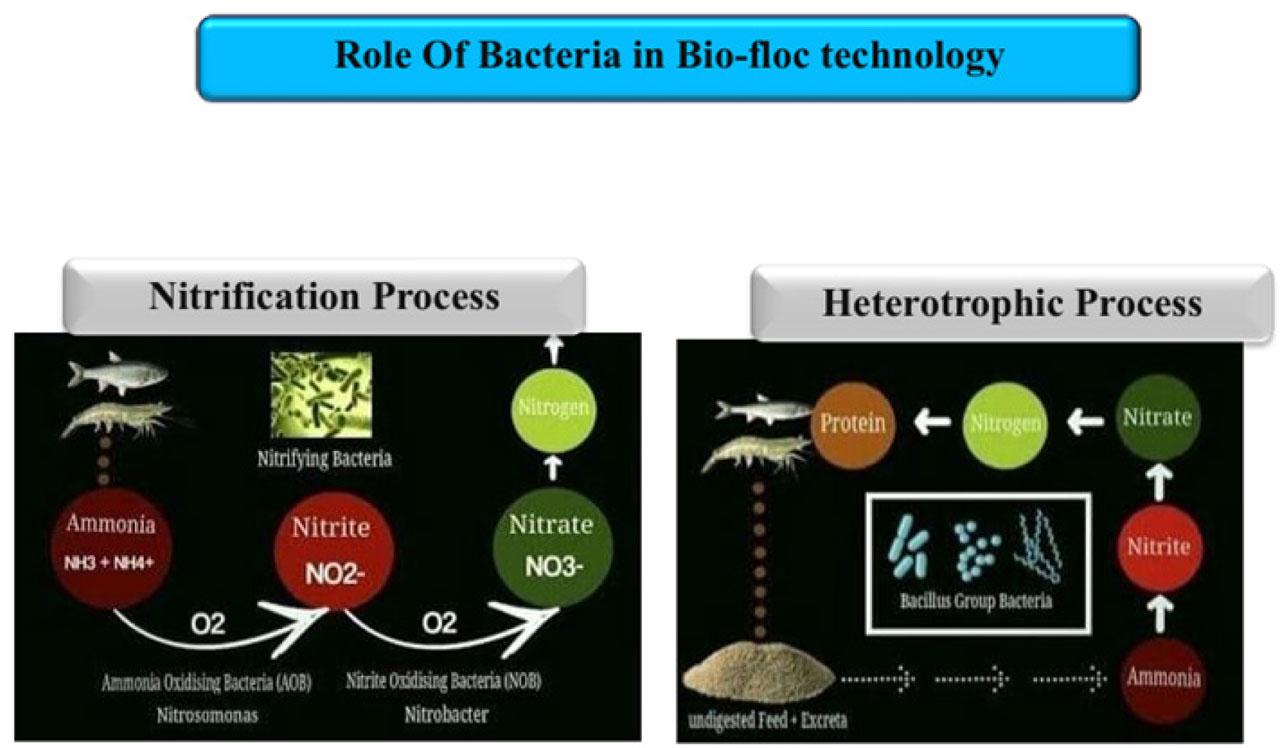
Figure 4.
The role of bacteria in biofloc technology.