
Table 1.
Chemical composition of incubated diet (g/kg DM)
| Ingredients | CFM1 | Berseem hay | Rice straw | Diet2 |
|---|---|---|---|---|
| Dry matter | 903 | 890 | 940 | 902 |
| Organic matter | 923 | 884 | 851 | 900 |
| Crude protein | 165 | 128 | 42 | 138 |
| Ether extract | 47 | 54 | 19 | 47 |
| Nonfibrous carbohydrates | 414 | 224 | 166 | 313 |
| Neutral detergent fiber | 297 | 478 | 624 | 402 |
| Acid detergent fiber | 175 | 381 | 394 | 279 |
| Metabolizable energy (Mcal/kg DM)3 | 3.60 | 2.65 | 1.98 | 3.06 |
1 Concentrate feed mixture (CFM) contained per kg DM: 170 g soybean meal, 395 g wheat bran, 395 g maize, 20 g limestone, 10 g vitamins and minerals mixture, and 10 g salt.
3 Calculated (NRC, 2001).
Table 2.
Volatile compounds in geranium oil (Pelargonium graveolens L.) identified by GC-MS analysis
| Compound1 | RT2 | Concentration3 (%) |
|---|---|---|
| α-Pinene | 5.19 | 1.1 |
| Myrcene | 7.94 | 0.5 |
| Linalool | 10.18 | 7.9 |
| Menthone | 10.99 | 2.0 |
| Isomenthone | 12.89 | 8.3 |
| α-Terpineol | 13.86 | 1.1 |
| Citronellol | 15.41 | 32.4 |
| Trans-geraniol | 16.55 | 13.3 |
| Citronellyl formate | 17.21 | 15.4 |
| Geranyl formate | 18.39 | 3.4 |
| β-Caryophyllene | 23.20 | 1.8 |
| Isoledene | 24.07 | 4.0 |
| Muurolene | 25.56 | 1.7 |
| Guaia-6,9-diene | 27.29 | 0.8 |
| Phenylethyltiglate | 29.62 | 1.4 |
| Eudesmol | 30.84 | 4.9 |
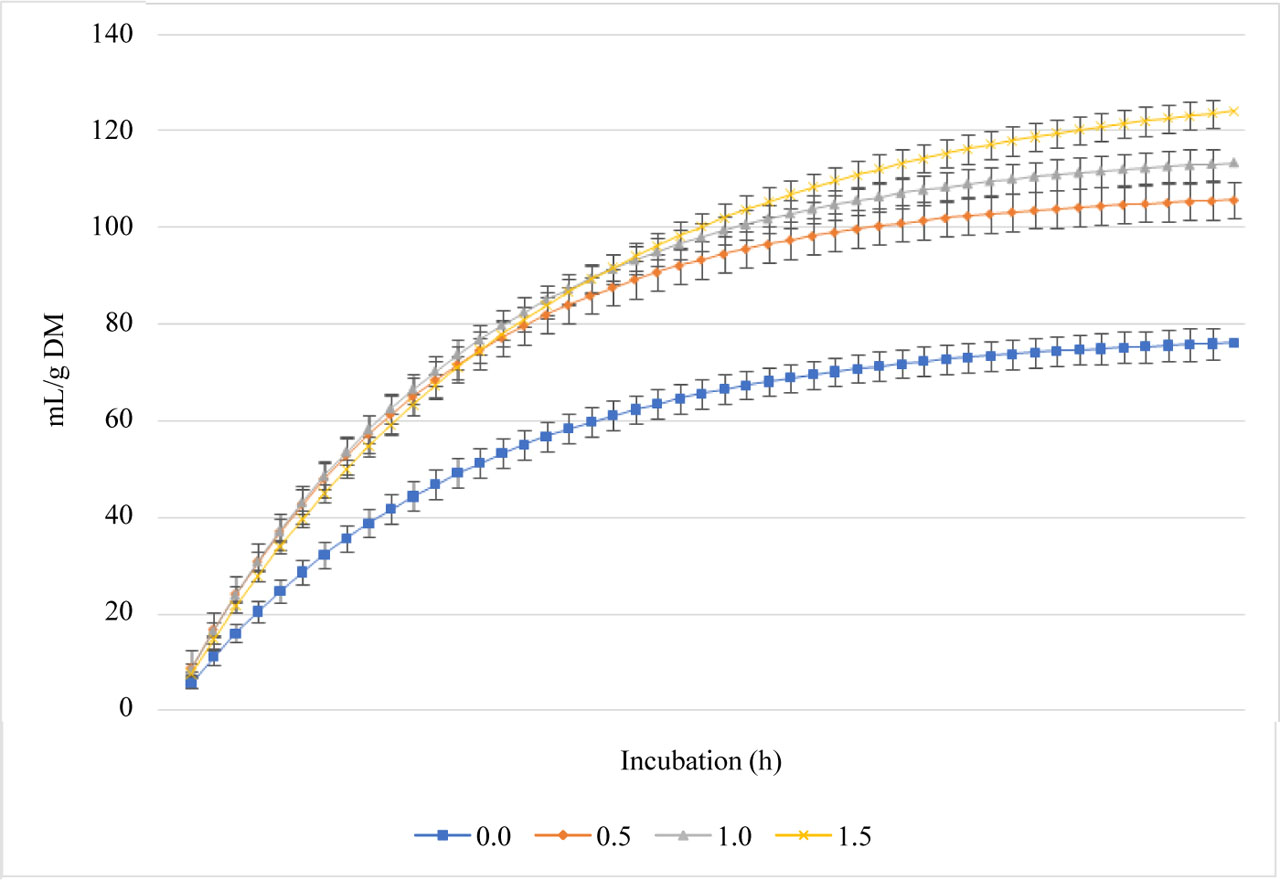
Figure 1.
In vitro ruminal gas production (mL/g incubated DM) of a total mixed ration supplemented with different levels of geranium oil.
Table 3.
In vitro rumen gas production (GP), methane (CH4) and carbon dioxide (CO2) kinetics as affected by increasing levels of geranium oil (%, dry matter basis)
| Level | GP parameters1 | CH4 parameters2 | CO2 parameters3 | ||||||||
|---|---|---|---|---|---|---|---|---|---|---|---|
| A | C | Lag | A | C | Lag | %4 | A | C | Lag | %4 | |
| 0 | 78 c | 0.076 a | 1.55 | 28.6 b | 0.035 | 1.42 | 29.3 a | 58.8 c | 0.036 c | 2.47 | 63.5 |
| 0.5 | 108 b | 0.084 a | 1.62 | 35.6 b | 0.036 | 1.56 | 27.5 ab | 75.0 b | 0.045 b | 2.37 | 62.5 |
| 1 | 116 b | 0.078 a | 1.56 | 36.5 b | 0.042 | 1.54 | 27.9 ab | 79.1 b | 0.048 ab | 2.18 | 62.7 |
| 1.5 | 132 a | 0.060 b | 1.65 | 38.9 a | 0.035 | 1.56 | 25.4 b | 88.3 a | 0.053 a | 2.35 | 65.5 |
| SEM | 2.0 | 0.0020 | 0.09 | 1.05 | 0.0037 | 0.061 | 0.77 | 1.65 | 0.0017 | 0.241 | 1.28 |
| P value | |||||||||||
| treatment | <0.001 | 0.001 | 0.852 | 0.007 | 0.519 | 0.356 | 0.045 | <0.001 | 0.008 | 0.859 | 0.392 |
| linear | <0.001 | 0.563 | 0.962 | 0.007 | 0.212 | 0.193 | 0.231 | <0.001 | 0.002 | 0.420 | 0.683 |
| quadratic | <0.001 | 0.044 | 0.425 | 0.002 | 0.460 | 0.228 | 0.025 | <0.001 | 0.004 | 0.883 | 0.493 |
{ label (or @symbol) needed for fn[@id='j_aoas-2025-0118_tfn_007'] } Means in the same column with different letters differ (P<0.05). The P-value represents the observed significance level of the F-test for the treatment effect; SEM stands for the standard error of the mean.
1 GP parameters: A is the asymptotic GP (ml/g DM), C is the rate of GP (/h), Lag is the initial delay before GP begins (h).
2 Methane (CH4) production parameters: A is the asymptotic CH4 production (ml/g DM), C is the rate of CH4 production (/h), Lag is the initial delay before CH4 production begins (h).
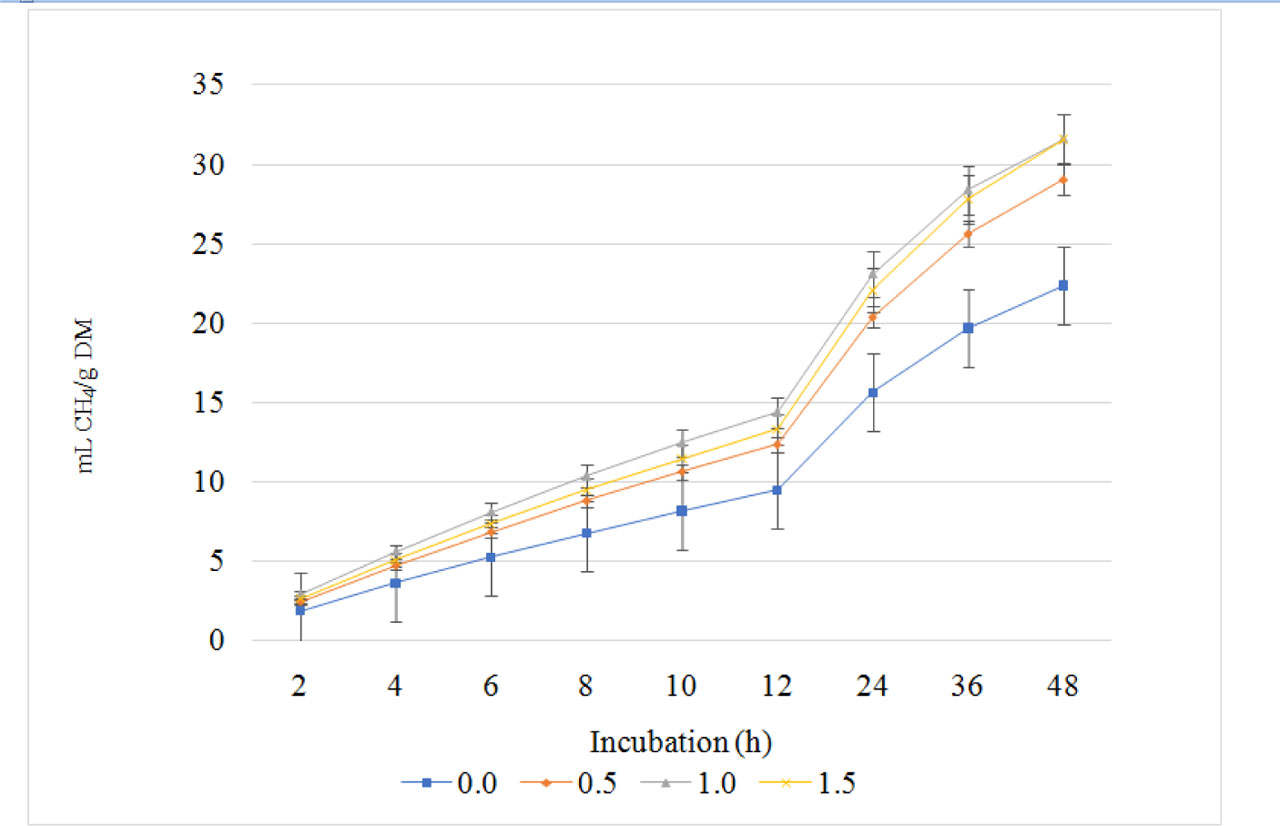
Figure 2.
In vitro ruminal methane (CH4) production (mL/g incubated DM) of a total mixed ration supplemented with different levels of geranium oil.
Table 4.
In vitro rumen fermentation profile of diet with increasing levels of geranium oil (%, dry matter basis)
| Level | Degradability1 | SCFAs2 | Fermentation3 | ||||||||||||||
|---|---|---|---|---|---|---|---|---|---|---|---|---|---|---|---|---|---|
| dDM | dNDF | dADF | Total | C2 | C2 (%) | C3 | C2 (%) | C2: C3 | C4 | C2 (%) | pH | NH3-N | ME | PF24 | MCP | GY24 | |
| 0 | 473 c | 439 b | 412 c | 23.4 c | 11.4 c | 48.9 | 7.90 b | 33.7 | 1.47 | 4.08 | 17.4 | 6.27 b | 10.4 | 4.68 b | 6.22 a | 328 | 139 b |
| 0.5 | 511 bc | 489 ab | 463 bc | 27.4 b | 13.7 b | 50.0 | 9.25 a | 33.8 | 1.48 | 4.42 | 16.1 | 6.60 a | 10.6 | 5.31 a | 4.83 b | 306 | 183 a |
| 1 | 536 ab | 510 a | 492 ab | 27.3 b | 13.9 b | 51.1 | 9.80 a | 35.9 | 1.42 | 3.54 | 12.9 | 6.53 a | 10.7 | 5.44 a | 4.74 b | 321 | 183 a |
| 1.5 | 574 a | 539 a | 524 a | 30.5 a | 15.8 a | 52.0 | 9.80 a | 32.1 | 1.62 | 4.84 | 15.8 | 6.50 ab | 10.8 | 5.50 a | 4.63 b | 354 | 175 a |
| SEM | 11.0 | 12.0 | 12.3 | 0.34 | 0.40 | 2.00 | 0.292 | 1.21 | 0.100 | 0.517 | 1.73 | 0.055 | 0.28 | 0.046 | 0.151 | 12.5 | 5.3 |
| P value | |||||||||||||||||
| treatment | 0.001 | 0.002 | 0.001 | <0.001 | 0.004 | 0.716 | 0.005 | 0.258 | 0.577 | 0.395 | 0.376 | 0.013 | 0.804 | <0.001 | 0.002 | 0.126 | 0.001 |
| linear | 0.003 | 0.003 | 0.002 | <0.001 | 0.002 | 0.446 | 0.002 | 0.239 | 0.732 | 0.487 | 0.106 | 0.009 | 0.468 | <0.001 | 0.001 | 0.679 | 0.004 |
| quadratic | 0.008 | 0.011 | 0.010 | <0.001 | 0.008 | 0.624 | 0.049 | 0.168 | 0.345 | 0.151 | 0.649 | 0.027 | 0.645 | <0.001 | 0.001 | 0.689 | 0.009 |
{ label (or @symbol) needed for fn[@id='j_aoas-2025-0118_tfn_012'] } Means in the same column with different letters differ (P<0.05). The P-value represents the observed significance level of the F-test for the treatment effect; SEM stands for the standard error of the mean.
1 dDM is dry matter degradability (mg/g incubated), dNDF is neutral detergent fiber degradability (mg/g incubated), dADF is acid detergent fiber degradability (mg/g incubated).
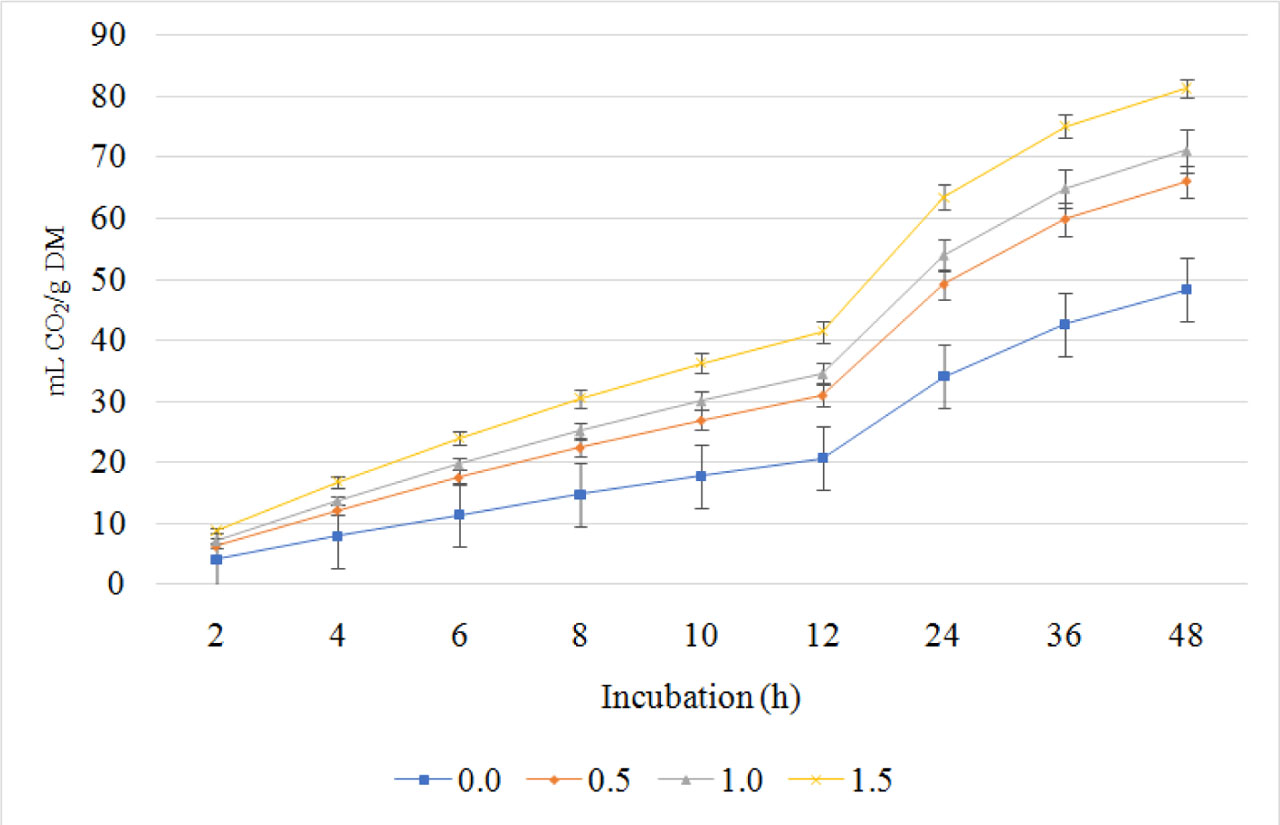
Figure 3.
In vitro ruminal carbon dioxide (CO2) production (mL/g incubated DM) of a total mixed ration supplemented with different levels of geranium oil.