
Table 1.
Quantitative analysis of secondary metabolites in the HMLE1
| Parameter | Value (mg 100 g−1) |
|---|---|
| Alkaloids | 350.3 |
| Flavonoids | 72.4 |
| Saponins | 49.9 |
| Steroids | 114.3 |
| Tannins | 63.5 |
| Terpenoids | 702.6 |
Table 2.
Selected phyto-constituents identified in HMLE1
| Name of compound | RT2 (min) | MF3 | MW (g mol−1)4 | Conc. (%)5 | QP (%)6 |
|---|---|---|---|---|---|
| Bifemelane | 23.17 | C18H23NO | 269.4 | 2.1 | 98 |
| α-pinene | 9.72 | C10H16 | 136.2 | 2.4 | 99 |
| β-Sitosterol | 20.13 | C29H50O | 414.7 | 1.1 | 96 |
| p-Cymere | 26.19 | C10H14 | 134.2 | 2.4 | 89 |
| Cadimene | 23.15 | C15H26 | 206.37 | 1.4 | 93 |
| Caryophyllene | 22.67 | C15H24 | 204.35 | 0.2 | 98 |
| Eicosanoic acid | 22.81 | C20H40O2 | 312.5 | 1.1 | 78 |
| Octadecanoic acid | 22.84 | C18H36O2 | 284.5 | 4.3 | 56 |
| Salicyclic acid | 1.87 | C7H6O3 | 138.12 | 5.7 | 98 |
| Phytol | 25.31 | C20H40O | 296.5 | 7.3 | 80 |
| Oleic acid | 27.71 | C18H34O2 | 282.5 | 1.1 | 94 |
| Tricosane | 23.76 | C23H48 | 324.6 | 2.7 | 88 |
| Protocatehuic acid | 11.12 | C7H6O4 | 154.12 | 2.3 | 76 |
| p-Coumaric acid | 11.89 | C9H8O3 | 164.16 | 0.7 | 99 |
| Caffeic acid | 13.03 | C9H8O4 | 180.16 | 4.1 | 97 |
| Kaempferol | 19.62 | C15H10O6 | 286.24 | 3.7 | 79 |
| Quercetin | 20.86 | C15H10O7 | 302.23 | 1.1 | 92 |
| Chlorogeric acid | 20.01 | C16H18O9 | 354.31 | 4.8 | 80 |
| Campesterol | 35.21 | C28H48O | 400.70 | 3.2 | 65 |
| Stigmasterol | 35.55 | C29H48O | 412.70 | 4.1 | 93 |
| 17-octadecynoic acid | 4.29 | C18H32O2 | 280.40 | 2.1 | 99 |
| Neophytadiene | 22.43 | C20H38 | 278.50 | 2.7 | 91 |
| n-Hexadecanoic acid | 23.57 | C16H32O2 | 256.42 | 1.3 | 68 |
| Undecane | 11.19 | C11H24 | 156.31 | 3.5 | 98 |
| Linoleic acid | 28.21 | C18H32O2 | 280.40 | 3.6 | 94 |
| Stearic acid | 28.47 | C18H36O2 | 284.50 | 1.2 | 99 |
| Trimethylsilane | 19.47 | C3H10Si | 74.20 | 2.3 | 85 |
| N-(Trimethylsilyl)acetamide | 8.35 | C5H13NOSi | 131.25 | 2.7 | 98 |
Table 3.
Components and proximate composition analysis (g kg−1 diet on dry matter basis) of diets containing different levels of HMLE
| Ingredients (g kg−1) | HMLE1 diets (g kg−1) | |||
|---|---|---|---|---|
| 0 | 2 | 4 | 6 | |
| Fish meal (55% CP) | 250 | 250 | 250 | 250 |
| Soybean meal (45% CP) | 250 | 250 | 250 | 250 |
| Maize flour | 430 | 428 | 426 | 424 |
| Vegetable oil | 10 | 10 | 10 | 10 |
| Vitamin premixes2 | 20 | 20 | 20 | 20 |
| Minerals premixes3 | 20 | 20 | 20 | 20 |
| Starch | 20 | 20 | 20 | 20 |
| HMLE | 0 | 2 | 4 | 6 |
| Total | 1000 | 1000 | 1000 | 1000 |
| Proximate analysis (g kg−1) | ||||
| Dry matter | 917 | 917 | 913 | 914 |
| Crude protein | 309 | 310 | 310 | 312 |
| Ether extract | 81 | 81 | 82 | 82 |
| Total ash | 83 | 82 | 83 | 83 |
| Crude fibre | 45 | 45 | 46 | 46 |
2 Vitamin premix (per kg of premix): thiamine, 2.5 g; riboflavin, 2.5 g; pyridoxine, 2.0 g; inositol, 100.0 g; biotin, 0.3 g; pantothenic acid, 100.0 g; folic acid, 0.75 g; para-aminobenzoic acid, 2.5 g; choline, 200.0 g; nicotinic acid, 10.0 g; cyanocobalamine, 0.005 g; α-tocopherol acetate, 20.1 g; menadione, 2.0 g; retinol palmitate, 100,000 IU; cholecalciferol, 500,000 IU.
Table 4.
Growth performance, nutrient utilization and survival rate of Nile tilapia fed with diets fortified with different levels of HMLE for 8 weeks1 (n=3)
| Growth indices2 | HMLE3 diets (g kg−1) | PSE4 | P-value | |||
|---|---|---|---|---|---|---|
| 0 | 2 | 4 | 6 | |||
| IBW (g) | 5.1 a | 5.1 a | 5.2 a | 5.1 a | 0.012 | 0.625 |
| FBW (g) | 30.2 d | 36.1 b | 38.3 a | 38.6 a | 2.341 | 0.001 |
| BWG (g) | 25.1 b | 31.0 a | 33.1 a | 33.5 a | 1.339 | 0.003 |
| DBWG (g day−1) | 0.5 a | 0.6 a | 0.6 a | 0.6 a | 0.011 | 0.561 |
| SGR (% day−1) | 3.2 b | 3.5 a | 3.6 a | 3.6 a | 0.081 | 0.001 |
| FI (g) | 38.2 c | 47.1 b | 50.0 a | 50.0 a | 3.411 | <0.001 |
| FCR | 1.52 a | 1.52 a | 1.48 a | 1.49 a | 0.024 | 0.051 |
| SR (%) | 91.7 a | 95.0 a | 95.0 a | 93.0 a | 1.976 | 0.326 |
Table 5.
Haematological parameters of Nile tilapia fed diets containing various levels of HMLE for 8 weeks1 (n=3)
| Parameter2 | HMLE3 diets (g kg−1) | PSE4 | P-value | |||
|---|---|---|---|---|---|---|
| 0 | 2 | 4 | 6 | |||
| PCV (%) | 18.8 b | 18.9 a | 28.4 a | 28.6 a | 0.845 | 0.011 |
| Hb (g L−1) | 45.5 c | 58.2 b | 64.3 a | 66.4 a | 1.421 | 0.003 |
| RBC (cells µL−1) | 1.21 c | 1.28 b | 1.35 a | 1.39 a | 0.021 | 0.001 |
| WBC (× 103 µL) | 115.4 c | 128.4 c | 167.1 b | 198.5 a | 6.612 | 0.004 |
| PLT (× 103 µL) | 132.3 d | 156.5 c | 188.2 b | 215.7 a | 12.671 | 0.001 |
| LYM (%) | 43.0 b | 58.0 a | 61.0 a | 63.0 a | 5.302 | 0.005 |
| HET (%) | 44.4 a | 30.0 b | 26.0 c | 25.0 c | 4.113 | 0.013 |
| MON (%) | 5.8 a | 5.2 ab | 4.9 b | 4.6 b | 0.103 | 0.020 |
| EOS (%) | 4.2 a | 3.7 a | 3.5 a | 3.3 a | 0.011 | 0.031 |
| BAS (%) | 2.6 b | 3.1 b | 4.6 a | 4.1 a | 0.112 | 0.002 |
Table 6.
Hepatic parameters of Nile tilapia fed with diets containing various levels of HMLE for 8 weeks1 (n=3)
| HMLE2 diets (g kg−1) | Parameter3 | ||
|---|---|---|---|
| ALP (IU mL−1) | AST (IU mL−1) | ALT (IU mL−1) | |
| 0 | 30.2 a | 35.4 a | 28.5 a |
| 2 | 26.1 b | 28.3 b | 25.2 b |
| 4 | 20.4 c | 25.2 c | 21.3 c |
| 6 | 19.8 c | 20.6 d | 15.4 d |
| PSE4 | 1.022 | 3.215 | 5.111 |
| P-value | 0.012 | 0.001 | 0.003 |
Table 7.
Antioxidants and immune status of Nile tilapia fed diets containing various levels of HMLE for 8 weeks (n=3)1
| Parameter2 | HMLE3 diets (g kg−1) | PSE4 | P-value | |||
|---|---|---|---|---|---|---|
| 0 | 2 | 4 | 6 | |||
| CAT (IU L−1) | 18.9 b | 22.4 b | 29.8 a | 32.1 a | 2.032 | 0.001 |
| SOD (IU L−1) | 17.8 d | 24.3 c | 28.6 b | 35.3 a | 1.671 | 0.003 |
| MDA (nmol L−1) | 4.21 a | 38.6 a | 3.02 b | 2.46 c | 0.212 | 0.001 |
| RBA (mg mL−1) | 0.2 d | 0.5 c | 0.9 b | 1.3 a | 0.013 | 0.001 |
| LYZ (unit mg−1 protein) | 3.3 d | 7.2 c | 9.4 b | 13.1 a | 0.629 | 0.013 |
Table 8.
Intestinal histomorphometry of Nile tilapia fed with diets containing various levels of HMLE for 8 weeks1 (n=3)
| HMLE2 diets (g kg−1) | Parameter3 | ||
|---|---|---|---|
| VL (µm) | VW (µm) | AA (µm2) | |
| 0 | 67.4 c | 17.2 c | 1159.3 d |
| 2 | 95.6 b | 19.3 c | 1845.1 c |
| 4 | 132.5 a | 23.1 b | 3060.6 b |
| 6 | 136.1 a | 27.2 a | 3701.9 a |
| PSE4 | 8.235 | 3.718 | 283.7 |
| P-value | <0.001 | 0.001 | 0.004 |
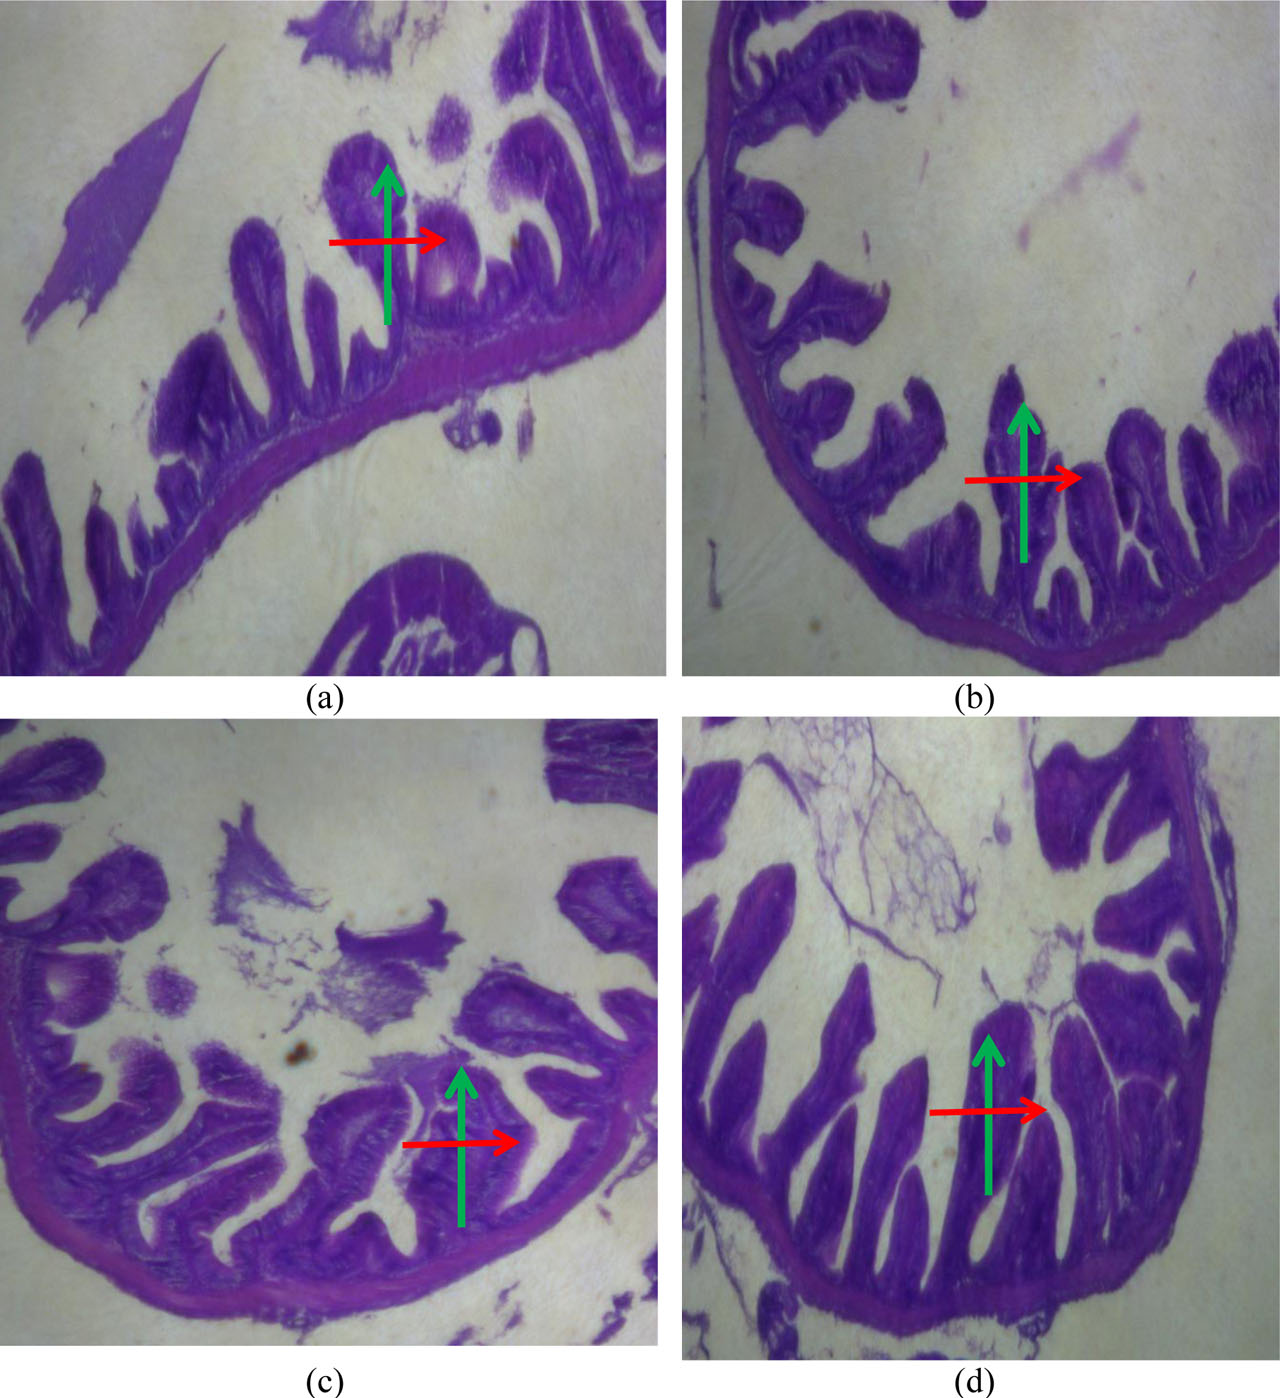
Figure 1.
Gut morphology of Nile tilapia, Oreochromis niloticus, fed different levels of dietary HMLE for 8 weeks1. (a) Gut morphology of fish fed the control (0) diet, (b) 2 g/kg, (c) 4 g/kg, and (d) 6 g/kg of HMLE-based diet. Arrow (green colour) = villus length, arrow (red colour) = villus width (HE ×40, 100) (n=3).
1HMLE = T. procumbens, M. scaber, M. pruriens, and C. papaya leaves extract
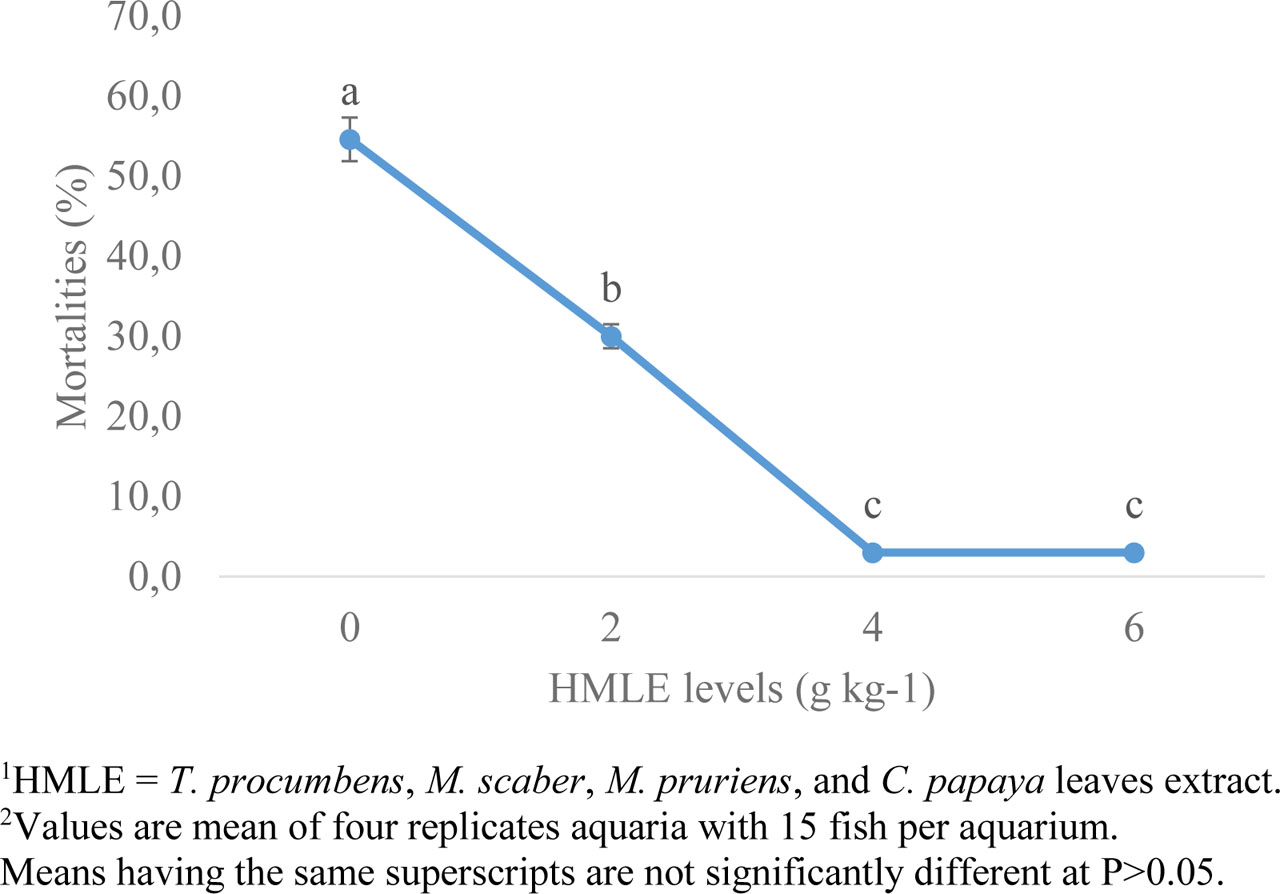
Figure 2.
Post-infestation mortality of Nile tilapia fed with diets containing various levels of HMLE1 for 8 weeks2 (n=3)