
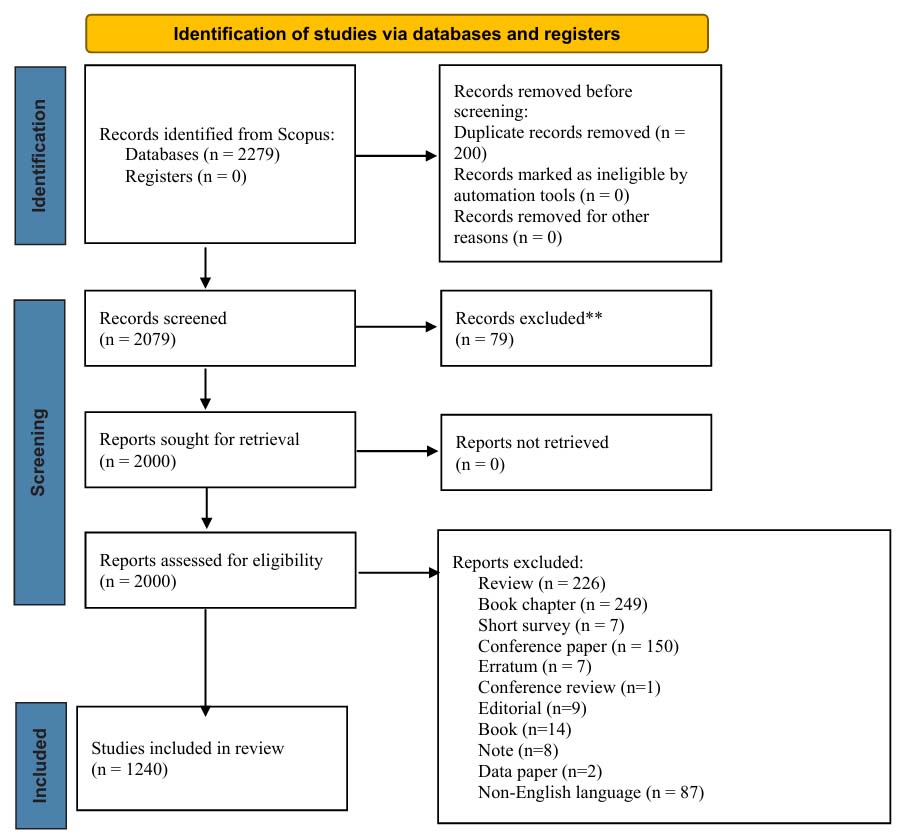
Figure 1.
Selection process flowchart, based on PRISMA software
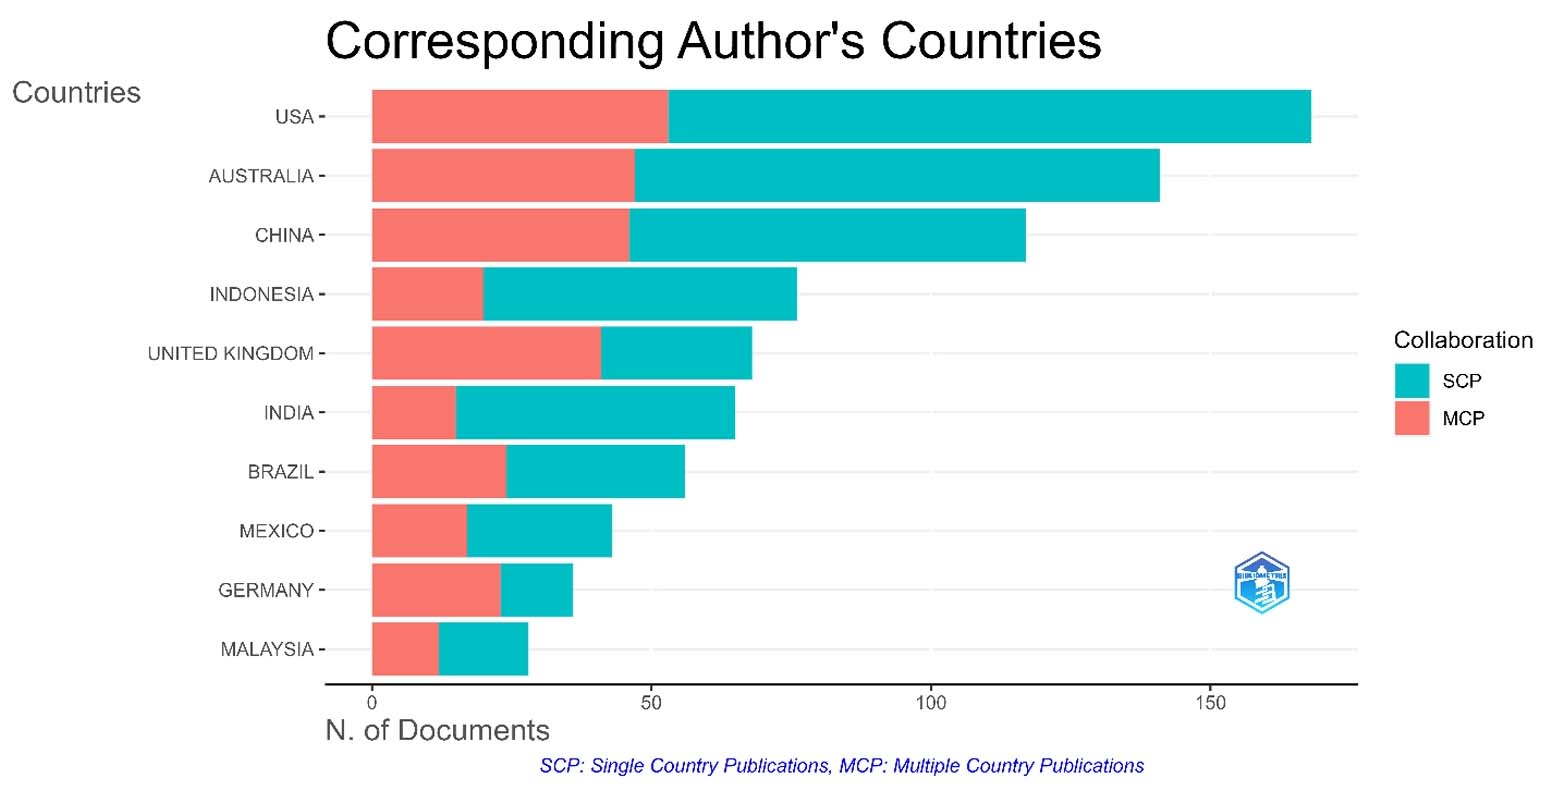
Figure 2.
Corresponding author’s country for publications. The red and blue colors, respectively, indicate papers written with/without international collaboration
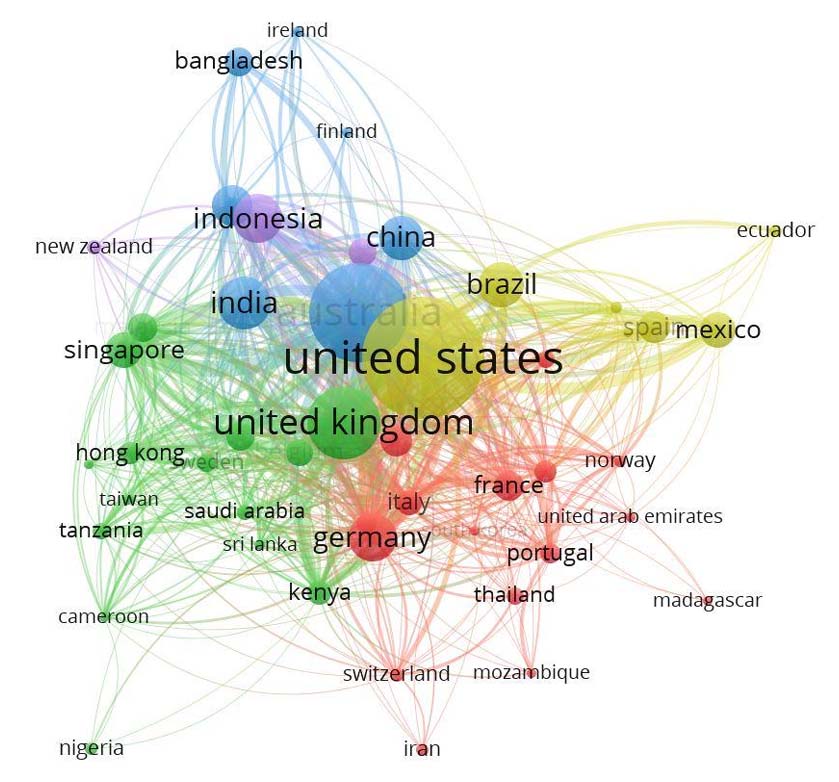
Figure 3.
Co-authorship network map of countries in the global scientific literature mangrove ecosystem services field
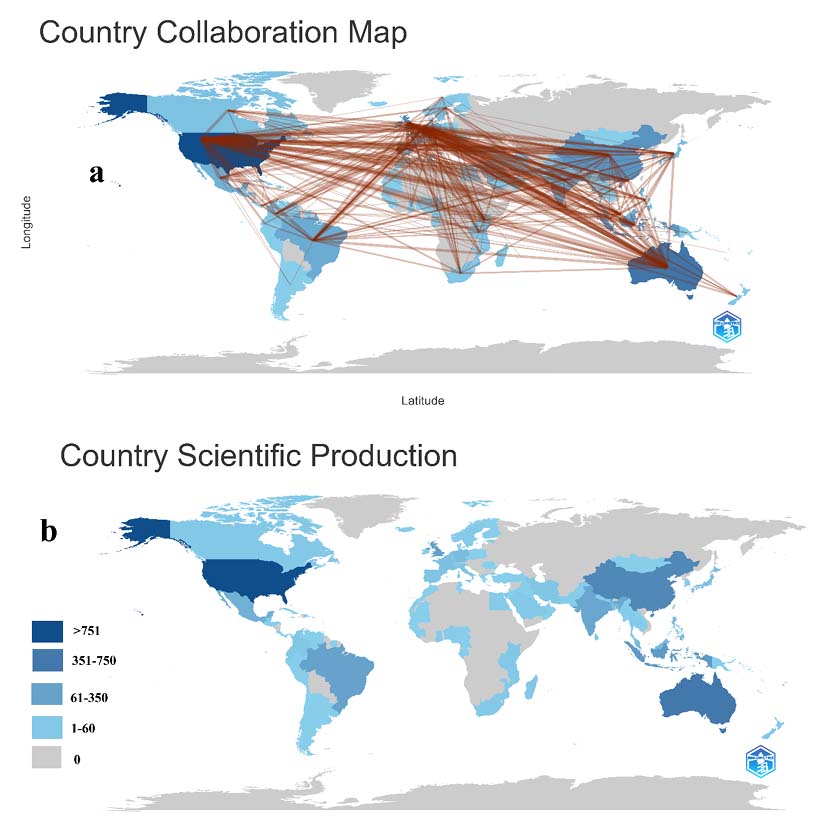
Figure 4.
Countries’ collaboration map (a) and countries’ scientific production (b) in the mangrove ecosystem services field
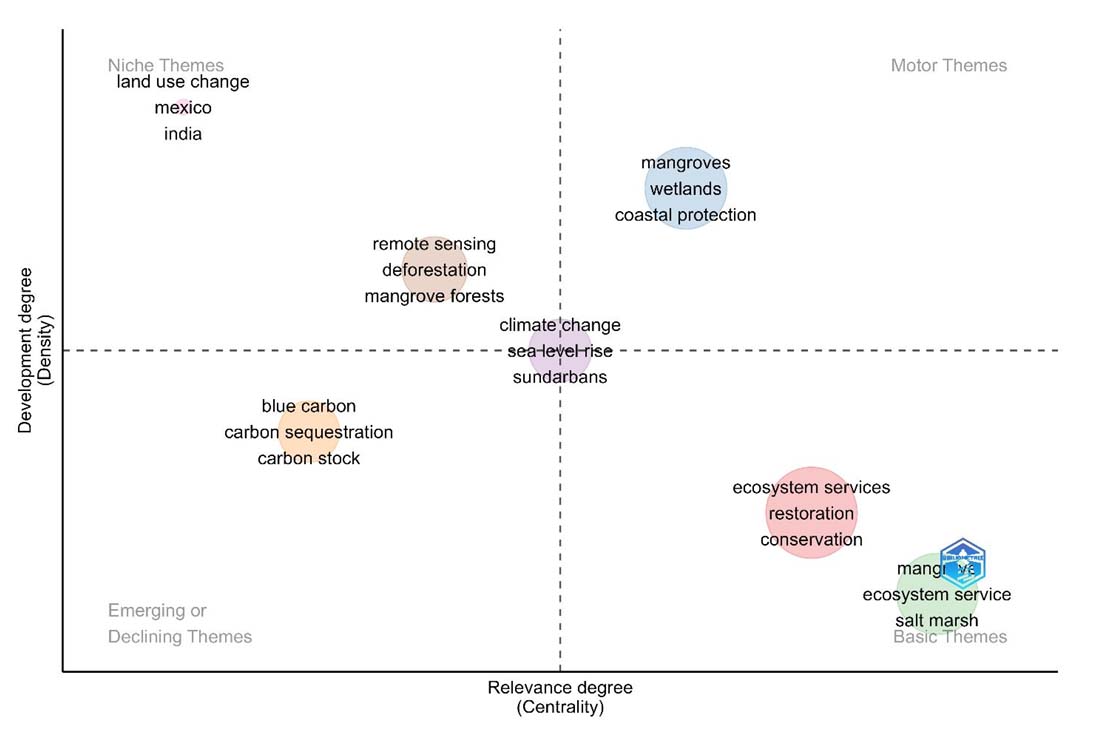
Figure 5.
Thematic map in mangrove ecosystem services
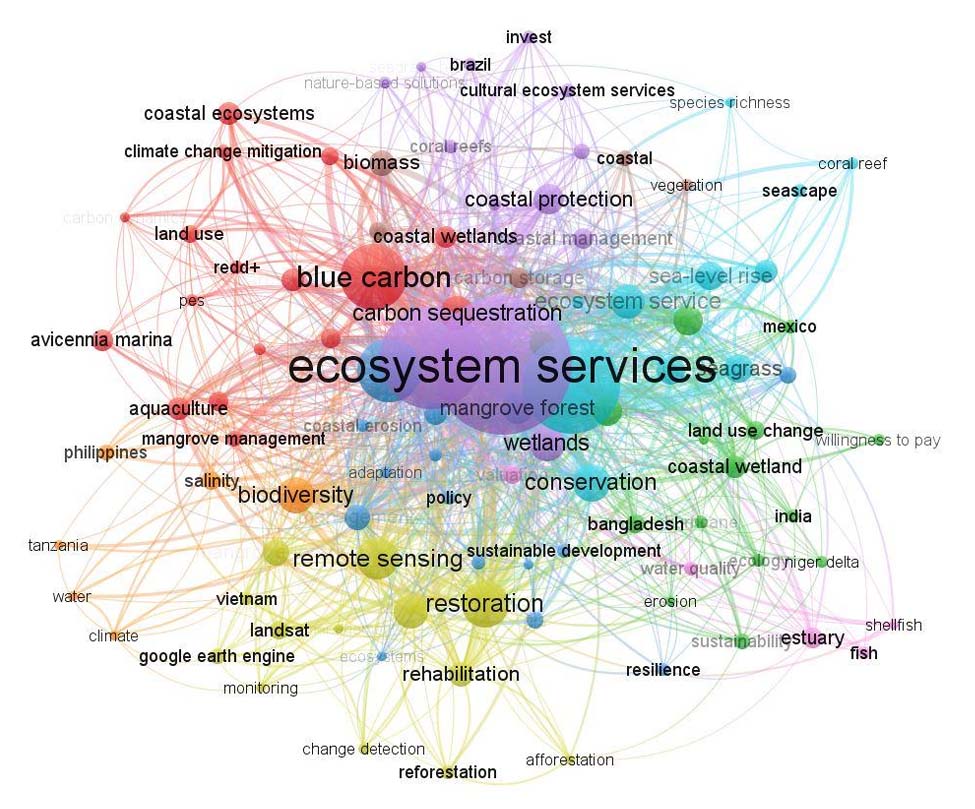
Figure 6.
Four major themes in the literature based on the 100 top research topics as defined by author keywords. Links represent publications that were co-cited in at least five publications
Table 1.
Anthropogenic and natural resources factors affecting mangrove loss in the world
| References | Region | Anthropogenic factors | Natural factors | Amount of mangrove loss | Amount of mangrove increase | Key funding |
|---|---|---|---|---|---|---|
| 1 | 2 | 3 | 4 | 5 | 6 | 7 |
| Ofori et al., 2023 | Pambala-Chilaw lagoon complex and Ihala Mahawewa, Sri Lanka | Shrimp farming | – | 45% from 1973 to 2020 | – | Mangroves around the Chilaw Lagoon had decreased by 45% from 1973 to 2020 of which 92% of this change was attributed to shrimp farming. There was, however, a decrease in the shrimp farms from 2001 to 2020, and a corresponding increase in mangroves from 2006 to 2020. The ecological footprint of shrimp farming was high. |
| Jayanthi et al., 2018 | West Bengal, Pichavaram and Muthupet mangrove forests of Tamil Nadu, the Krishna and Godavari delta of Andhra Pradesh, the Gulf of Kutch and Gulf of Khambhat mangrove forests of Gujarat, and the Mahanadi delta, Devi mouth, Bhitarkanika mangrove forests of Odisha, India | Aquaculture, agriculture, and salt pan | Hypersaline condition, lack of fresh water supply, changes in rainfall, sediment supply, topography, and sea level | 517 km2 | 918 km2 | Mangrove extent has increased from 3006 km2 to 3406 km2 from 1989 to 2013. Natural factors such as hyper saline condition, lack of fresh water supply, changes in rainfall, sediment supply, topography, and sea level rise played major role than anthropogenic activities such as aquaculture, agriculture and salt pan for the overall mangrove change. |
| Santos et al., 2018 | southern part of the Saő Francisco River, Brazil | Shrimp farming | – | – | – | Lower crab density, probably due to high crab mortality, mangrove deforestation for shrimp farming, and high fishery pressure. |
| Qin et al., 2023 | Shrimp farming | – | – | – | PH, OM, C: P, and SiO32- were the four important environmental factors explaining the A. corniculatum propagule variation. | |
| Chen et al., 2013 | Honduran mangrove forests, Guatemala | Shrimp farming | – | 11.9% (5800 ha) | – | From 1985 to 2013, approximately 11.9% of the mangrove forests were lost for other uses, especially shrimp farming. |
| Bhomia et al., 2016 | Pacific and Caribbean coasts and the three Bay Islands of Honduras, Guatemala | Shrimp farming | Climate change | 36,000 ha | – | The existing 36,000 ha of mangroves in the Pacific coast of Honduras are currently threatened by conversion into shrimp aquaculture. any loss of mangrove forests, either by land use change or effects due to global climate change, will result in increased emissions of greenhouse gases to the atmosphere. |
| Gunawardena and Rowan, 2005 | Rekawa mangrove, Sri Lanka | Shrimp aquaculture | – | – | – | Low intensity, but sustainable, harvesting has far greater long-term value to local stakeholders and the wider community than large shrimp aquaculture developments. |
| Rafique, 2018 | Pakistan | Pollution, urbanization, extraction of timber and fuel wood | Shortage of freshwater flow and silt flow into the sea and, global warming | – | – | Main causes of the decline of the mangrove forests in Pakistan are the reduced freshwater and silt flow into the sea, pollution, fast pace of urbanization and development, global warming, climate change, complex tenure system, and overgrazing and extraction of timber and fuel wood. |
| Nguyen et al., 2013 | Kien Giang Province, Vietnam | Shrimp farm expansion and urban development | – | 1992–2003 (76.4 ha), 2003–2006 (143.8 ha) | 1989–1992 (264.4 ha) | The total loss of fringe mangrove extent was significantly correlated with the increase in extent of other land covers, especially shrimp farms and bare and wet ground, during the period of 2003–2009. |
| Kauffman et al., 2014 | Montecristi Province in Northwest Dominican Republic | Conversion of mangroves to shrimp ponds | – | – | – | The potential emissions from the conversion of mangroves to shrimp ponds ranged from 2244 to 3799 Mg CO2e/ha (CO2 equivalents). the replacement of mangroves with shrimp and salt ponds has resulted in estimated emissions from this region totaling 3.8 million Mg CO2e or 21% of the total C prior to conversion. |
| Medeiros et al., 2023 | Paraíba in northeastern Brazil | Urban expansion, sugarcane monoculture, and shrimp farming | – | 5–10% from 1990 to 2016 | – | The mangrove forests analyzed have continually suffered anthropogenic pressures since their creation as protected areas. |
| Tallis et al., 2008 | Andhra Pradesh, India | Shrimp aquaculture | – | – | – | The clearing of mangroves for shrimp farms can have negative impacts on the environment and the industry itself. |
| McSherry et al., 2023 | World | Shrimp aquaculture | – | – | – | Given the rapid adoption of integrated mangrove aquc-ulture (IMA) approaches, including advocacy for uptake from many governments and non-governmental organizations, there is an urgent need to ensure that these and other aquaculture systems do not result in any conversion of intact mangrove ecosystems into aquaculture ponds. |
| Barbier, 2006 | Thailand | Shrimp aquaculture | – | – | – | Evidence from Thailand suggests that concern over mangrove deforestation by shrimp farms is an important motivation for many coastal households to participate in mangrove rehabilitation. |
| Estoque et al., 2018 | Myanmar | Paddy field expansion, fuelwood extraction, charcoal production, and fish and shrimp farming activities | – | 191,122 ha from 2000 to 2014 | – | Myanmar had a net mangrove loss of 191,122 ha from 2000 to 2014. while rice field expansion has been identified as the key driver of mangrove deforestation in the country, aquaculture farming activities are expected to intensify in the near future due to political and economic pressure. |
| Santos et al., 2014 | São Francisco River Estuary, Brazil Northeast | Shrimp aquaculture and agriculture expansion (rice and coconut plantations) | – | 25% | – | Aquaculture and agriculture make up for roughly 25% of the mangrove study area. Shrimp farming is the main anthropogenic activity, occupying the highest area and occurring within the tallest Rhizophora mangle forests (tree height >15 m). |
| Loiola et al., 2023 | Guatemala | Shrimp farming | – | – | – | Microbial diversity and ecosystem services losses in mangrove soil are related with shrimp farming activity. Shrimp farming ponds microbiomes have lower microbial diversity in comparison with control mangrove forests. |
| Islam and Wahab, 2005 | Bangladesh | Shrimp farming | – | 5446 ha of Chakaria Sundarbans’ | - | Shrimp farming is the most destructive form of resource use the mangrove has been converted to, which contributed significantly to mangrove destruction with a corresponding loss of biological resources. |
| Bèland et al., 2006 | Vietnam | Shrimp farming | – | 63% in 2001, 440 ha between 1986 and 1992 | 441 ha between 1992 and 2001 | 63% of mangrove areas apparent in 1986 had been replaced by shrimp ponds in 2001. Between 1986 and 1992, 440 ha of adult mangrove trees had disappeared. whereas the mangrove extent due to reforestation projects and conservation efforts increased by 441 ha between 1992 and 2001. |
| Camacho-Valdez et al., 2014 | The southern coast of Sinaloa, northwest Mexico | Agriculture and shrimp farming | – | 14% reduced between 2000 and 2010 | – | 14% decrease in the saltmarsh/forested mangrove area and a 12% increase in the area of shrimp pond aquaculture between 2000 and 2010. |
| Ahmed and Thompson, 2019 | Global | Shrimp farming | – | 1.89 million ha due to shrimp farming | – | Blue carbon emissions occur from mangrove deforestation due to shrimp cultivation. To increase fish production for a growing global population, aquaculture must grow sustainably while at the same time, its environmental impacts must reduce significantly. |
| Arifanti et al., 2019 | Mahakam Delta, Indonesia | Shrimp farming | – | 62% | – | About 62% of this extensive mangrove in the Mahakam Delta has been lost mainly due to conversion into aquaculture. Conversion of mangroves to shrimp ponds in the Mahakam Delta resulted in a carbon loss equivalent to 226 years of natural soil carbon accumulation in mangroves. |
| Azad et al., 2009 | Bangladesh | Shrimp farming | – | 9734 ha | – | Approximately 9734 ha of mangrove loss in the southeastern part of Bangladesh have been directly attributed to shrimp culture. |
| Giri et al., 2015 | South Asia | Conversion to agriculture, shrimp farms, development, and human settlement over-harvesting (e.g. grazing, browsing and lopping, and fishing), pollution, coastal erosion | Decline in freshwater availability, floodings and, reduction of silt deposition | 92,135 ha from 2000 to 2012 | 80,461 ha | Results showed that in South Asia from 2000 to 2012, 92,135 ha of mangroves were deforested and 80,461 ha were reforested with a net loss of 11,673 ha. |
| Pham et al., 2018 | Cat Ba biosphere reserve, Vietnam | Shrimp aquaculture | – | – | – | The results revealed that gender, education level, occupation, the participation of respondents in mangrove restoration activities, and their attitudes toward the impact of climate change were significant factors in their willingness to pay for mangrove restoration. |
| Hamilton and Lovette, 2015 | Ecuador | Shrimp aquaculture | – | – | – | Results showed that 80 percent, of the living carbon lost in Ecuadorian mangrove forests, can be attributed to the direct displacement of mangrove forests by shrimp aquaculture. |
| Reis-Neto et al., 2019 | Ceará state, northeastern Brazil | Shrimp aquaculture | – | - | 165% increased between 1968 and 2009 | Mangrove forest increased by 165%, from 380.0 ha to 1006.6 ha. |
| Ha et al., 2012 | Vietnam | Shrimp farming | – | 66,253 ha between 1980 and 1995 | – | Shrimp farmer attitude towards mangrove plantations and protection are positive. Farmer decisions are directly influenced by benefit sharing policy implementation. |
| Li et al., 2013 | Zhanjiang mangrove forests in southern China | Shrimp farming | – | – | – | Mangrove spatial extent decreased sharply during the period from 1977 to 1991 due to deforestation caused by diverse development programs, particularly shrimp farming. Afterward, there was a continuous increase in mangrove extent from 1991 to 2010 due to afforestation and conservation efforts. |
| Farley et al., 2010 | Palawan Island, Philippines | Shrimp farming | – | 100,000 ha in 1918 | – | Results showed that the economic and ecological benefits of intact mangroves outweigh the returns to aquaculture. |
| Aslan et al., 2021 | Mahakam Delta, Indonesia | Shrimp farming | – | 62% | – | During 22+ years, over half of the mangrove forest in Mahakam Delta has been converted to aquaculture. |
| Hein, 2002 | India | Shrimp farming, grazing and firewood and timber collection | – | 80% by pond construction | – | The environmental and social management of Indian shrimp farming can be improved through a mix of policy measures, including strengthening of the license system, more effective enforcement of regulations, the use of economic incentives, and increased monitoring of environmental and social impacts. |
| Järviö et al., 2018 | Vietnam | Shrimp farming | – | – | – | Mangrove deforestation resulted in 124 t CO2 ha−1 year−1, assuming International Panel for Climate Change (IPCC’s) recommendations of 1 m of soil loss, and 96% carbon oxidation. |
| Gallup et al., 2020 | Sine-Saloum Delta, Senegal | Fuelwood and charcoal, fish, clam, oyster, and shrimp collection, pollution, climate change, overgrazing by livestock | – | One-third of the mangrove cover in the Sine Saloum Delta was lost between 1972 and 1986 | – | Dead wood for use as fuel wood is the most important use of mangroves within the Sine-Saloum Delta, Senegal. Fish, clam, oyster, and shrimp collection is the second most important use of mangroves in the region. Community involvement in mangrove reforestation is significant throughout the region. |
| Hidayat, 2017 | Tanah Laut Regency, South Kalimantan Province, Indonesia | Shrimp farming | – | – | – | Pond culture development in the study site could be done through revitalization and conservation of protected area and mangrove, and access limitation to the coastal area. |
| Hai et al., 2022 | Mekong delta, Vietnam | Shrimp farms, settlements areas and public constructions | – | 920 ha loss in 1995, 1900 ha loss in 2015 | 4121 ha to 6640 ha between 1995 and 2004 | Result showed that mangrove areas increased double by 2015, but the forest had become more fragmented. We can be seen those changes in land use mainly come from land conversion from forest to shrimp farms, settlements areas and public constructions. |
| Morocho et al., 2022 | Ecuador | Shrimp farming, agriculture and construction | – | 4.56% loss (194.57 km2) between 1998 and 2010 | – | Results showed that the area affected by mangrove forest destruction reached its maximum during the 1998–2010 period, when 4.56% (194.57 km2) of the mangrove forest was lost. The main cause for the loss of mangrove cover was the expansion of shrimp farms, followed by agriculture and construction. |
| Kusumaningtyas et al., 2022 | Banten Province, Indonesia | – | – | 600,000 ha loss | – | The sediment CStock to a depth of 1 m in a rehabilitated mangrove (Ciseukeut) was higher than in a natural mangrove in Cilintang. However, the Carbon accumulation rate showed the opposite pattern, in which a natural mangrove showed an almost two-fold higher rate than that of a rehabilitated mangrove. |
| Páez-Osuna, 2001 | World | Shrimp farming | – | 1–1.5 million ha of coastal lowlands have been converted into shrimp ponds | – | The presence of buffer zones, maintaining an acceptable balance between mangroves and shrimp pond area, improved pond design, reduction of water exchange, and an improved residence time of water, size and capacity to assimilate effluents of the water body, are examples of ways to mitigate the adverse effects of Shrimp Aquaculture on coastal lowland. |
| McNally et al., 2011 | Saadani National Park, Tanzania | Fuelwood, harvesting the shrimp and fish | – | 27% loss between 1995 and 2005 | – | On average, a 10% increase in the mangrove cover within SANAPA boundaries in a 5-km2 radius of the sub-village increases shrimping income by approximately twofold. |
| Rahman et al., 2010 | Bangladesh | Shrimp farming industry | Natural disasters, climate change and sea level rise | – | – | The rapidly expanding shrimp farming industry is a significant threat to the mangrove forests of Bangladesh. |
| de Lacerda et al., 2021 | Northeast Brazil | Shrimp farming, pollution, climate change | – | – | – | The main impacts on mangroves in northeast Brazil are typically indirect, because of pollution inputs from shrimp pond effluents and associated loss of ecosystem services including reductions in primary productivity, carbon storage capacity, resilience to other environmental stressors, their efficiency as estuarine filters, and biodiversity and abundance of subsistence use of marine species. |
| Goldberg et al., 2020 | Global | Rice, shrimp, and oil palm cultivation, human settlements | Shoreline erosion and extreme weather events | 62% loss between 2000 and 2016 | – | 62% of global losses between 2000 and 2016 resulted from land-use change, primarily through conversion to aquaculture and agriculture. Up to 80% of these human-driven losses occurred within six Southeast Asian nations, reflecting the regional emphasis on enhancing aquaculture for export to support economic development. |
| Thomas et al., 2017 | Global | Conversion of mangroves to aquaculture/agriculture | Erosion and deposition | 50% loss between 1996 and 2010 | Prior to 1996 38% increase | The greatest proportion of loss was observed in Southeast Asia, whereby approximately 50% of the tiles in the region contained evidence of mangrove loss, corresponding to 18.4% of the global mangrove forest tiles. Southeast Asia contained the greatest proportion (33.8%) of global mangrove forest. |
| Sippo et al., 2018 | Global | – | Extreme climatic events | 70% loss by extreme climatic events | – | Approximately 70% of reported mangrove loss from natural causes has occurred as a result of low frequency, high intensity weather events, such as tropical cyclones and climatic extremes. |
| Carrasquilla-Henao et al., 2013 | San Ignacio-Navachiste-Macapule lagoon system, California, Mexico | Shrimp farming | – | – | – | Mangrove coverage did not change significantly between 1994 and 2009, ranging from 11,886 to 11,929 ha. |
| Treviño and Murillo-Sandoval, 2021 | Ecuador | Shrimp farming, gathering mangrove cockles | – | – | – | The introduction of industrial shrimp farming increased the community’s reliance on mangrove resources. The overuse of these resources is leading to a depletion of mangrove cockle populations, putting the community in a vulnerable position as both men and women are increasingly dependent on this fishery to subsist. |
| Basyuni et al., 2018 | Sumatra, Indonesia | Aquaculture expansion | – | – | – | This study confirmed that mangrove forest and fishery is compatible by developing silvofishery. |
| Monsalve and Quiroga, 2022 | Global | Shrimp farming | – | – | – | The main impacts included the loss of mangroves and their transformation of these ecosystems and their water bodies by receiving enriched effluents from shrimp farms. Ecuador with proportionally less territory than Mexico and Brazil produce more than 50% of the shrimp farmed in the western hemisphere. |
| Dierberg and Kiattisimkul, 1996 | Thailand | Shrimp aquaculture | – | 16 and 32% between 1979 and 1993 | – | To move Thailand towards a more sustainable aquaculture industry and coastal zone environment, integrated aquaculture management is needed. |
| Baumgartner et al., 2016 | Vietnam | Aquaculture production | – | 111,650 ha from 1980 to 2000 | – | Regulations in the form of universal mangrove-to-water ratios do not consider the realities of local households, nor are they economically or environmentally useful – rather, they appear to be arbitrary limitations that are not respected by affected communities. |
| Li et al., 2013 | Guangdong province, China | Shrimp aquaculture | – | 76 ha | 316 ha | Results revealed that the mangrove spatial extent decreased sharply during the period from 1977 to 1991 (76 ha) due to deforestation caused by diverse development programs, particularly shrimp farming. Afterwards, there was a continuous increase in mangrove extent from 1991 to 2010 (316 ha) due to afforestation and conservation efforts. |
| Didar-Ul Islam and Bhuiyan, 2016 | Bangladesh | Shrimp aquaculture | – | 9734 ha | – | The findings of the study show that the continuous and unregulated shrimp farming has immense impacts on human, ecology, environment and sustainability through saline water intrusion, soil and water quality deterioration, mangrove destruction, pollution, sedimentation, disease outbreaks, loss of biodiversity and destruction of local ecosystem. |
| Ahmed and Glaser, 2016 | Global | Shrimp aquaculture | Coastal flooding, cyclones, drought, rainfall, salinity, sea-level rise, and sea surface temperature | Mangrove area lost to shrimp culture: 1.4 million ha | – | Globally, coastal aquaculture including shrimp farming has devastating effects on mangrove forests. At the same time, mangroves are the most carbon-rich forests in the tropics, and thus, ecologically and economically significant at the planetary level. The loss of mangroves through coastal aquaculture causes carbon emission and reduces carbon sequestration. |
| Barbier and Cox, 2002 | Thailand | Shrimp farm density, population growth | – | – | – | Price of shrimp, minimum wage, distance from market, feed price, population growth, income per capita, and shrimp-farm density all have important influences on mangrove loss due to shrimp farming in Thailand. |
| Tenório et al., 2015 | Brazilian Amazon coast | Shrimp farming | – | Saltwater aquaculture contributed to the conversion of 0.53 km2 of the mangroves into rearing ponds | – | The considerable value of the ecosystem services provided by the mangroves indicates that the production of shrimp in the coastal plateau is relatively less damaging in ecological and economic terms. Thus, we can consider that the production of shrimp in the coastal plateau instead of in mangrove areas is less damaging to the long-term conservation of mangrove forests, which follows the management best practices established by international organizations. |
| Taher et al., 2023 | Bangladesh | Shrimp farming | – | – | – | The Sundarbans is threatened by shrimp aquaculture and resource overharvesting. |
| Veettil and Quang, 2019 | Cambodia | Salt farming, charcoal production and shrimp farming | – | 42% between 1982 and 2017 (1415 ha/year) | – | More than 40% of mangrove forests were cleared between 1989 and 2017 in Cambodia. Reforestation practices and proper law enforcement influencing the conservation of mangrove forests in Cambodia. Three main causes of mangrove forest destruction in Cambodia includes: salt farming, charcoal production and shrimp farming. |
| Smith et al., 2009 | Florida, USA | – | Tropical cyclones | Extensive | – | Hurricane events are the main cause of mangrove loss. |
| Wadsworth et al., 1959 | Puerto Rico | – | Hurricane Betsy | <5 ha in 1956 | – | Hurricane Betsy are the main cause of mangrove loss. |
| Craighead et al., 1962 | Florida, USA | – | Hurricane Donna | 4000 ha in 1960 | – | Hurricane Donna are the main cause of mangrove loss. |
| Craighead, 1964 | Florida, USA | – | Hurricane Donna | Extensive | – | Hurricane Donna are the main cause of mangrove loss. |
| Vermeer, 1963 | Belize | – | Hurricane Hattie | Extensive | – | Hurricane Hattie are the main cause of mangrove loss. |
| Heinsohn and Spain, 1974 | Australia | – | Cyclone Althea/ siltation | 5 ha in 1971 | – | Cyclone Althea is the main cause of mangrove loss. |
| Roth, 1992 | Nicaragua | – | Hurricane Joan | 5 ha in 1988 | – | Hurricane Joan is the main cause of mangrove loss. |
| Ogden, 1992 | Florida, USA | – | Hurricane Andrew | 150 ha in 1992 | – | Hurricane Andrew is the main cause of mangrove loss. |
| Sherman et al., 2001 | Dominican Republic | – | Hurricane Georges | 2240 ha in 1998 | – | Hurricane Georges is the main cause of mangrove loss. |
| Cahoon et al., 2003 | Honduras | – | Hurricane Mitch | 490 ha in 1998 | – | Hurricane Mitch is the main cause of mangrove loss. |
| Paling et al., 2008 | Australia | – | Cyclone Vance | 5700 ha in 1999 | – | The 5700 ha of mangrove habitat damaged by Cyclone Vance exceeds any anthropogenic impact that has ever taken place in Western Australia by several orders of magnitude. |
| Kauffman and Cole, 2010 | Micronesia | – | Cyclone (Typhoon) Sudal | <10 ha in 2004 | – | Climatic changes such as sea level rise and increased severity of cyclonic events are main cause of mangrove loss. |
| Salmo et al., 2014 | Philippines | – | Typhoon Chanhom | Extensive | – | Typhoon Chanhom is the main cause of mangrove loss. |
| Cintrón et al., 1978 | Puerto Rico | – | Hypersalinity | – | – | Hypersalinity is the main cause of mangrove loss. |
| Sherrod and McMillan, 1981 | Gulf of Mexico, USA | – | Freeze | Extensive | – | Freeze is the main cause of mangrove loss. |
| Stevens et al., 2006 | Florida, USA | – | Freeze | 15 ha in 1980 | – | Freeze is the main cause of mangrove loss. |
| Diop et al., 1997 | Senegal | – | Drought | Extensive | – | Drought is the main cause of mangrove loss. |
| Houston, 1999 | Australia | – | Hail storm | 0.1 ha | – | Hail storm is the main cause of mangrove loss. |
| Barreto, 2008 | Venezuela | – | ENSO related drought | 880 ha | – | Mangrove mortality has been related to progressive increase of salinity due to changes of hydrological and sedimentary patterns, probably caused by human activities, as well as the frequency of droughts linked to ENSO events. |
| Erftemeijer and Hamerlynck, 2005 | Tanzania | – | Flooding | 117 ha | – | Flooding is the main cause of mangrove loss. |
| Lucas et al., 2017 | Kakadu, Australia | – | ENSO related climatic extremes | Extensive (2015–2016) | – | In 2015–2016, significant dieback of mangroves was observed particularly within the lower-stature landward zones dominated by A. marina, causing considerable concern because this may not have occurred to the same extent in the recent past. |
| Lovelock et al., 2017 | Australia | – | ENSO related climatic extremes | 40 ha (2002–2016) | – | Results showed that an intensification of ENSO will have negative effects on some mangrove forests in parts of the Indo-Pacific that will exacerbate other pressures. |
| Duke et al., 2017 | Gulf of Carpentaria, Australia | – | ENSO related climatic extremes | 7400 ha (2015–2016) | – | The dieback was severe and widespread, affecting more than 7400 ha or 6% of mangrove vegetation in the affected area from Roper River estuary in the Northern Territory, east to Karumba in Queensland. At the time, there was an unusually lengthy period of severe drought conditions, unprecedented high temperatures and a temporary drop in sea level. |
| Servino et al., 2018 | Brazil | – | Hail storm | 500 ha in 2016 | – | Over 24% of mangroves were suddenly lost by a hailstorm in Eastern Brazil. Rhizophora mangle was the most impacted species by the hailstorm. |
| Sachtler, 1973 | Dominican Republic | – | Dominican Republic Tsunami | 4500 ha in 1946 | – | Dominican Republic Tsunami is the main cause of mangrove loss. |
| Kamthonkiat et al., 2011 | Thailand | – | Banda Aceh, Tsunami | 1050 ha in 2004 | – | The results showed that the mangrove area in 2005 was reduced by approximately 5% (1054.5 ha) from 2003 due to the impact of the 2004 Indian Ocean Tsunami. |
| Yanagisawa et al., 2010 | Thailand | – | Banda Aceh, Tsunami | 1 ha | – | The model reveals that a 10-year-old mangrove forest in a 500 m wide area can reduce a tsunami’s hydrodynamic force by approximately 70% for an incident wave of 3.0 m inundation depth and a wave period of 40 min at the shoreline. |
| Roy, 2016 | Andaman Islands | – | Banda Aceh, Tsunami | – | – | 30–80% of mangrove stands got affected by the tsunami-wave. |