
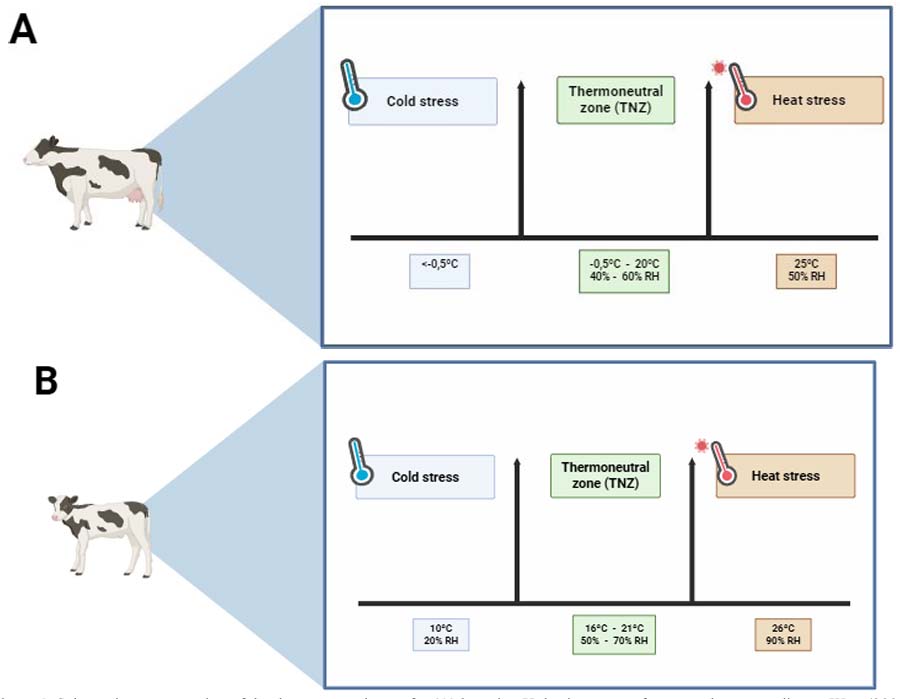
Figure 1.
Schematic representation of the thermoneutral zone for (A) lactating Holstein cows, reference values according to West (2003); and (B) Holstein dairy calves, reference values according to Castro et al., (2024). *RH = relative humidity
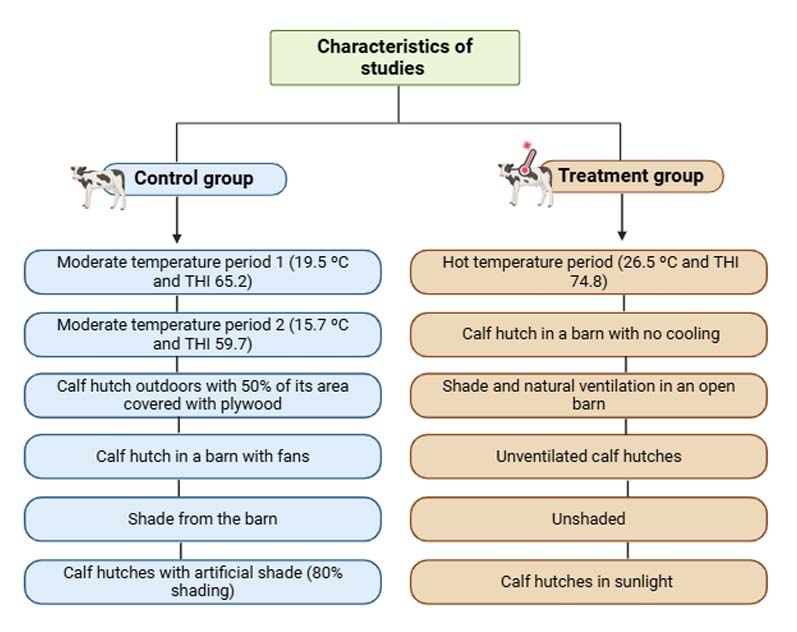
Figure 2.
Flowchart of the studies included in our systematic review: comparative characteristics between the control group and the treatment group. *THI = temperature-humidity index
Table 1.
Reference number of the 16 studies (author and year) included in the systematic review
| Reference number | Study (author and year) | Reference number | Study (author and year) |
|---|---|---|---|
| 1 | (Broucek et al., 2008) | 9 | (Montevecchio et al., 2023) |
| 2 | (Montevecchio et al., 2022 b) | 10 | (Marrero et al., 2021) |
| 3 | (Montevecchio et al., 2022 a) | 11 | (Kovács et al., 2018 c) |
| 4 | (Dado-Senn et al., 2022) | 12 | (Kovács et al., 2018 b) |
| 5 | (Reuscher et al., 2023) | 13 | (Kovács et al., 2018 a) |
| 6 | (Bakony et al., 2023) | 14 | (Kovács et al., 2019) |
| 7 | (Dado-Senn et al., 2020 a) | 15 | (Broucek et al., 2009) |
| 8 | (Dado-Senn et al., 2020 b) | 16 | (Spain and Spiers, 1996) |
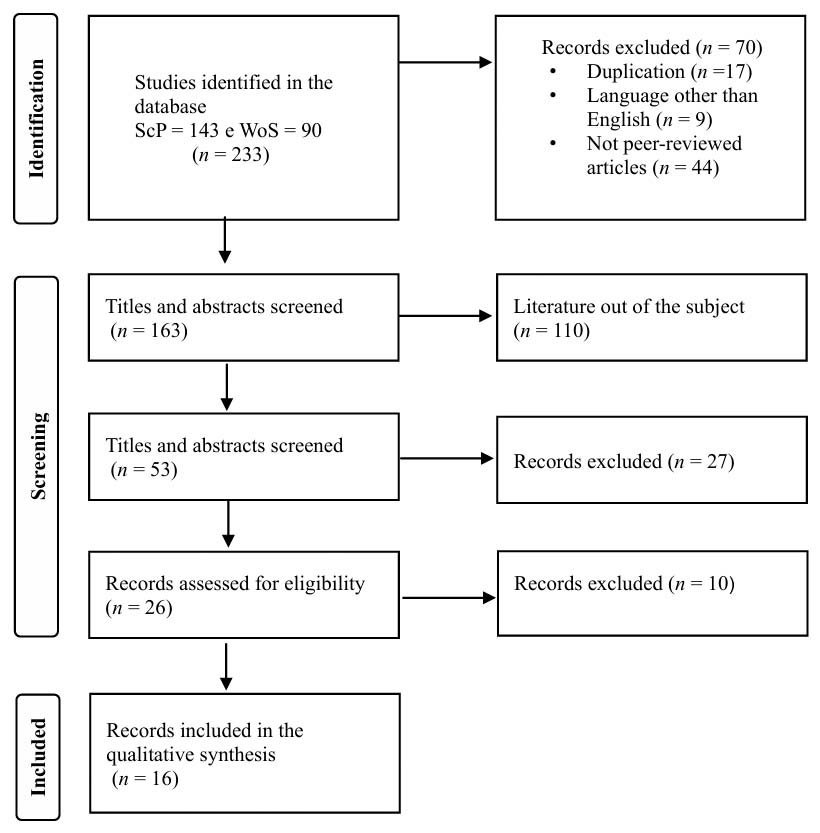
Figure 3.
Preferred Reporting Items for Systematic Reviews and Meta-Analyses (PRISMA; Page et al., 2021), flowchart describing the number of records identified and the exclusion process for the systematic review
Table 2.
Summary of the effect of heat stress conditions on microclimatic variables and thermal comfort indicators found in the studies (n = 16) included in the systematic review. The reference conditions for all variables were the thermal comfort (TC) compared to the heat stress (HS) condition. Predominant direction (PD) of results, and consistence of evidence for each variable evaluated
| Variable | Literature review | PD | Consistent evidence | ||||||
|---|---|---|---|---|---|---|---|---|---|
| n | Reference number1 | n+ | n0 | n- | n+ | n0 | n- | ||
| Microclimate variables | |||||||||
| air temperature | 13 | 1,3,5,6,7,8,9,10,11,12,13,15,16 | 0 | 4 | 9 | –1 | † | ††† | |
| relative humidity | 7 | 3,7,8,9,10,12,13 | 0 | 7 | 0 | –0.7 | ††† | ||
| wind speed | 5 | 3,4,7,8,9 | 5 | 0 | 0 | 5 | ††† | ||
| Thermal comfort indicator | |||||||||
| temperature-humidity index | 13 | 1,3,4,5,7,8,9,10,11,12,13,14,15 | 0 | 6 | 7 | –1 | †† | †† | |
1 Number of the articles defined in Table 1; n, number of studies that evaluated the variable; n+, number of studies that found higher values in TC than HS; n0, number of articles that found no difference in the variable between the conditions (TC and HS); n-, number of studies that found lower values in TC than HS; for consistent evidence, consider slight [†], moderate [††], and strong [†††].
Table 3.
Summary of the effect of heat stress conditions on behavior variables found in the studies (n = 16) included in the systematic review. The reference conditions for all variables were the thermal comfort (TC) condition compared to the heat stress (HS) condition. Predominant direction (PD) of results, and consistent evidence for each variable evaluated
| Variable | Literature review | PD | Consistent evidence | ||||||
|---|---|---|---|---|---|---|---|---|---|
| n | Reference number1 | n+ | n0 | n– | n+ | n0 | n– | ||
| Milk intake (kg/d) | 5 | 3,4,7,8,9 | 3 | 2 | 0 | 2.6 | ††† | †† | |
| Concentrate intake (kg/d) | 5 | 1,3,7,8,9 | 3 | 2 | 0 | 2.6 | ††† | †† | |
| Water intake (L/d) | 2 | 1,15 | 0 | 0 | 2 | −1 | – | – | – |
1 Number of the articles defined in Table 1; n, number of studies that evaluated the variable; n+, number of studies that found higher values in TC than HS; n0, number of articles that found no difference in the variable between the conditions (TC and HS); n-, number of studies that found lower values in TC than HS; for consistent evidence, consider slight [†], moderate [††], and strong [†††].
Table 4.
Summary of the effect of heat stress conditions on thermoregulation physiology found in the studies (n = 16) included in the systematic review. The reference conditions for all variables were the thermal comfort (TC) condition compared to the heat stress (HS) condition. Predominant direction (PD) of results, and consistent evidence for each variable evaluated
| Variable | Literature review | PD | Consistent evidence | ||||||
|---|---|---|---|---|---|---|---|---|---|
| n | Reference number1 | n+ | n0 | n– | n+ | n0 | n– | ||
| Rectal temperature | 10 | 2,4,6,7,8,9,10,12,13,16 | 0 | 4 | 6 | –1 | †† | ††† | |
| Body temperature | 3 | 7,8,16 | 0 | 0 | 3 | –1 | ††† | ||
| Respiratory rate | 8 | 3,4,7,8,10,12,13,16 | 0 | 1 | 7 | –1 | † | ††† | |
| Heart rate | 4 | 8,9,12,13 | 0 | 2 | 2 | –1 | ††† | ††† | |
1 Number of the articles defined in Table 1; n, number of studies that evaluated the variable; n+, number of studies that found higher values in TC than HS; n0, number of articles that found no difference in the variable between the conditions (TC and HS); n-, number of studies that found lower values in TC than HS; for consistent evidence, consider slight [†], moderate [††], and strong [†††].