
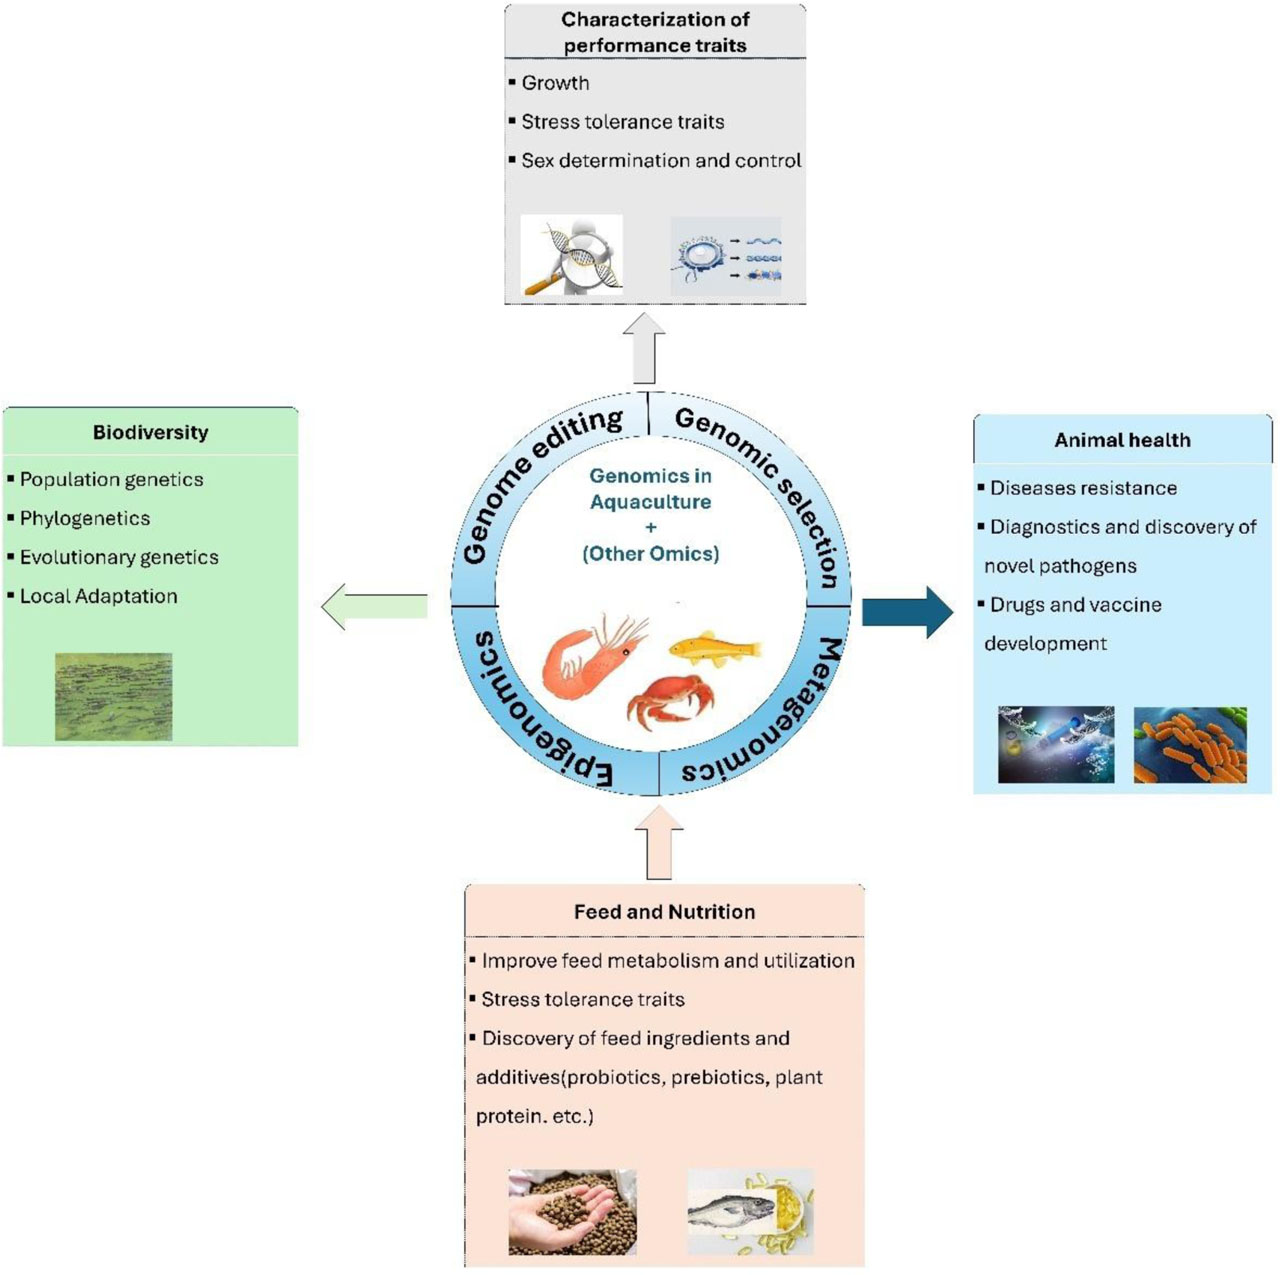
Figure 1.
An overview of applications of genomics technology in aquaculture
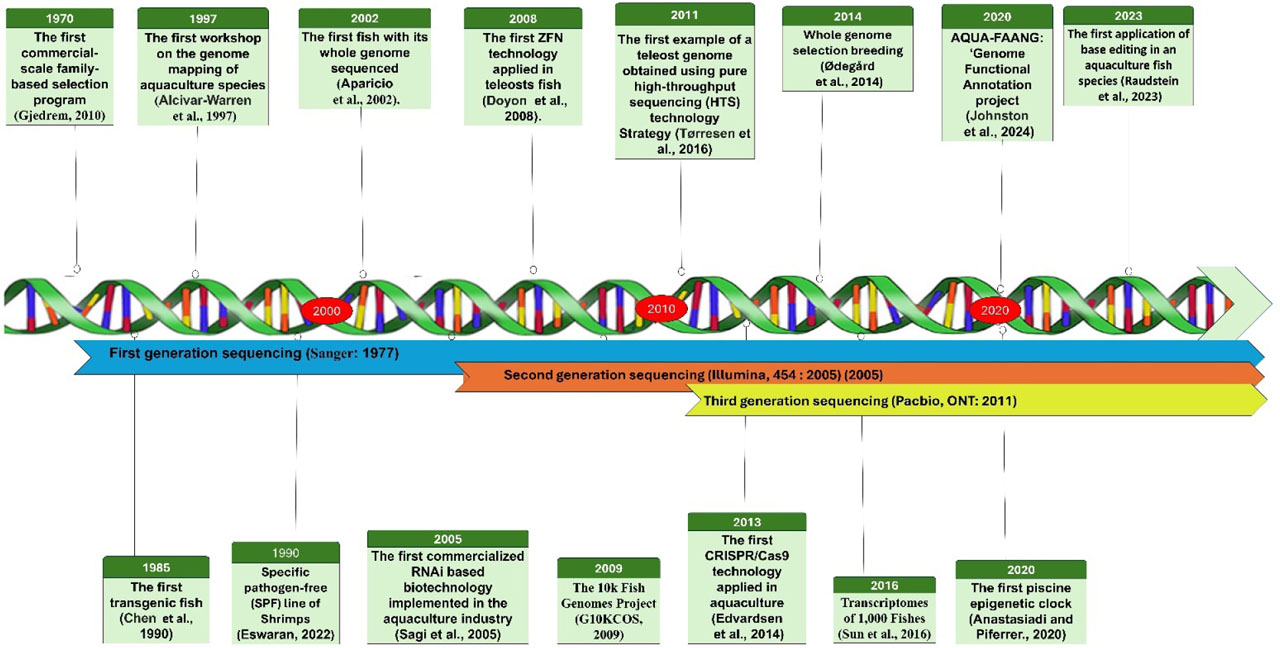
Figure 2.
Major events in aquaculture genetics, genomics, and breeding
Table 1.
Genome assembly and gene annotation of major aquaculture species
| Species name | Assembled size (Mb) | Genome size (Mb) | Number of genes | N50 scaffold | Reference |
|---|---|---|---|---|---|
| Chinese tapertail anchovy | 870.0 | 870 | 20,837 | 2.1 | (Xu et al., 2020 b) |
| Labeo catla | 1010 | 1.01 Gb | 25,812 | 0.7 Mb | (Sahoo et al., 2020) |
| Yellow catfish | 732.8 | – | 24,522 | 1.1 Mb | (Gong et al., 2018) |
| Large yellow croaker | 189.3 | 723.86 | 23,657 | 2.83 | (Chen et al., 2019 a) |
| N/A | 669.78 | 26,100 | 6.55 Mb | (Mu et al., 2018) | |
| Snout otter clam | 544 | 26,380 | 2.14 Mb | (Thai et al., 2019) | |
| Pacific oyster | 283 | 587 | 26,811 | 581 kb | (Wang et al., 2019 b) |
| Chinese shrimp | 147 | 1,384.88 | 25,026 | 36.87 | (Wang et al., 2022 c) |
| Australian black tiger | 31,922 | 1.89 | 35,517 | 496,398 | (Huerlimann et al., 2022) |
| Kuruma shrimp | 15,969 | 1,700 | 26,381 | 234.9 kbp | (Kawato et al., 2021) |
| Oriental river prawn | 4,500 | 2,933 | 44,086 | 86.8 Mb | (Jin et al., 2021) |
| Giant grouper | 1.128 Gb | 999.69 | 24,794 | 76,419 | (Wang et al., 2019 a) |
| Potato grouper | – | 1.13 Gb | 435 | 42.65 Mb | (Wang et al., 2022 a) |
| Red-spotted grouper | 1.135 Gb | 106.29 Gb | 23,923 | 46.03 Mb | (Ge et al., 2019) |
| Yellow perch | 877.4 | – | – | 37.4 | (Feron et al., 2020) |
| Hard-shell mussel | 1.57 Gb | – | 37,478 | 1.49 Mb | (Yang et al., 2021) |
| Rohu carp | 1480 | 1.5 Gb | 26,400 | 1.95 | (Das et al., 2020) |
| Indian catfish | 941 | 1.02 G | 23,748 | 1.3 | (Kushwaha et al., 2021) |
| Spiny red gurnard | 624.7 Mb | 637.64 Mb | 25,358 | 28.11 Mb | (Wang et al., 2023 e) |
| Channel catfish | – | 1.01 Gb | 950 | 26.7 Mb | (Bao et al., 2019) |
| Striped catfish | 788.4 Mb | 713.9 Mb | 21.8 Mb | (Hai et al., 2022) | |
| Tilapia | 1,007 Mb | 28,902 | 11.38 Mb | (Tao et al., 2021) | |
| Yellow perch | 877.4 Mb | 16,579 | 37.4 Mb | (Feron et al., 2020) | |
| Swamp eel | 799 Mb | 22,373 | 67.24 Mb | (Tian et al., 2021) | |
| Humpback grouper | 1.08 Gb | 24,442 | 43.78 Mb | (Liu et al., 2024) | |
| Acrossocheilus fasciatus | 879.52 Mb | 24,900 | 32.7 Mb | (Zheng et al., 2024 a) | |
| Topmouth culter | 1.052 Gb | 28,228 | 43.09 Mb | (Zhao et al., 2024) | |
| Black tiger shrimp | 2.39 Gb | 30,038 | (Uengwetwanit et al., 2021) | ||
| Kuruma shrimp | 665.19 Gb | 1.54 Gb | 24,317 | 38.27 Mb. | (Ren et al., 2022) |
| Ridgetail white shrimp | 5.86 Gb | 44, 288 | 138.24 Mb | (Wang et al., 2024 a) | |
| Giant river prawn | 3.18 Gb | 17,436 | 62.73 Mb | (Zheng et al., 2024 b) | |
| Pacific white shrimp | 1.87 Gb | 24,861 | 39.7 Mb | (Peng et al., 2023) | |
| Swimming crab | 125.99 Gb | 1.47 Gb | 25,026 | 36.87 Mb | (Tang et al., 2020) |
| Chum salmon | 2.6 Gb | 40,661 | 2 Mbp | (Rondeau et al., 2023) |
Table 2.
Aquaculture species for which commercial high-density SNP chips have been recently developed
| Species | SNP array platform | Density | Aim | Reference |
|---|---|---|---|---|
| 1 | 2 | 3 | 4 | 5 |
| Atlantic salmon | Affymetrix Axiom | Comparing genomic signatures of domestication in two populations | (López et al., 2019) | |
| Affymetrix Axiom | 17 K | GWAS and GS for amoebic gill disease (AGD) resistance | (Robledo et al., 2018 a) | |
| Affymetrix Axiom | 50 K | Reveal genetic relationship and chromosomal fusions to contribute to local adaptation | (Wellband et al., 2019) | |
| GWAS for age at maturity | (Sinclair-Waters et al., 2020) | |||
| Channel catfish | GWAS to identify intra-specific QTL associated with resistance to enteric septicemia disease | (Shi et al., 2018) | ||
| Nile tilapia | 50 K | Linkage maps to improve selection accuracy of sex determination | (Joshi et al., 2018) | |
| 58 K | Determination of the genetic basis of complex traits and genomic selection in this species | (Yáñez et al., 2020) | ||
| 17 K | Whole-genome pooled sequencing (Poolseq) approach | Population structure analysis and relationship resolution within Nile tilapia populations | (Barría et al., 2023) | |
| Rainbow trout | Affymetrix Axiom | 665 K | Genome-wide genotyping | (Bernard et al., 2022) |
| Compare the accuracy of GEBVs of P-BLUP to ssGBLUP for infectious pancreatic necrosis virus disease resistance | (Yoshida et al., 2019) | |||
| Affymetrix Axiom | 32 K / 35 K | LD analysis / GS for BCWD resistance | (Vallejo et al., 2018) | |
| 50 K | GWAS to identify QTL associated with muscle yield | (Salem et al., 2018) | ||
| Affymetrix Axiom | 23 K | GS for growth trait | (Gutierrez et al., 2018) | |
| – | 50 K | To investigate phenotype–genotype associations and determine the genomic basis of economically important traits | (Yáñez et al., 2023) | |
| – | 1.3 M | Identification of selective breeding signatures | (Cádiz et al., 2020), | |
| Pacific abalone | – | 56 K | QTL mapping and detection of candidate genes of growth-related traits | (Kho et al., 2021) |
| Affymetrix Axiom | 40 K | Development and validation of multiple SNP array for Pacific abalone | (Liu et al., 2022 a) | |
| Sea bass | ThermoFisher Axiom | 57 K | GWAS for resistance to viral nervous necrosis | (Griot et al., 2021) |
| Large yellow croaker | 55 K | Development of first liquid SNP array | (Wang et al., 2023 a) | |
| 600 K | Development of first high-throughput genotyping SNP array | (Zhou et al., 2020) | ||
| 55 K | Development and evaluation of a SNP array for genomic selection | (Zhou et al., 2022) | ||
| Eastern oyster | Affymetrix Axiom | 200 K | Development and evaluation of high density SNP array | (Xuereb et al., 2023) |
| Affymetrix Axiom | 566 K | Development and evaluation of high density SNP array | (Guo et al., 2023) | |
| Chinese tongue | Affymetrix Axiom | 38 K | Genomic selection for resistance to Vibrio harveyi resistance | (Lu et al., 2021) |
| Arctic charr | Affymetrix Axiom | 86 K | Genome-wide variation studies | (Nugent et al., 2019) |
| Sea cucumber | Affymetrix Axiom | 24 K | Genomic selection with MCP regularized deep neural networks | (Lv et al., 2022) |
| Japanese flounder | Affymetrix Axiom | 50 K | Genotyping and selective breeding programs for economically important traits | (Zhou et al., 2021) |
| Mud crab | Affymetrix Axiom | 40 K | GWAS for growth trait | (Ye et al., 2024) |
Table 3.
Successful applications of genome editing in aquaculture species
| Species | Target gene | Method | Trait of interest | Notable features | Reference |
|---|---|---|---|---|---|
| Atlantic salmon | elov-2 | CRISPR/Cas9 | Omega-3 metabolism | (Datsomor et al., 2019) | |
| slc45a2, tyr | CRISPR/Cas9 | Pigmentation | (Straume et al., 2020) | ||
| dnd (slc45a2) | CRISPR/Cas9 | Reproduction and development | (Güralp et al., 2020) | ||
| Tilapia | rln3a, rln3b | CRISPR/Cas9 | Reproduction and development | (Yang et al., 2020 b) | |
| igf3 | CRISPR/Cas9 | Reproduction and development | (Li et al., 2020) | ||
| esr1, esr2a, esr2b | CRISPR/Cas9 | Reproduction and development | (Yan et al., 2019) | ||
| Amh homozygous, amh2 homozygous, amh heterozygous, amhr2 heterozygous | CRISPR/Cas9 | Reproduction and development | (Liu et al., 2020 b) | ||
| Cyb11c1 | CRISPR/Cas9 | Reproduction and development | (Zheng et al., 2020) | ||
| Red sea bream | mstn | CRISPR/Cas9 | Feed intake | (Kishimoto et al., 2018) | |
| gonadotropin-releasing hormone gene | TALENs | Reproduction | Plasmids targeting | (Qin et al., 2022) | |
| Catfish | lh, mc4r, mstn1 and mstn2 | CRISPR/Cas9 | Growth | (Wang et al., 2024 c) | |
| Channel catfish | mc4r | CRISPR/Cas9 | Growth | Fatty acid synthesis | (Coogan, et al., 2022) |
| cathelicidin gene (As-Cath) | CRISPR/Cas9 | Disease resistance | Generation f eco-friendly disease-resistant transgenic catfish | (Wang et al., 2024 b) | |
| Striped catfish | dead end 1 (dnd1) | CRISPR/Cas9 | Sex control | Generation of sterile fish | (Booncherd et al., 2024) |
| Yellow catfish | mstna | Zinc finger nucleases | Growth | Increased mass and weight | (Zhang et al., 2020 b) |
| Common carp | MCIR | CRISPR/Cas9 | Pigmentation | (Mandal et al., 2020) | |
| ASIP | CRISPR/Cas9 | Pigmentation | (Chen et al., 2019 b) | ||
| cyp17a1 | CRISPR/Cas9 | Sex reversal | Production of a monosex of common carp | (Zhai et al., 2022) | |
| Grass carp | gcjam-a | CRISPR/Cas9 | Disease resistance | (Ma et al., 2018) | |
| Rainbow trout | igfbp-2b1/2b2 | CRISPR/Cas9 | Growth | (Cleveland et al., 2020) | |
| gata2b, tcnba | CRISPR/Cas9 | Sex control | (Carrington et al., 2022) | ||
| Pacific oyster | mstn | CRISPR/Cas9 | Growth | (Yu et al., 2019) | |
| CgMELC | CRISPR/Cas9 | Muscle growth | Larval muscle contraction and myogenesis | (Li et al., 2021) | |
| Oriental prawn | EcNinaB-X1 | CRISPR/Cas9 | Immune defense | Reduced prawns mortality | (Sun et al., 2020) |
| Medaka | kitlga | CRISPR/Cas9 | Pigmentation | Regulation of melanogenesis Melanophore proliferation and migration | (Otsuki et al., 2020) |
| Giant freshwater prawn | MroDmrt11E | RNAi | Sex control | Production of all-male monosex freshwater prawn | (Xu and Ma, 2022) |
| Tiger puffer | dead end 1 (dnd1) | CRISPR/Cas9 | Sex control | Surrogate production | (Yoshikawa et al., 2024) |
| Channel catfish | elongase gene | CRISPR/Cas9 | Growth | Enhancement of nutritional quality of catfish | (Coogan et al., 2023) |
| antimicrobial peptide gene | CRISPR/Cas9 | Disease resistance | Bacterial resistance | (Wang et al., 2023 b) | |
| ticam1/rbl | CRISPR/Cas9 | Immunity | (Elaswad et al., 2018) | ||
| Blue catfish | Alligator cathelicidin gene | CRISPR/Cas9 | Disease resistance | Bacterial resistance | (Wang et al., 2023 c) |
Table 4.
Identification of QTLs in aquaculture animals using linkage mapping
| Species | Number and traits of QTLs | Number of candidate genes | Reference |
|---|---|---|---|
| 1 | 2 | 3 | 4 |
| Atlantic salmon | 3 QTLs for sea lice resistance | 2 | (Robledo et al., 2018 a) |
| 2 QTLs for piscine myocarditis virus (PMCV) disease resistance | 6 | (Hillestad and Moghadam, 2019) | |
| 2 QTLs for cardiomyopathy syndrome resistance | 4 | (Boison et al., 2019) | |
| Common carp | 18 QTLs for head size | 10 | (Chen et al., 2018) |
| 1 QTL for koi herpesvirus (KHV) disease resistance | (Palaiokostas et al., 2018) | ||
| 17 QTL for feed conversion efficiency | (Zhang et al., 2021) | ||
| Grass carp | 4 QTLs for growth | 17 | (Huang et al., 2020) |
| Rainbow trout | 24 QTLs for Aeromonas salmonicida resistance | 33 | (Marana et al., 2021) |
| 21 QTLs for infectious hematopoietic necrosis disease resistance (IHN) | (Vallejo et al., 2019) | ||
| 5 QTLs for BCWD | (Fraslin et al., 2018) | ||
| 6 QTLs for ESC resistance | 37 | (Shi et al., 2018) | |
| 3 QTLs for ESC resistance | 55 | (Tan et al., 2018) | |
| Channel catfish | 6 QTLs for growth, 10 QTLs for sex | 25 | (Zhang et al., 2019 b) |
| Yangtze River common carp | 21 QTLs for growth, 4 QTLs for sex | 5 | (Feng et al., 2018) |
| Yellow river carp | 29 QTLs for growth | 3 | (Wang et al., 2022 b) |
| Largemouth bass | 32 QTLs for growth, 13 QTLs for sex | (Dong et al., 2019) | |
| Large yellow croaker | 7 QTLs for Cryptocaryon irritans disease resistance | 29 | (Kong et al., 2019) |
| Snapper | 4 QTLs for growth | 13 | (Ashton et al., 2019) |
| Pearl oyster | 32 QTLs for growth, 1 QTL for sex trait | 4 | (Liu et al., 2020 a) |
| Swimming crab | 20 QTLs for sex | 3 | (Lv et al., 2018) |
| 2 QTLs for salinity tolerance | 79 | (Lv et al., 2019) | |
| Mud carb | 27 QTLs for growth, 2 QTLs for sex | 13 | (Waiho et al., 2019) |
| Pacific oyster | 41 QTLs for growth | 17 | (Li et al., 2018) |
| 6 QTLs associated with orange shell color, 1 QTL for sex | (Han et al., 2021) | ||
| 2 QTLs for growth | 4 | (Kho et al., 2021) | |
| Black carp | 17 QTLs for growth | (Guo et al., 2022) | |
| 19 QTLs for growth and cold tolerance traits | 6 | (Zhang et al., 2023) | |
| South African abalone | 5 QTLs of growth | 8 | (Tshilate et al., 2024) |
| Tiger puffer | 14 QTLs for growth | (Liu et al., 2022 b) | |
| Dusky kob | 5 QTLs for of growth | 11 | (Jackson and Rhode, 2024) |
| Pacific white shrimp | 11 QTLs for growth | 4 | (Chen et al., 2024) |