
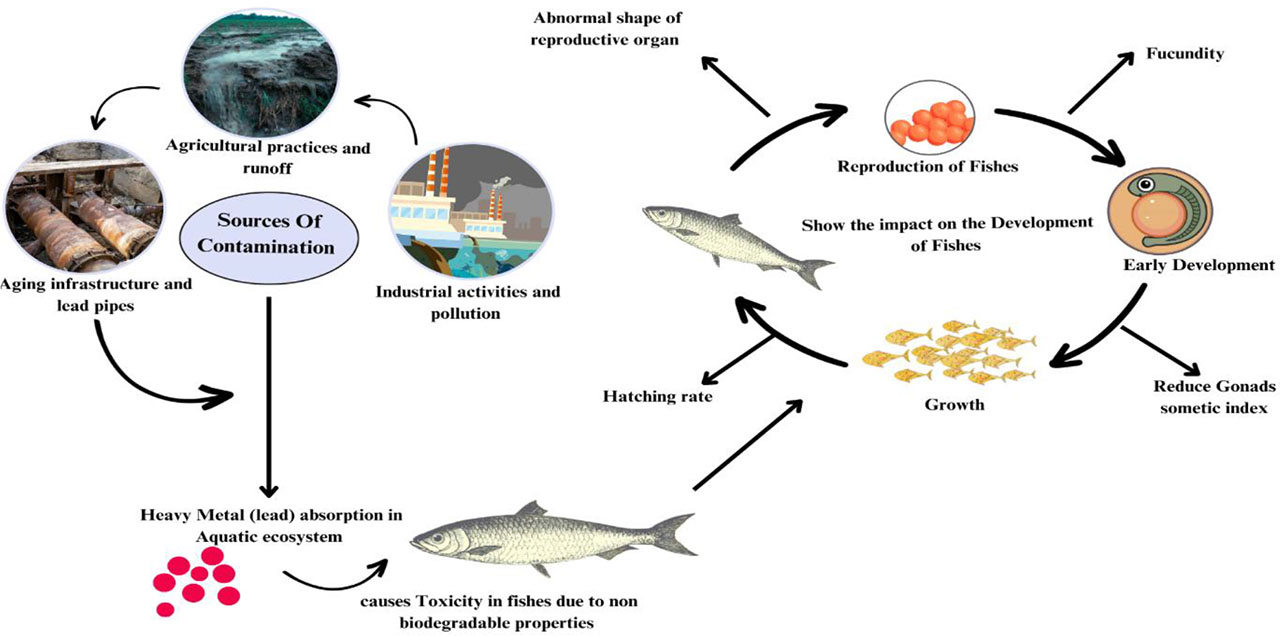
Graphical Abstract
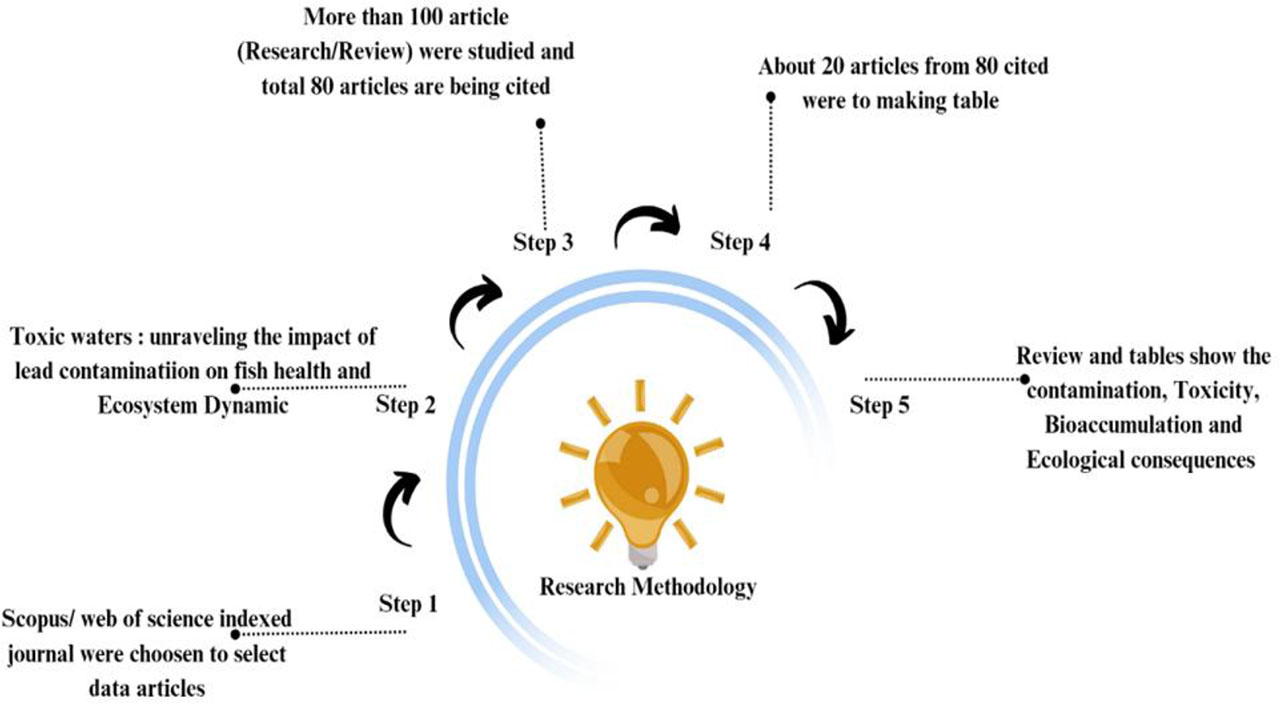
Figure 1.
Graphical representation of review methodology
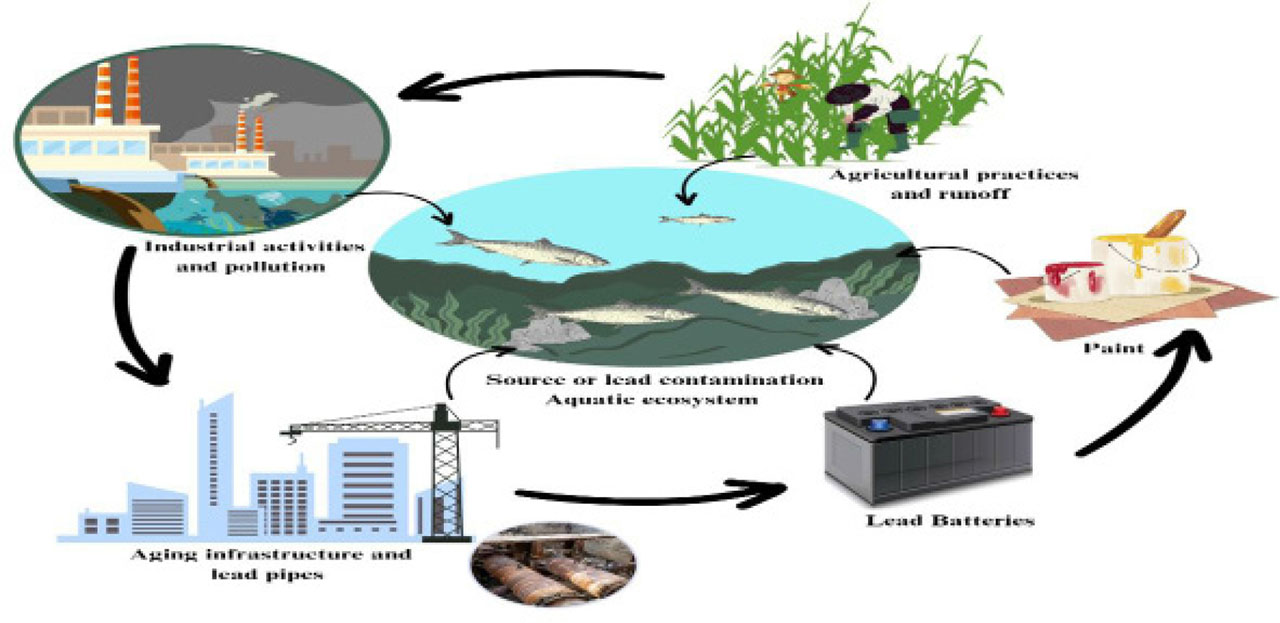
Figure 2.
Different pathways of lead contamination in aquatic ecosystem
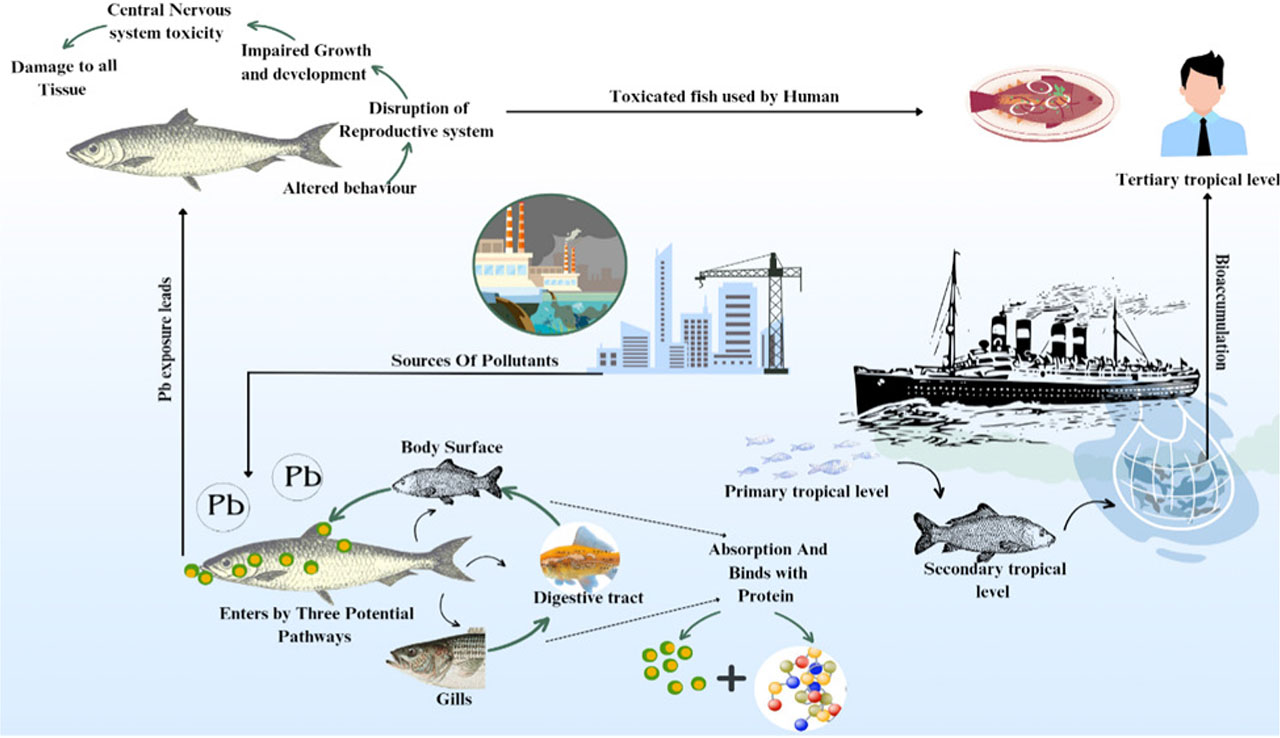
Figure 3.
Bioaccumulation and effects of lead in fish through different pathways and their uptake on different trophic levels
Table 1.
Concentration and accumulation profile in different organs of different fish species
| No. | Fish species | Habitat | Concentration | Accumulation profile | Month of breeding | Reference |
|---|---|---|---|---|---|---|
| 1. | Labeo rohita | Freshwater | 0.23–1.84 µg/g | Kidney > Liver > Gills > Skin > Muscle > Scales | April –September | (Maurya et al., 2019) |
| 2. | Tenualosa ilisha | Marine | 0.562 ml/g | Gills > Muscle > Liver | Complete year except 7–28 October | (Sarker et al., 2021) |
| 3. | Ctenopharyngodon idella | Freshwater | 0.237 µg/g | Muscles | October – January | (Chatta et al., 2016) |
| 4. | Mystus tengara | Freshwater | 0.24–0.84 ml/g | Liver > Gills > Muscle | May – September | (Tabrez et al., 2021) |
| 5. | Labeo calbasu | Freshwater | 0.115 µg/g | Muscle tissue | July – August | (Sahu et al., 2023) |
| 6. | Cirrhina mrigala | Freshwater | 2.4 mg/L | Liver > Muscle > Gills | May – September | (Javed, 2012) |
| 7. | Cirrhinus reba | Freshwater | 3.4 mg/L | Gill > Muscle > Liver | June – August | (Shivakumar et al., 2014) |
| 8. | Channa marulius | Freshwater | 0.02 | Mostly in muscles | July – September | (Chatta et al., 2016) |
| 9. | Catlacatla | Freshwater | 2.7 mg/L | Liver > Gills > Muscle | June – July | (Sahu et al., 2023) |
| 10. | Crossocheilus latius | Freshwater | 1.816 mg/L | Liver > Gills > Muscle | April – July | (Maurya et al., 2019) |
| 11. | Mystus seenghala | Freshwater | 0.04 | Gills > Liver > Kidney > Muscle | June – September | (Tabrez et al., 2021) |
| 12. | Clupisoma garua | Freshwater | 2.72 mg/L | Liver > Gills > Muscle | March – August | (Maurya et al., 2019) |
| 13. | Oreochromis niloticus | Freshwater | 12.7 | Muscles | August – September | (Tole and Shitsama, 2003) |
| 14. | Clarias gariepinus | Freshwater | 14.9 µg/g | Gill > Liver > Kidney > Muscle | September – March | (Tole and Shitsama, 2003) |
| 15. | Synodontisschall | Freshwater | 1.05 µg/g | Gills > Tissues > Intestine | July – October | (Nnaji et al., 2007) |
| 16. | Cyprinus carpio | Freshwater | 250 μg/L | Gill > Intestine > Muscle > Kidney > Liver | January – March July – August | (Tripathi et al., 2003) |
| 17. | Sparus aurata | Marine | 0.75 mg/kg | Liver > Gill > Intestine > Dorsal muscle | October – December | (Bat et al., 2022) |
| 18. | Long tail tuna | Marine | 0.22 µg/g | Liver > Muscles | May – October | (Ahmed et al., 2015) |
| 19. | Gillichthys mirabilis | Marine | 50 μg/kg | Intestine > Vertebrae > Fin > Gill > Skin > Liver > Muscle | December – April | (Somero et al., 1977) |
| 20. | Sebastes schlegelii | Marine | 240 mg/kg | Kidney > Liver > Spleen > Intestine > Gill > Muscle | October – February | (Kim et al., 2017) |
| 21. | Etroplus maculatus | Freshwater | 0.79 µg/g | Intestine > Kidney > Gills > Brain > Muscles > Liver | Throughout year | (Shivakumar et al., 2014) |
| 22. | Hypophthalmichthys molitrix | Freshwater | 0.325 µg/g | Intestine > Muscles | February – May | (Chatta et al., 2016) |
| 23. | Ompok bimaculatus | Freshwater | 0.54 µg/g | Brain > Liver > Gills > Kidney > Muscles > Intestine | May – August | (Shivakumar et al., 2014) |
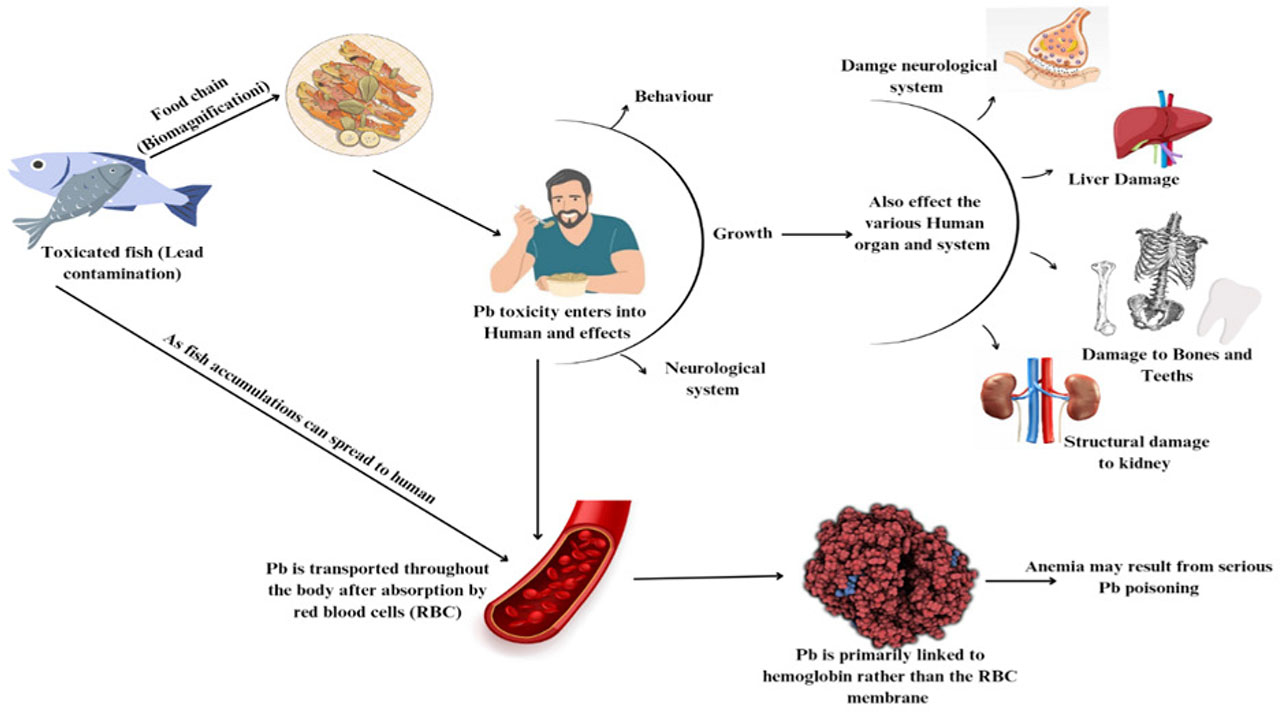
Figure 4.
Ecological effects of lead-contaminated fish on higher trophic level