
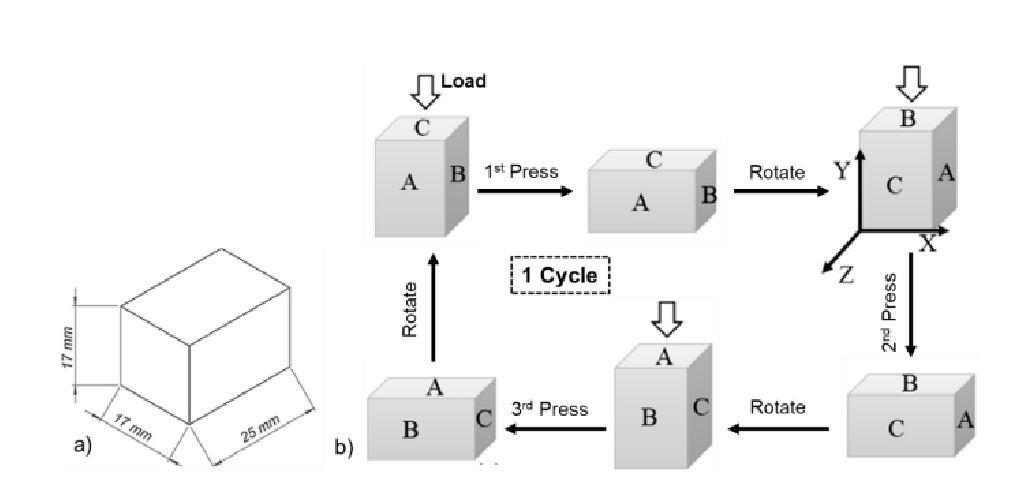
Fig. 1.
Original sample (a) and MDF process diagram with 1 cycle in three sample directions (b)
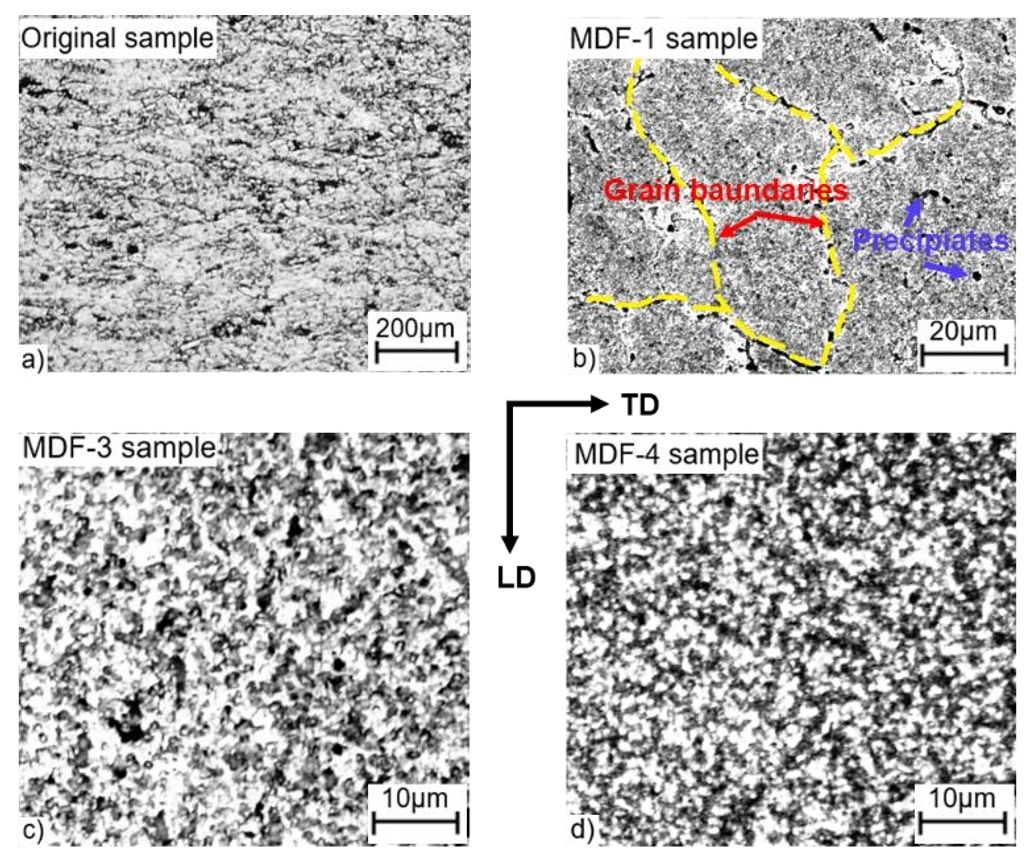
Fig. 2.
Cross-sectional optical microstructure of the samples: (a) the original sample; b) the MDF-1 sample; c) the MDF-3 sample; (d) the MDF-4 sample
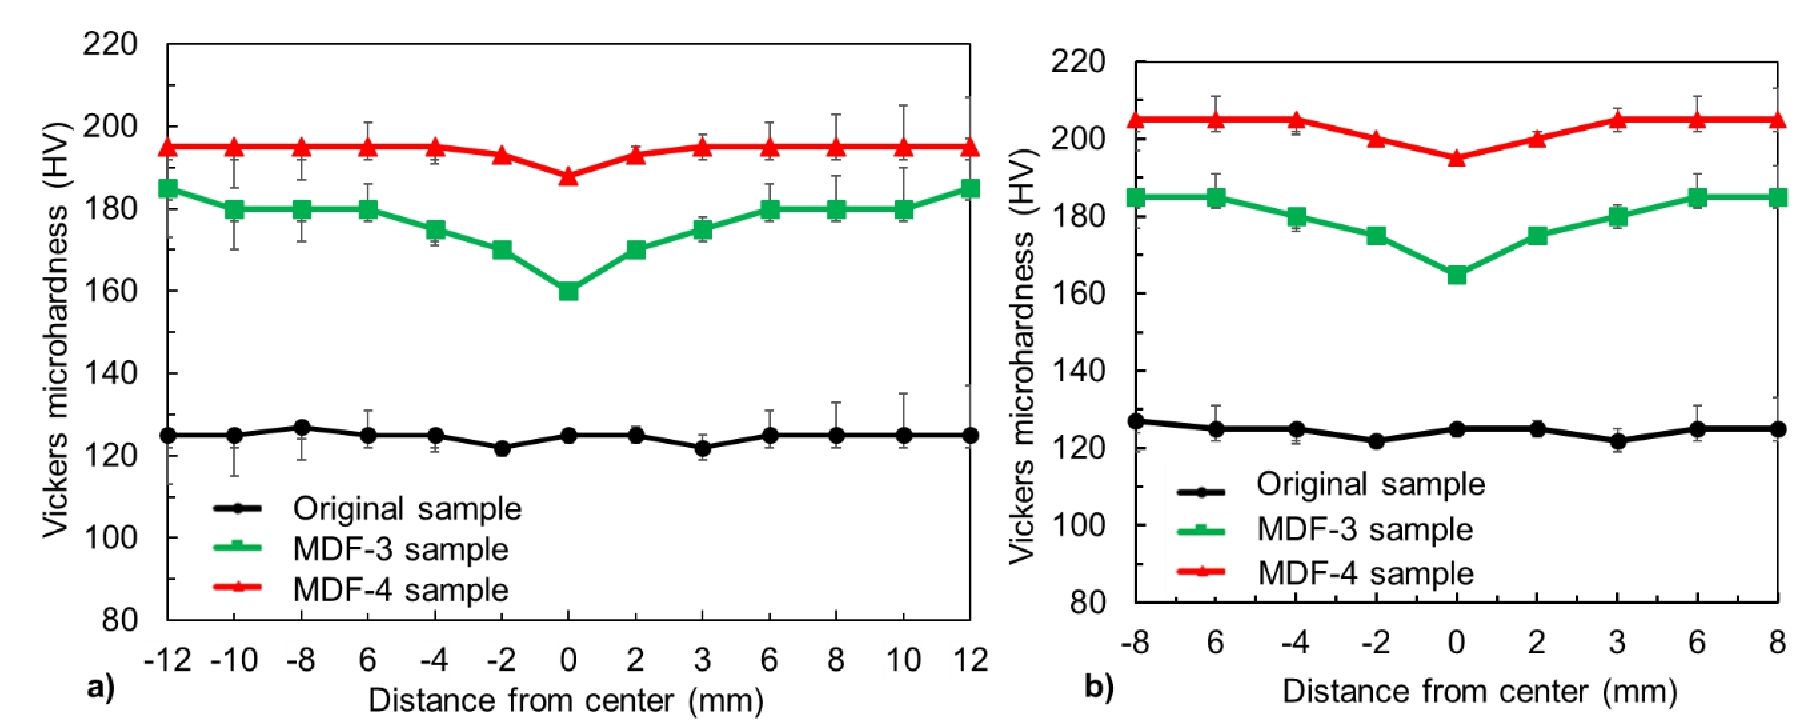
Fig. 3.
Change of microhardness determined at the mid-section positions with distance from the center of the MDFed sample in the length direction (a) and width direction (b) for the MDF-3 sample and the MDF-4 sample
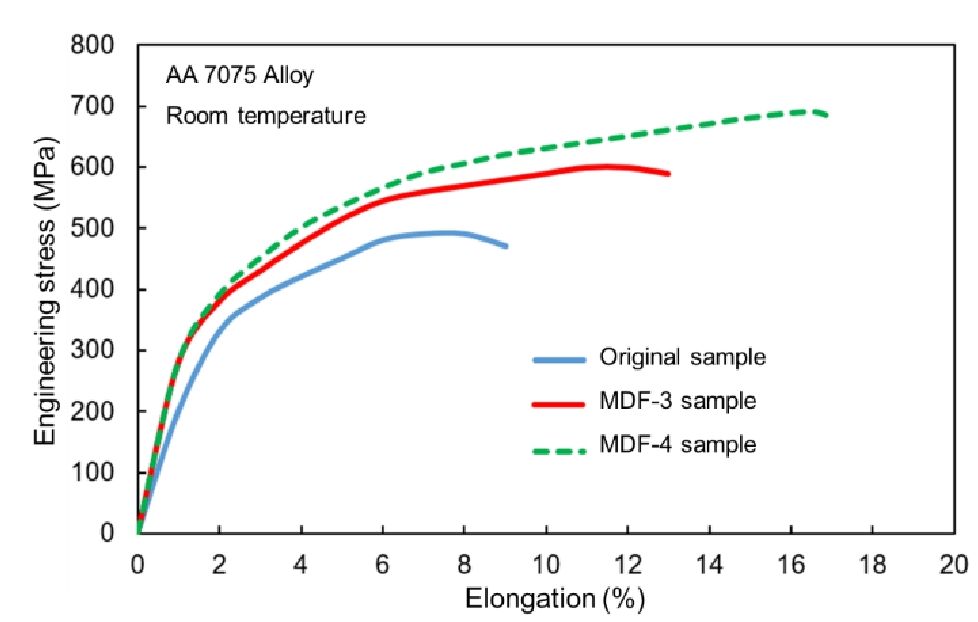
Fig. 4.
Engineering stress-relative elongation curves of the original sample, the MDF-3 sample, and the MDF-4 sample
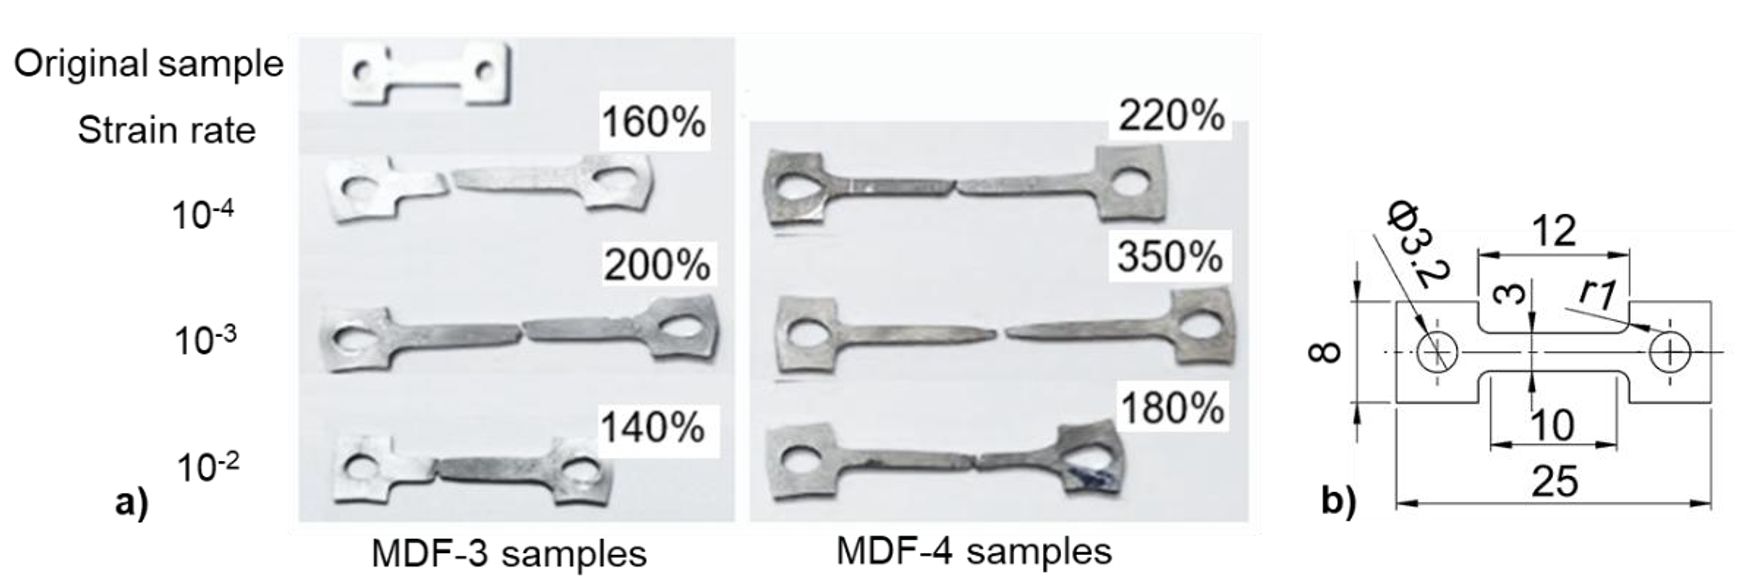
Fig. 5.
Shape changes in the tensile samples of AA7075 alloy fabricated by MDF-3 sample and MDF-4 sample under the superplastic deformation conditions (a); and dimension of the tensile samples (b)
Tab. 1.
Tensile test results of the MDF-processed samples at different strain rates
| Samples | Elongations (%) | ||
|---|---|---|---|
| Strain rate 10–4 (s–1) | Strain rate 10–3 (s–1) | Strain rate 10–2 (s–1) | |
| MDF-3 | 160 | 200 | 140 |
| MDF-4 | 220 | 350 | 180 |
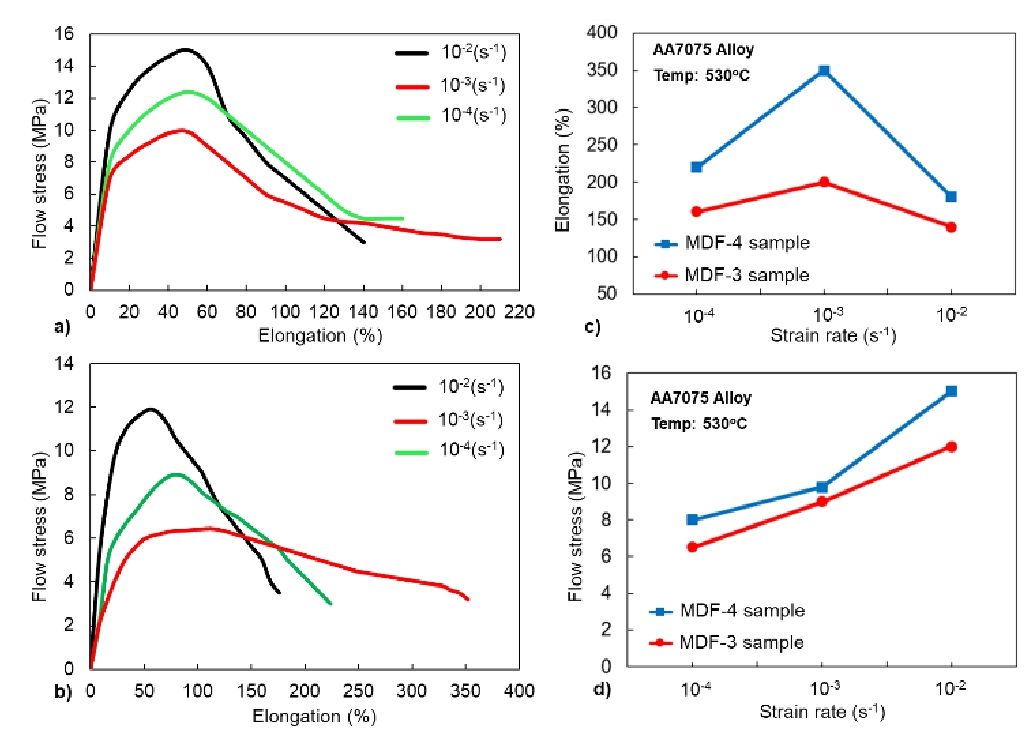
Fig. 6.
The flow stress - relative elongation curves at 530 °C for the MDF-3 sample (a), the MDF-4 sample (b) and the elongation and the flow stress of the MDFed (c,d) with different strain rates