
Tab. 1.
Sample description with commercial additives names and mass shares
| Additive | Sample name rHDPE/rGFRP/x%abbrv. | Additive concentration (wt%) |
|---|---|---|
| none | rHDPE/rGFRP | 0 |
| IrgaCycle PS 032 G | 0.2P | 0.2 |
| 0.5P | 0.5 | |
| Licocene® PE MS 431 | 1MAH | 1.0 |
| 2MAH | 2.0 | |
| 3MAH | 3.0 | |
| SilmaLink AX2292 | 0.3S | 0.3 |
| 1S | 1.0 | |
| 2S | 2.0 |
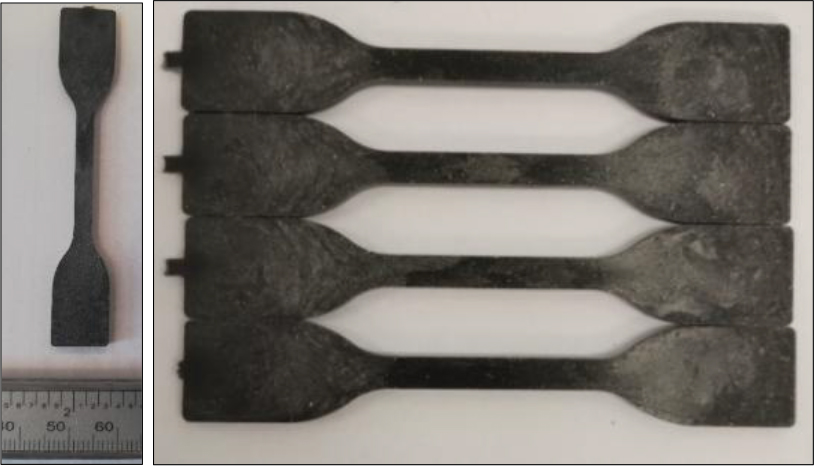
Fig. 1.
Geometry of injected specimens to mechanical and radiation tests
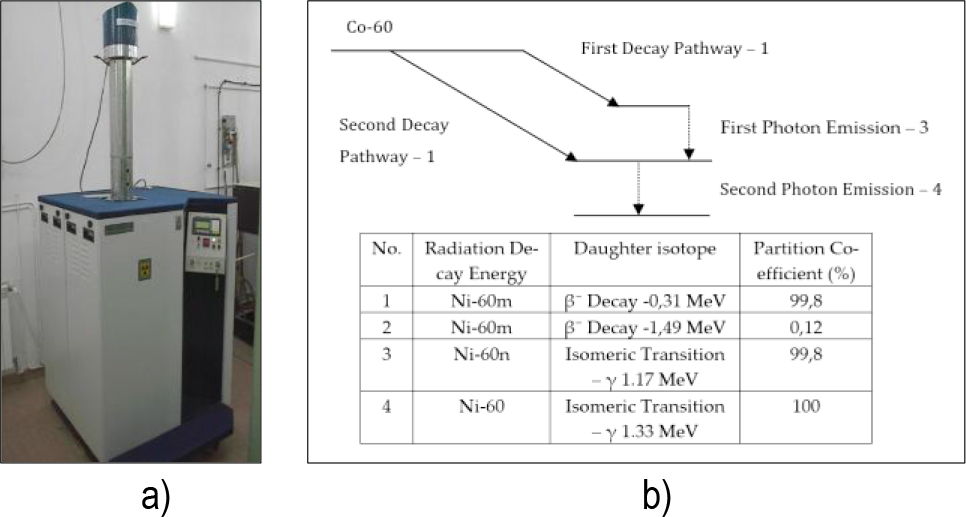
Fig. 2.
a)Gamma Chamber 5000 equipment; b) schematic of radioactive decay of 60Co
Tab. 2.
Radiation test samples names.
| Material/Absorbed dose | 0 kGy | 40 kGy | 60 kGy | 80 kGy | 100 kGy |
|---|---|---|---|---|---|
| rHDPE/rGFRP 40% | A0 | A40 | A60 | A80 | A100 |
| rHDPE | B0 | B40 | B60 | B80 | B100 |
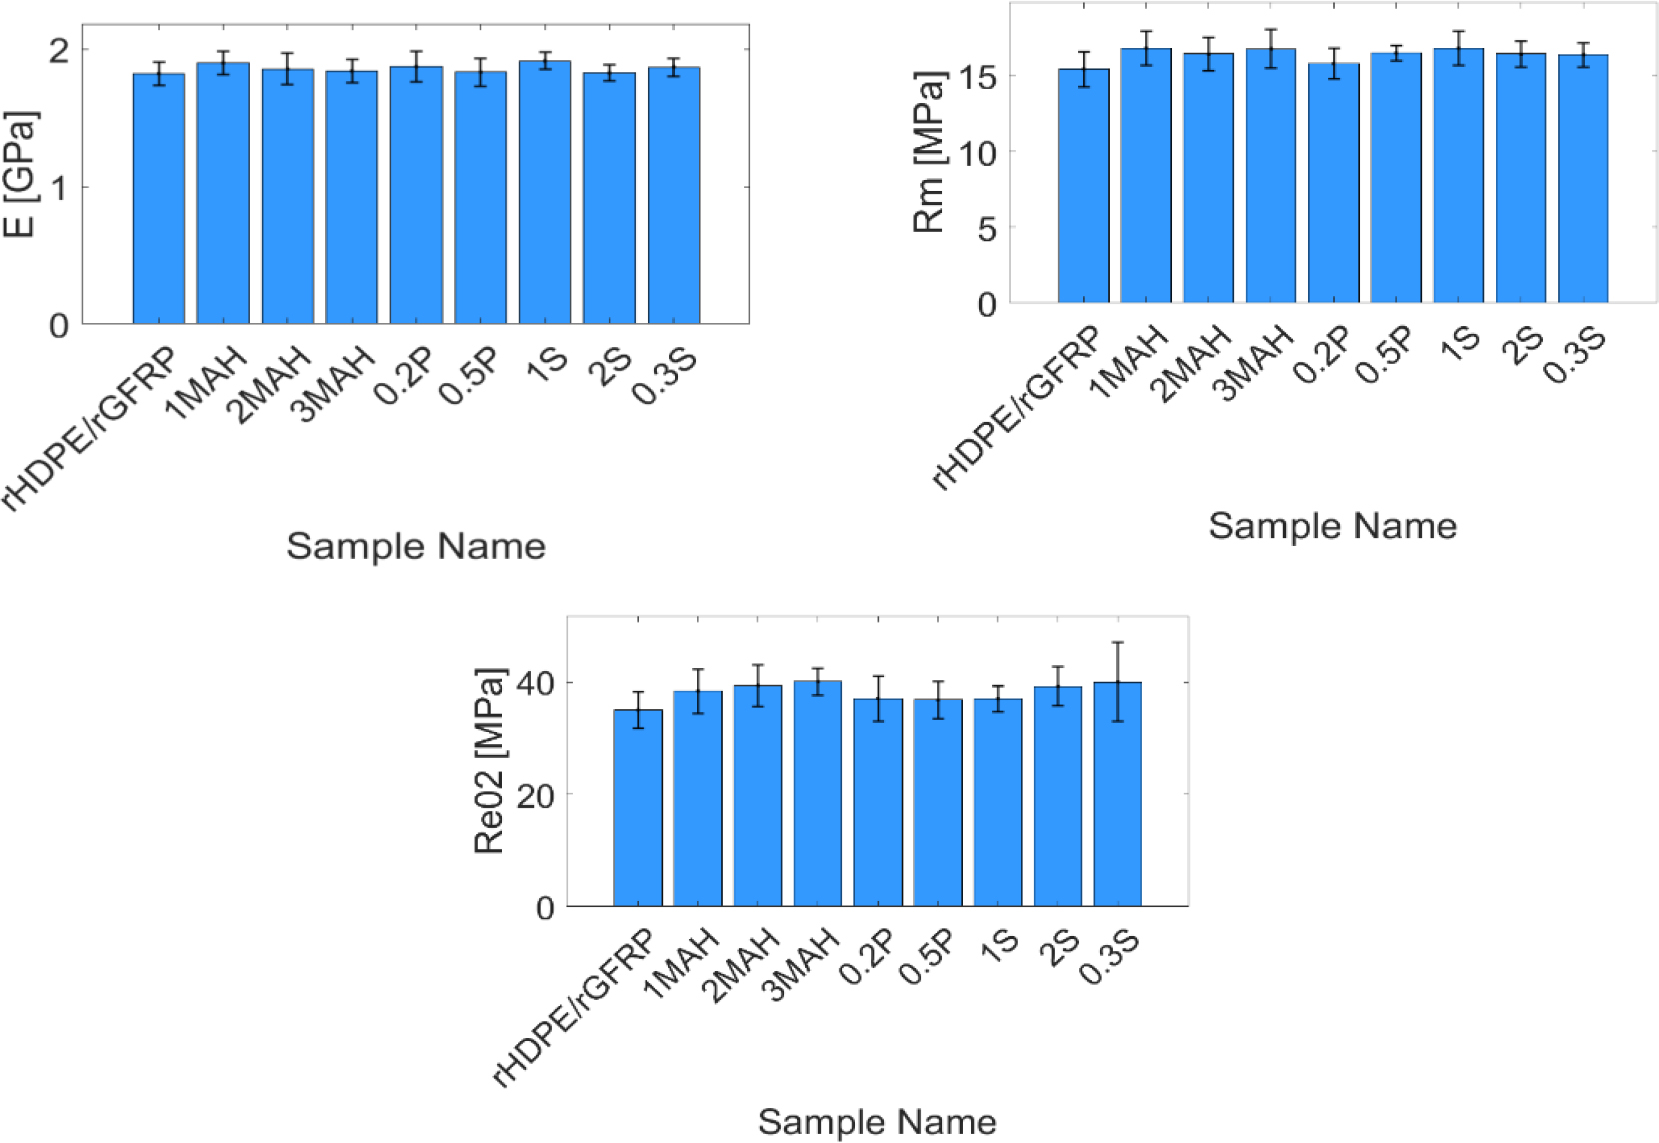
Fig. 3.
Mechanical parameters of rHDPE/rGFRP material with additives described below the chart: a) tensile modulus; b) tensile strength; c) offset yield strength
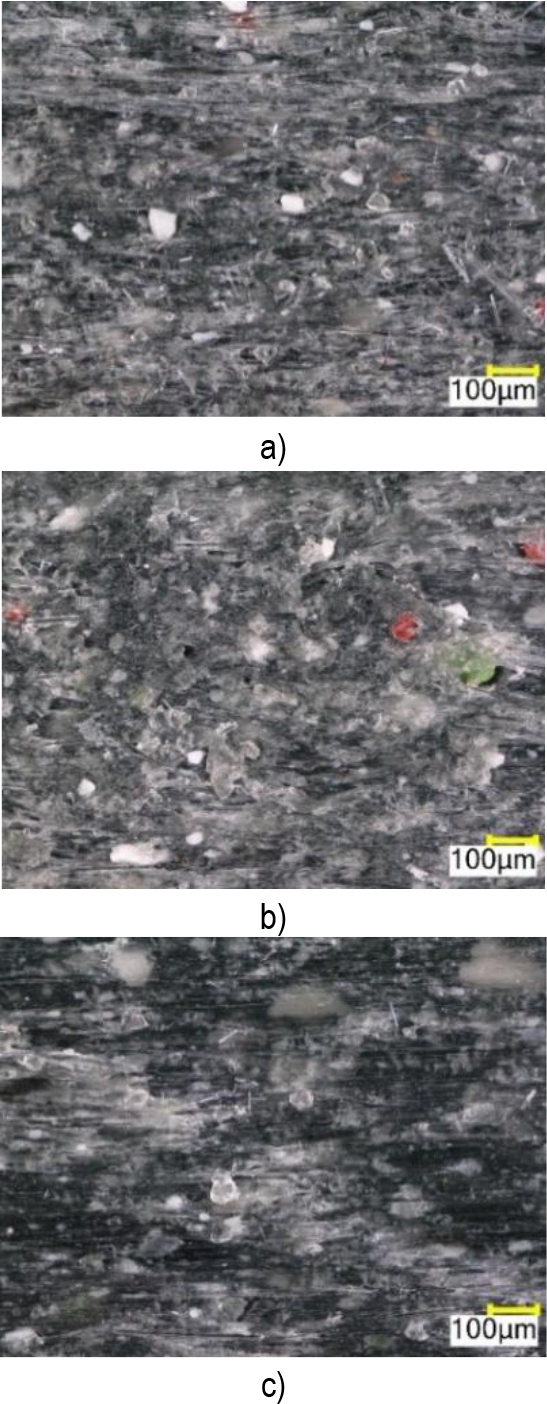
Fig. 4.
Surface of the materials rHDPE/rGFRP 40%: a) without additives; b) 3S; c) 3MAH
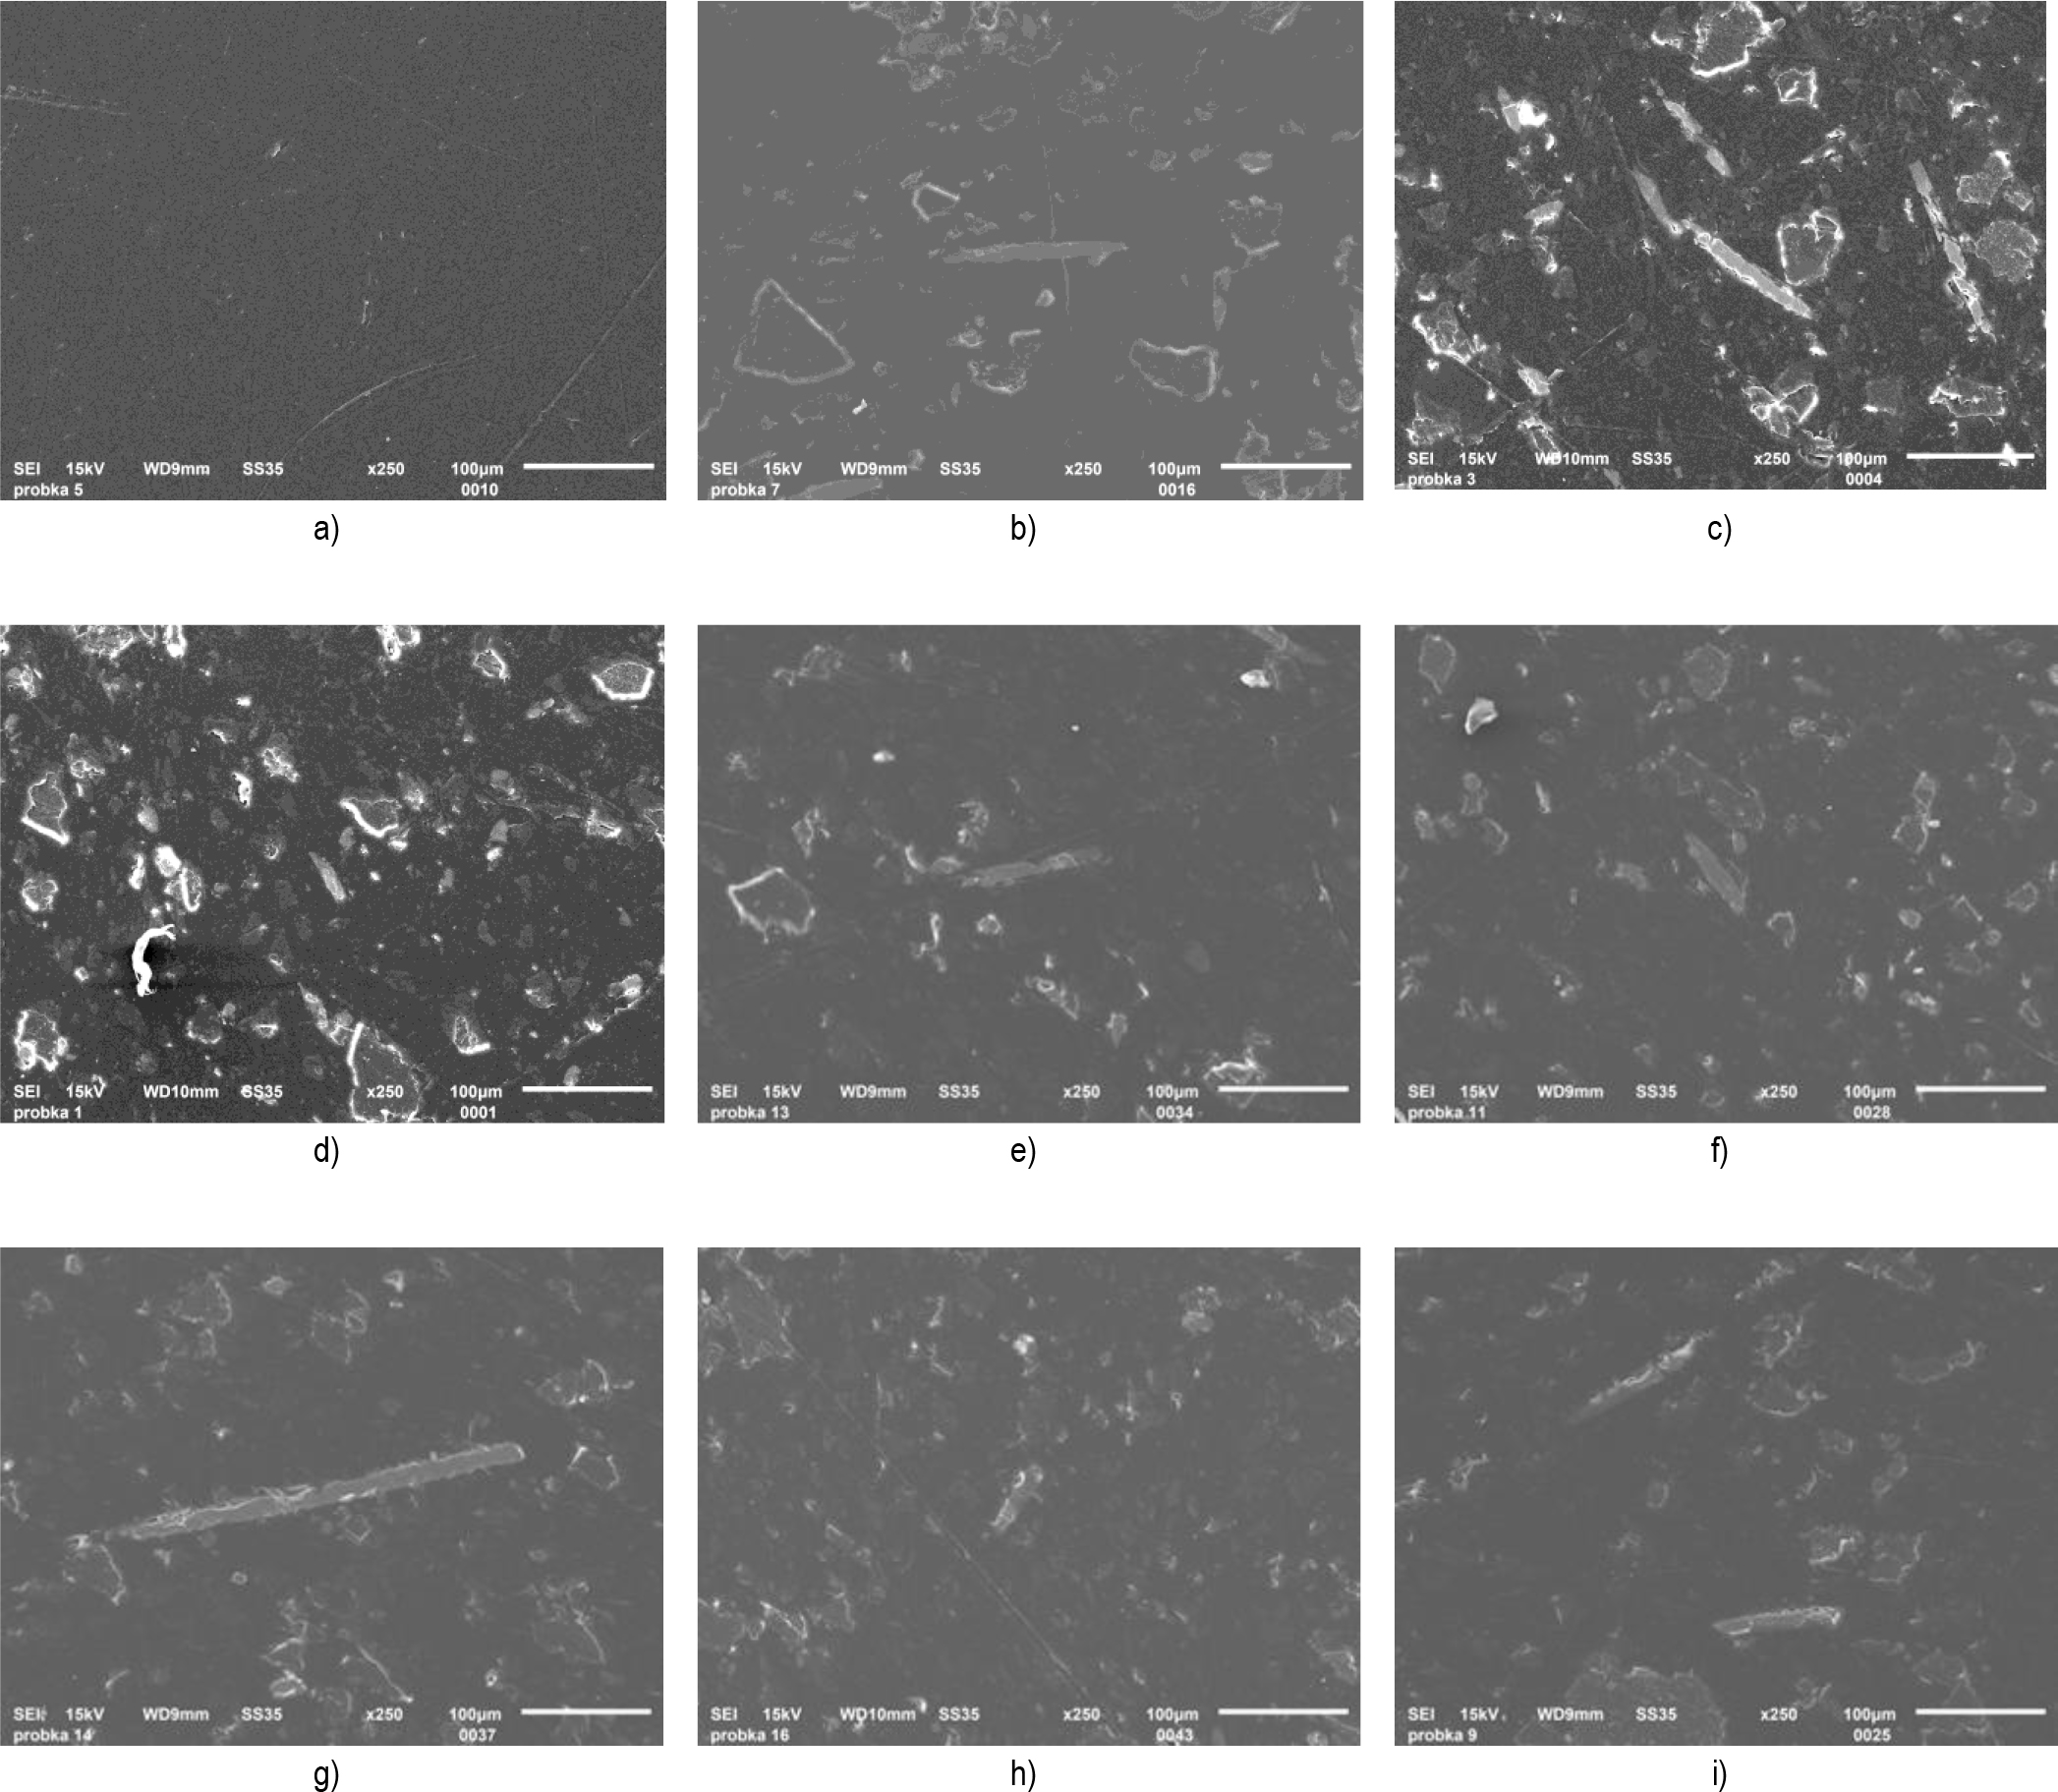
Fig. 5.
SEM images of the composite material with additives: a) rHDPE; b) rHDPE/rGFRP; c) 0.2P; d) 0.5P; e) 1S; f) 2S; g) 1MAH; h) 2MAH; i) 3MAH
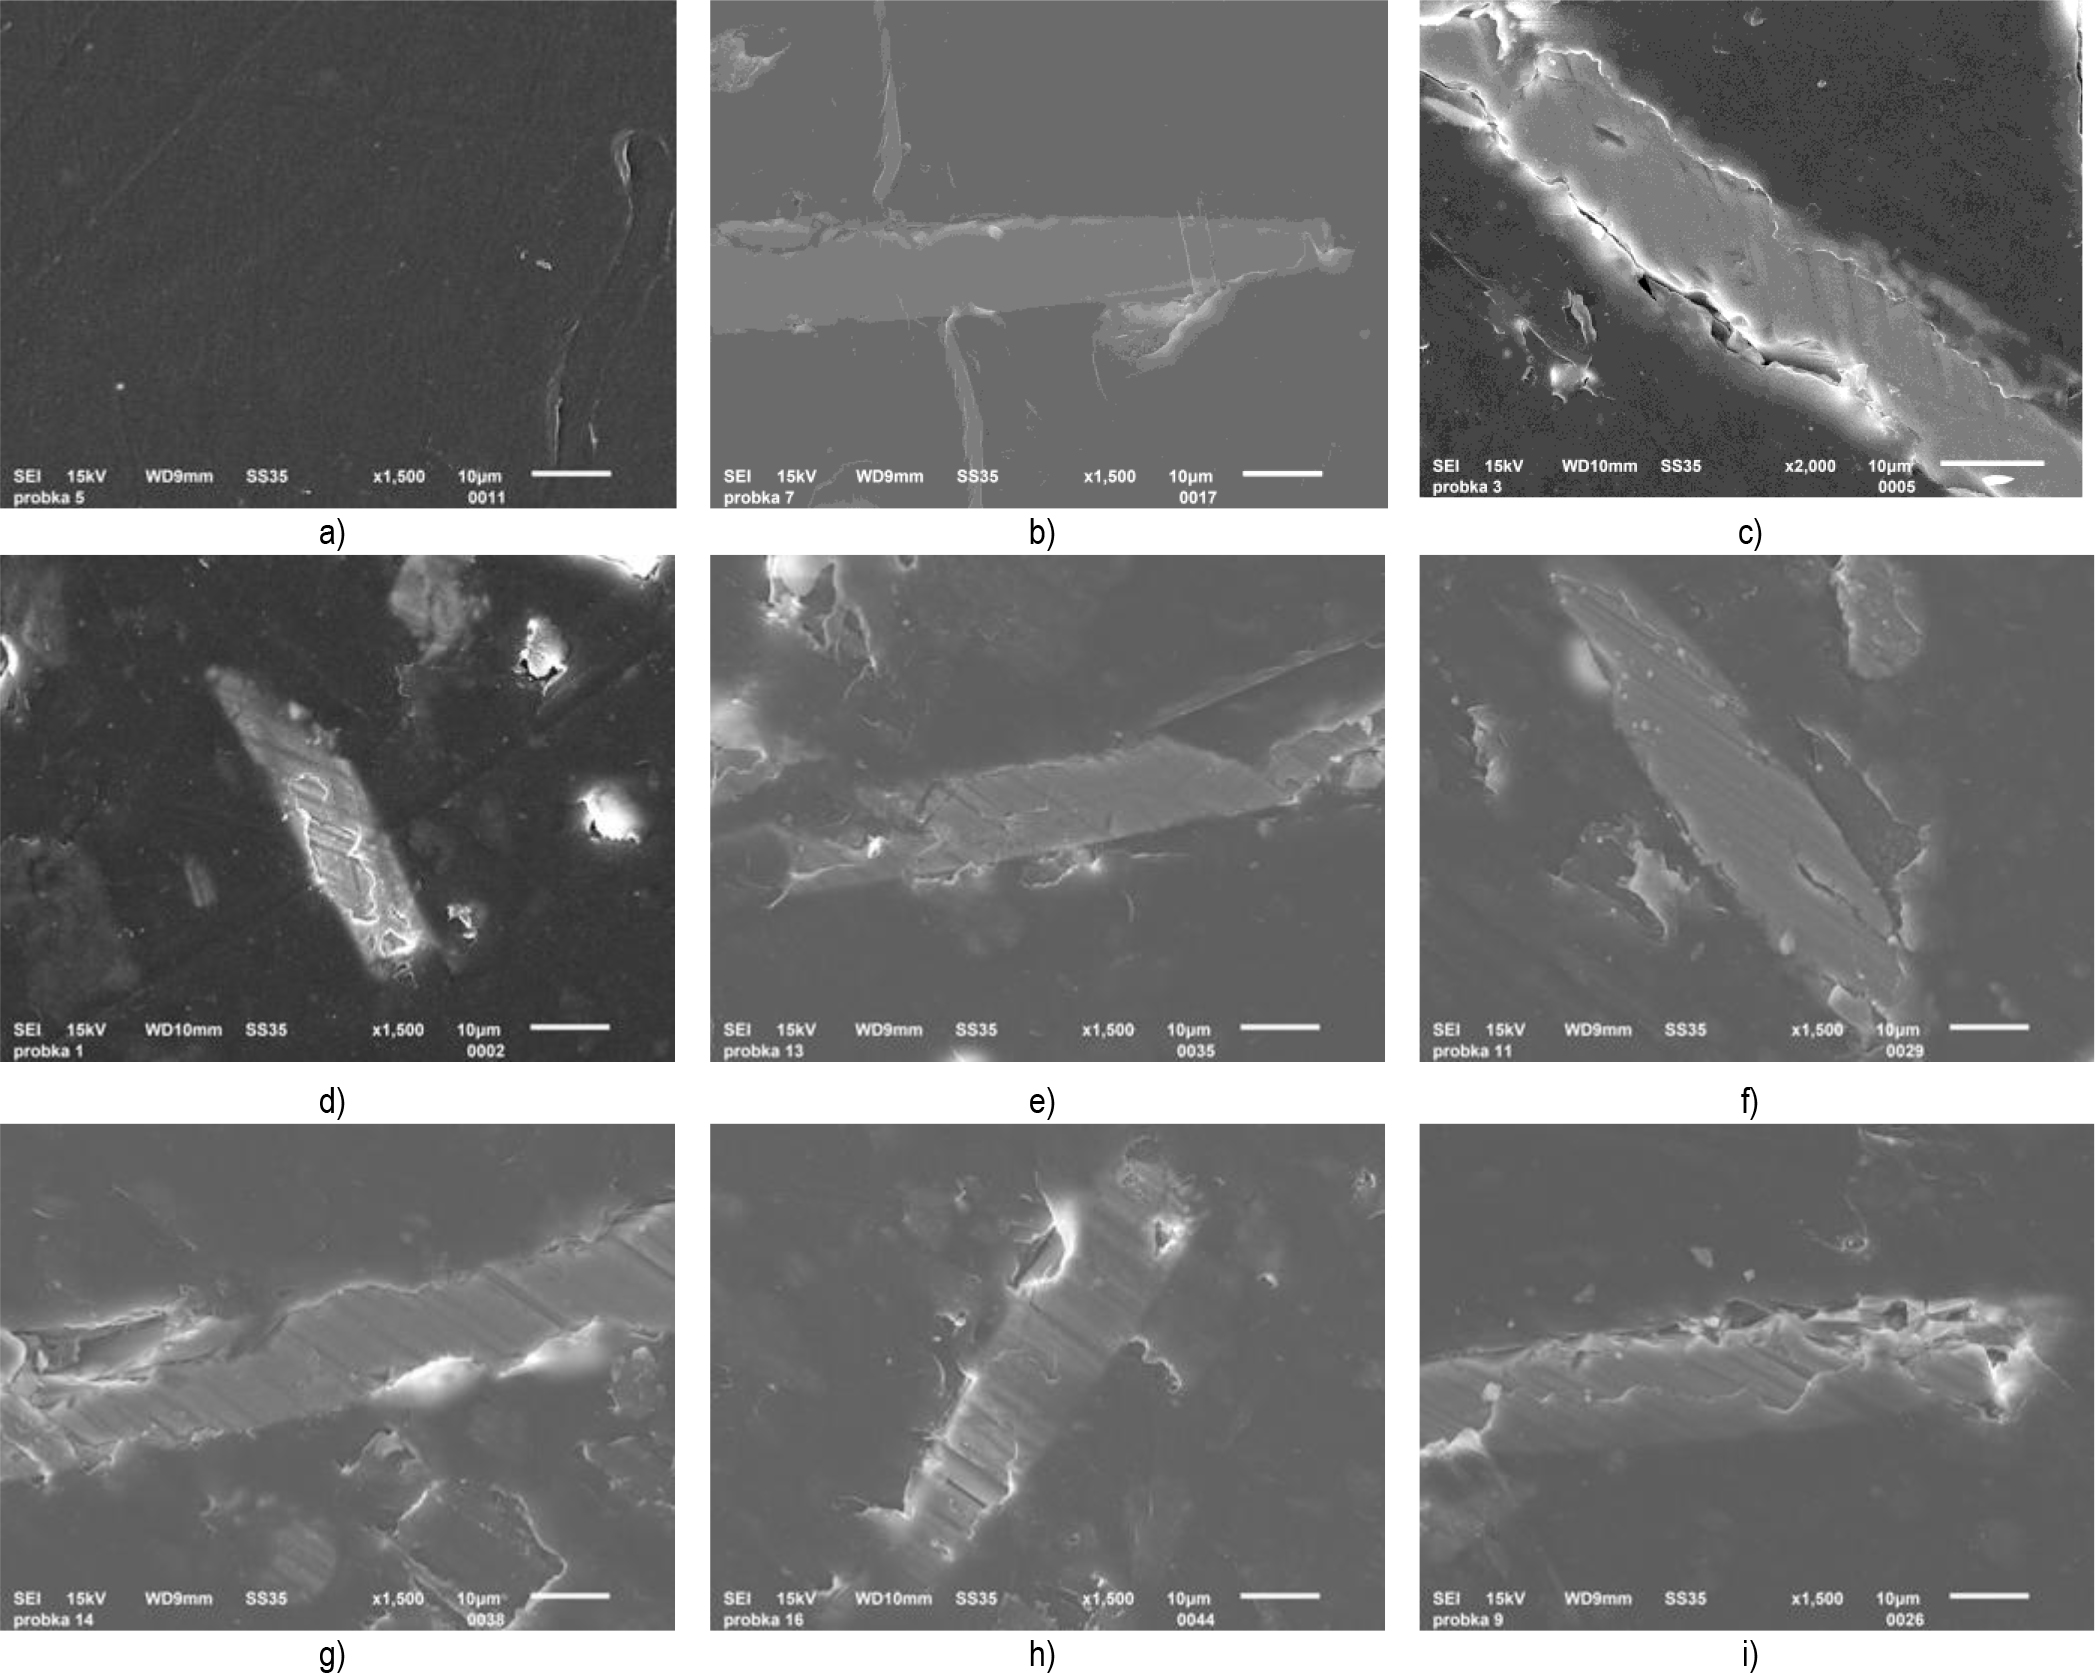
Fig. 6.
SEM images of the composite material with additives close-up view on fibre: a) rHDPE; b) rHDPE/rGFRP; c) 0.2P; d) 0.5P; e) 1S; f) 2S; g) 1MAH; h) 2MAH; i) 3MAH
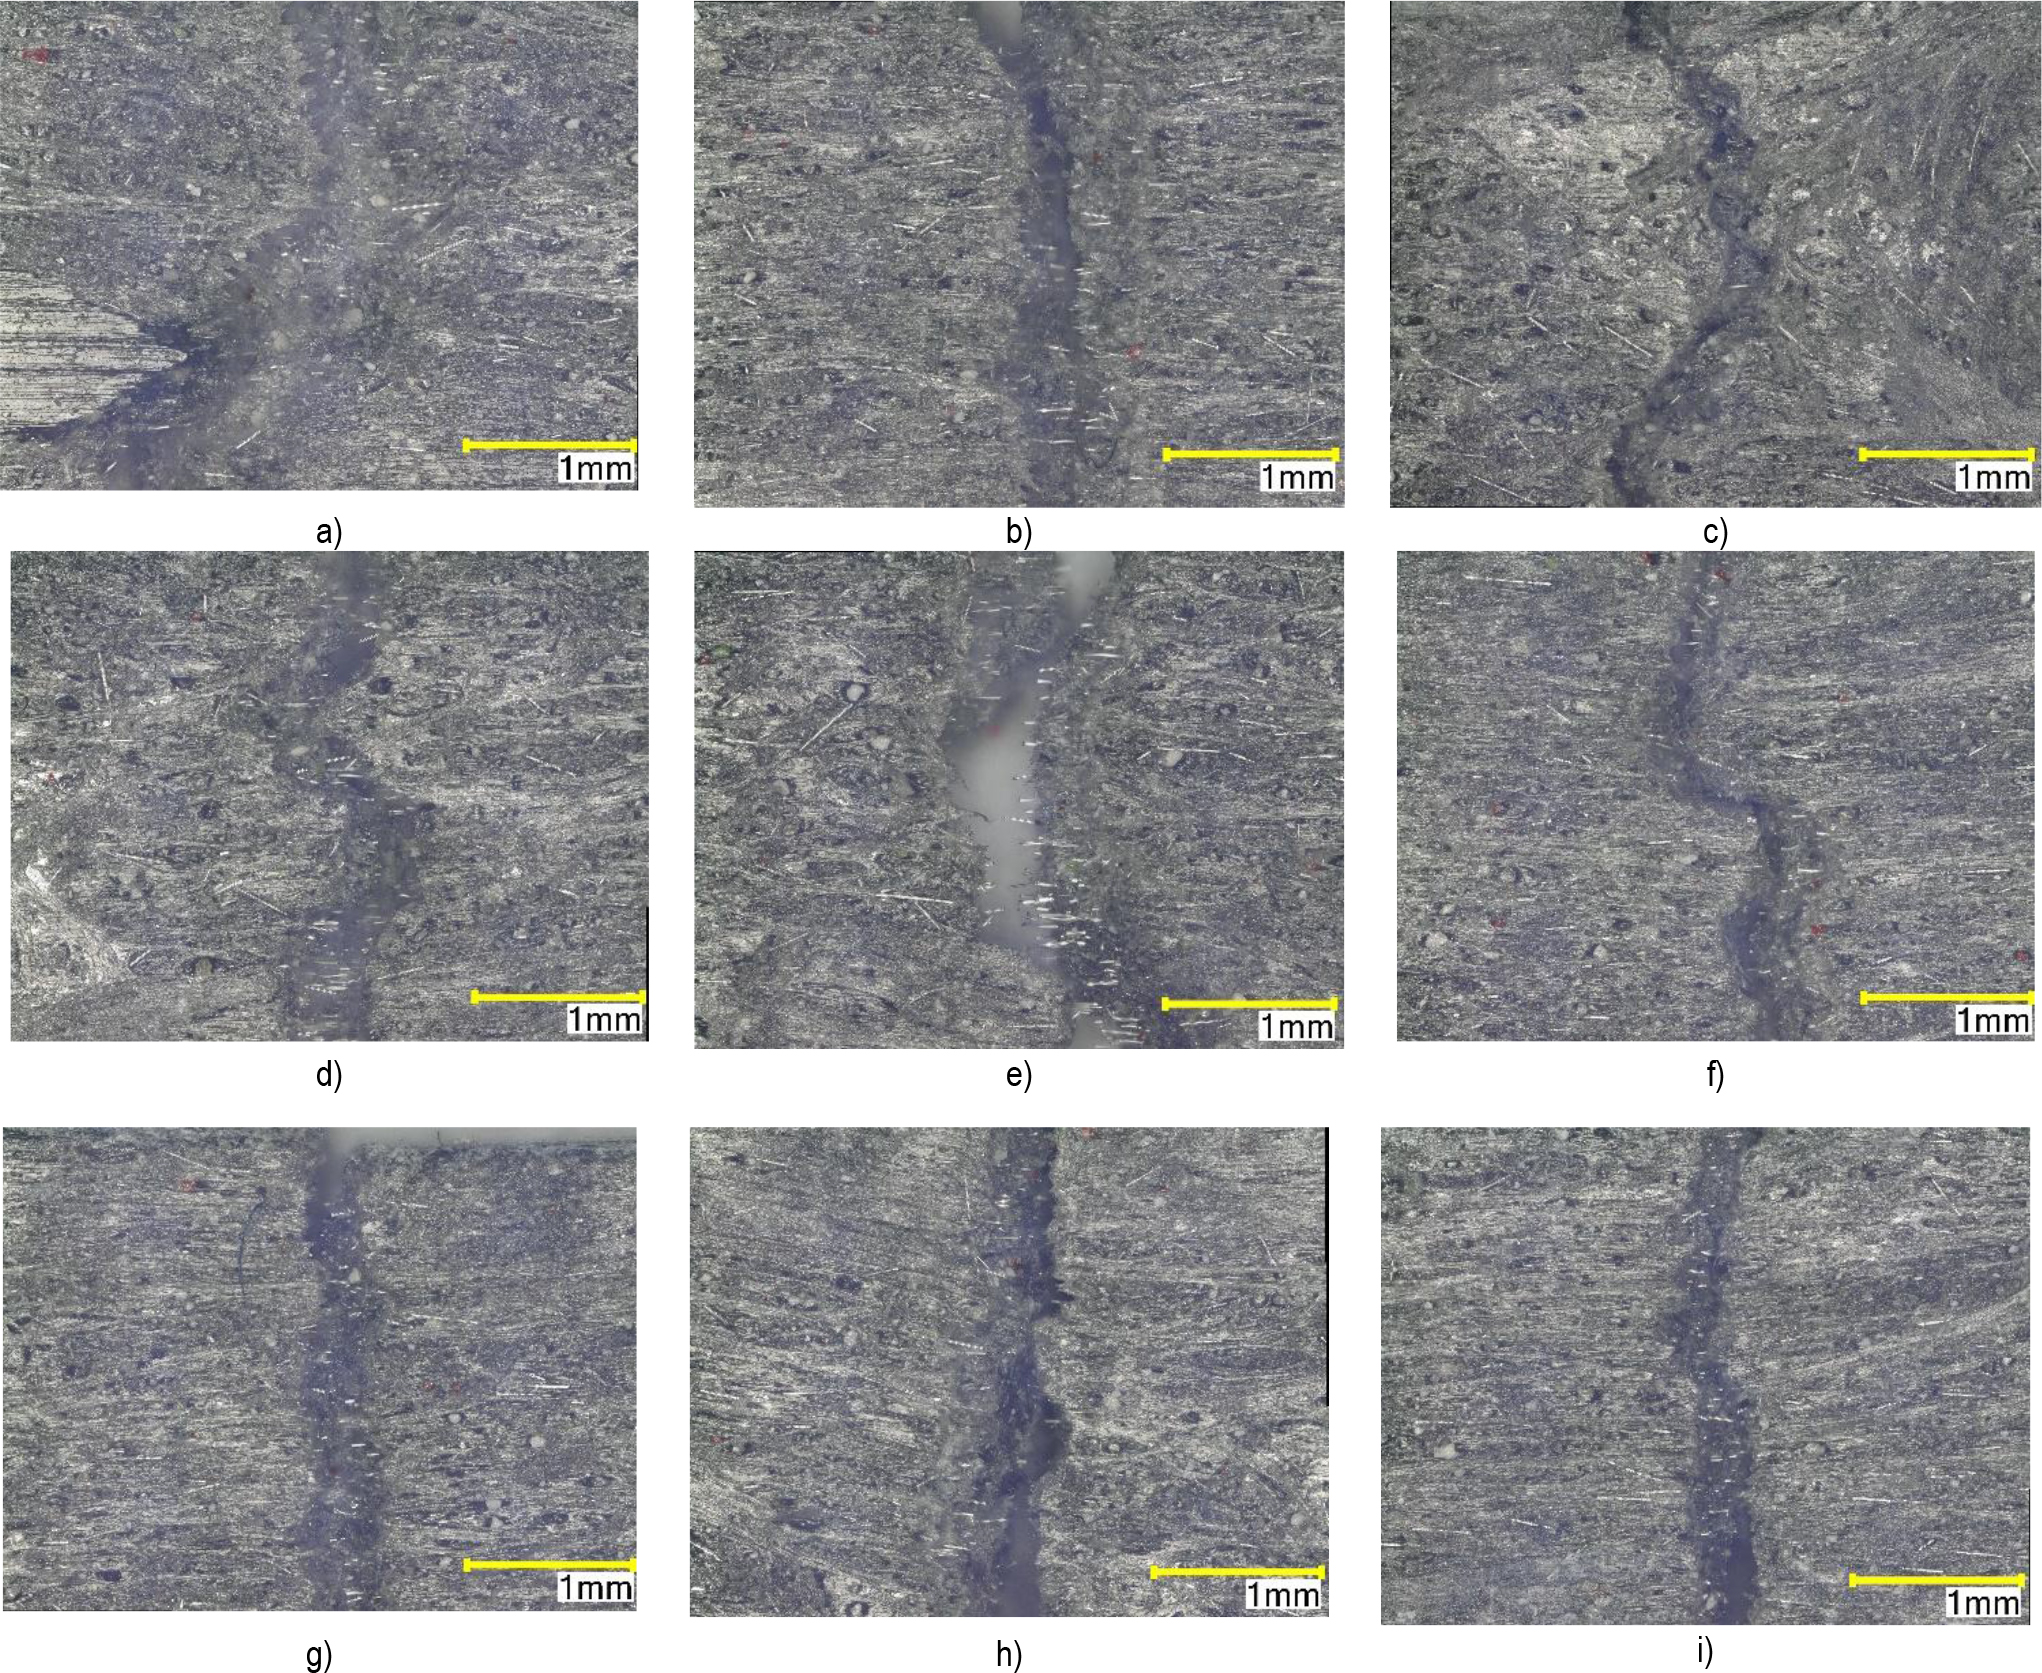
Fig. 7.
Optical microscope images of the composite material: a) rHDPE/rGFRP; b) 0.2P; c)0.5P; d) 0.3S; e) 1S; f) 2S; g) 1MAH; h) 2MAH; i) 3MAH
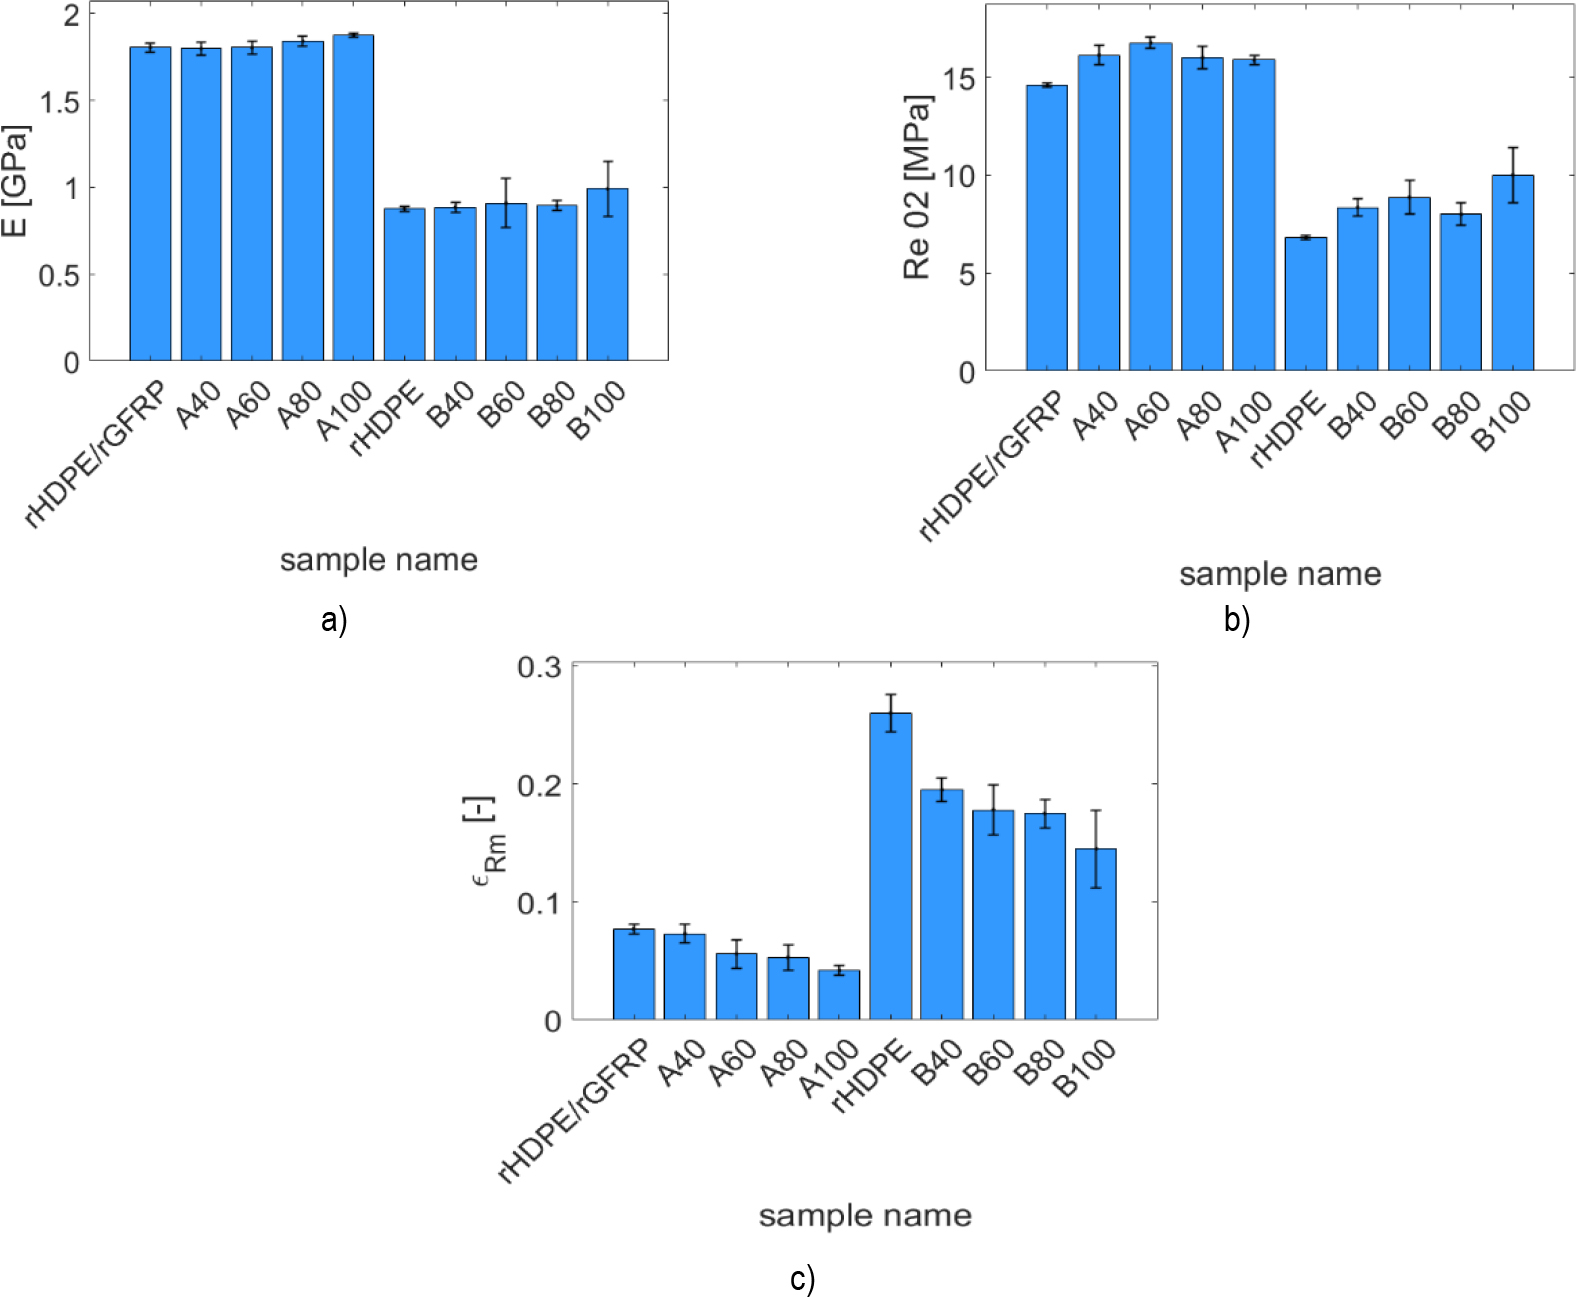
Fig. 8.
Mechanical parameters of irradiated specimens: a) tensile modulus of irradiated materials; b) offset yield strength; c) strain at tensile strength
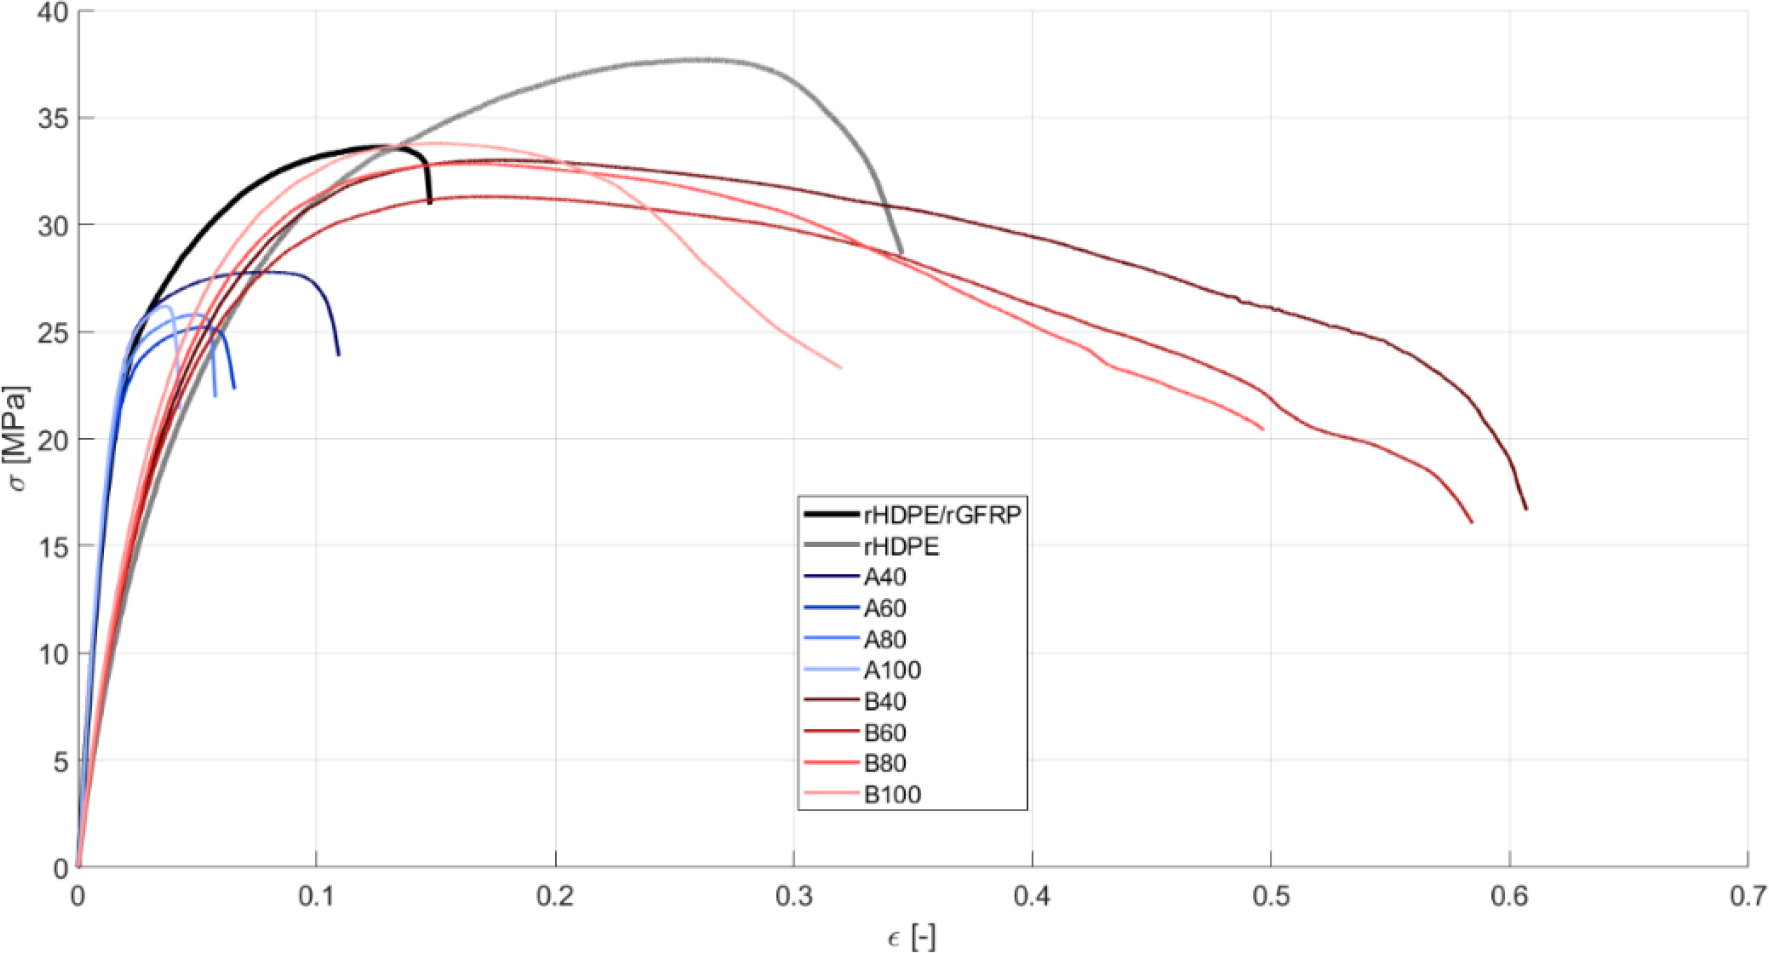
Fig. 9.
Engineering stress-strain relationship for non-irradiated (rHDPE/rGFRP and rHDPE) and irradiated samples (A40-A100 and B40-B100).
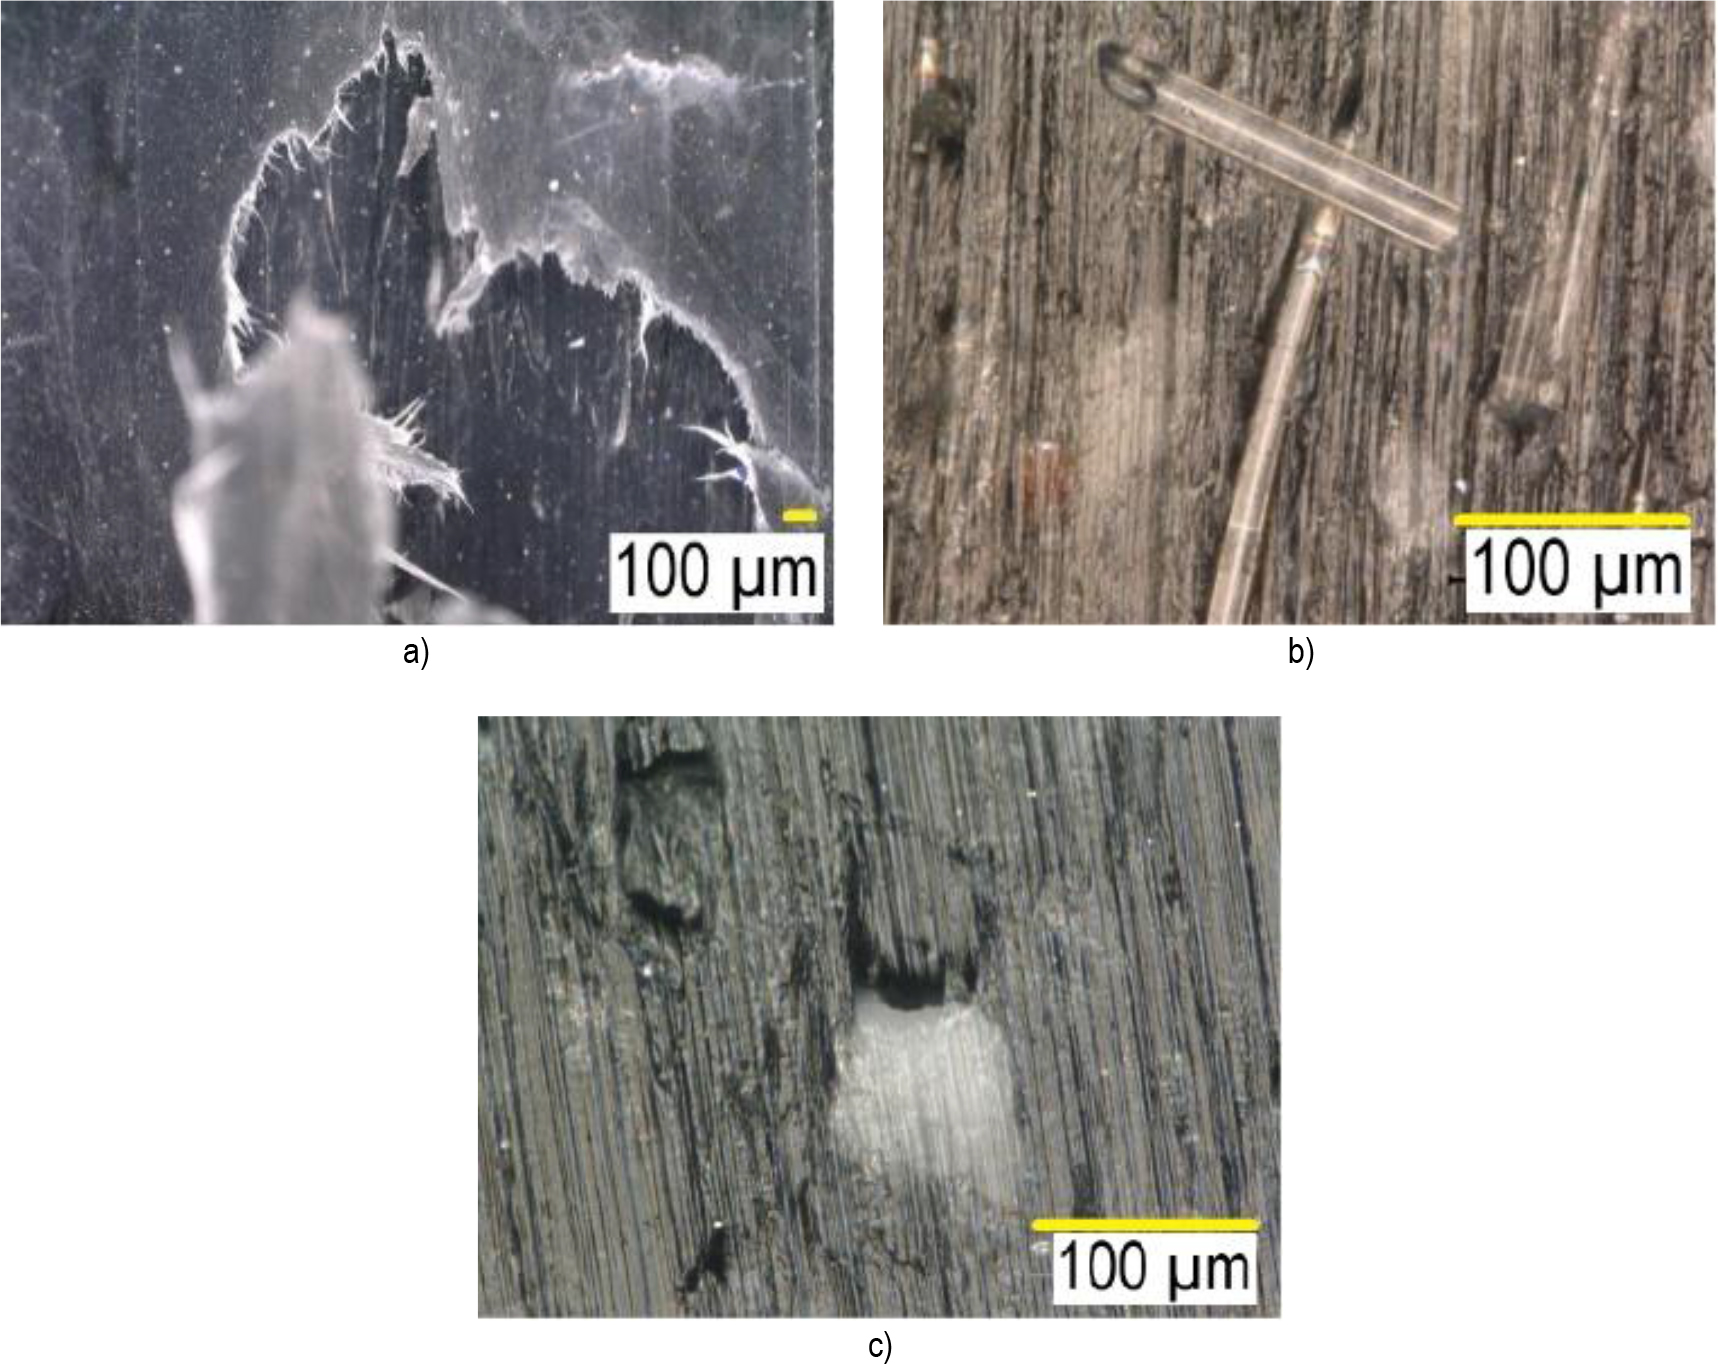
Fig. 10.
The surface of irradiated specimens after the tensile test: a) macro view on the degraded surface; b) close-up view on fibres; c) close-up view on resin fragment on the surface of the rHDPE/rGFRP sample after the tensile test
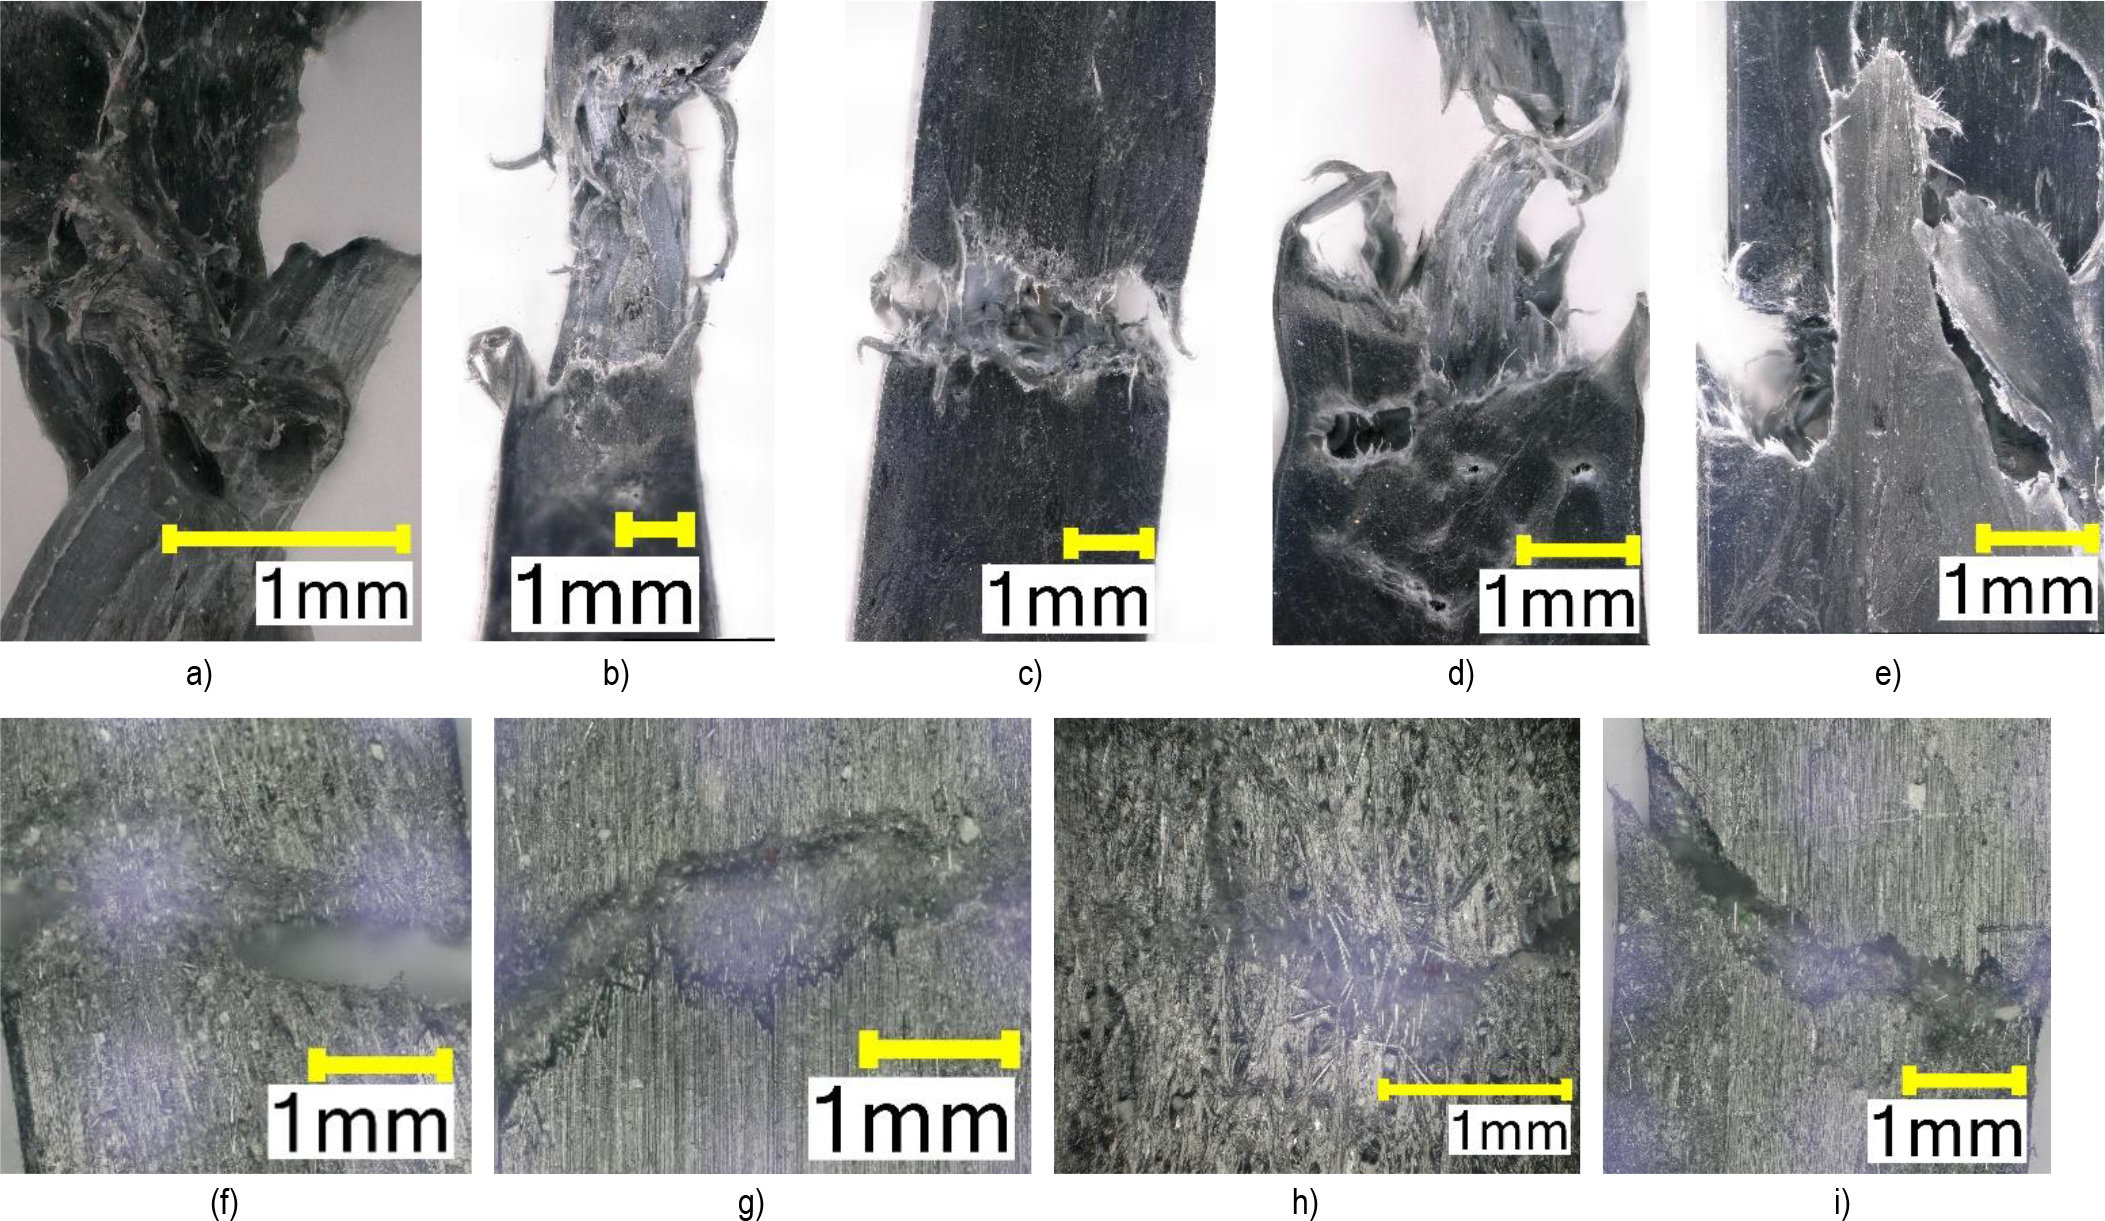
Fig. 11.
Failure locations of specimens after the tensile test: a) rHDPE; b) B40; c) B60; d) B80; e) B100; f) A40; g) A60; h) A80; i) A100
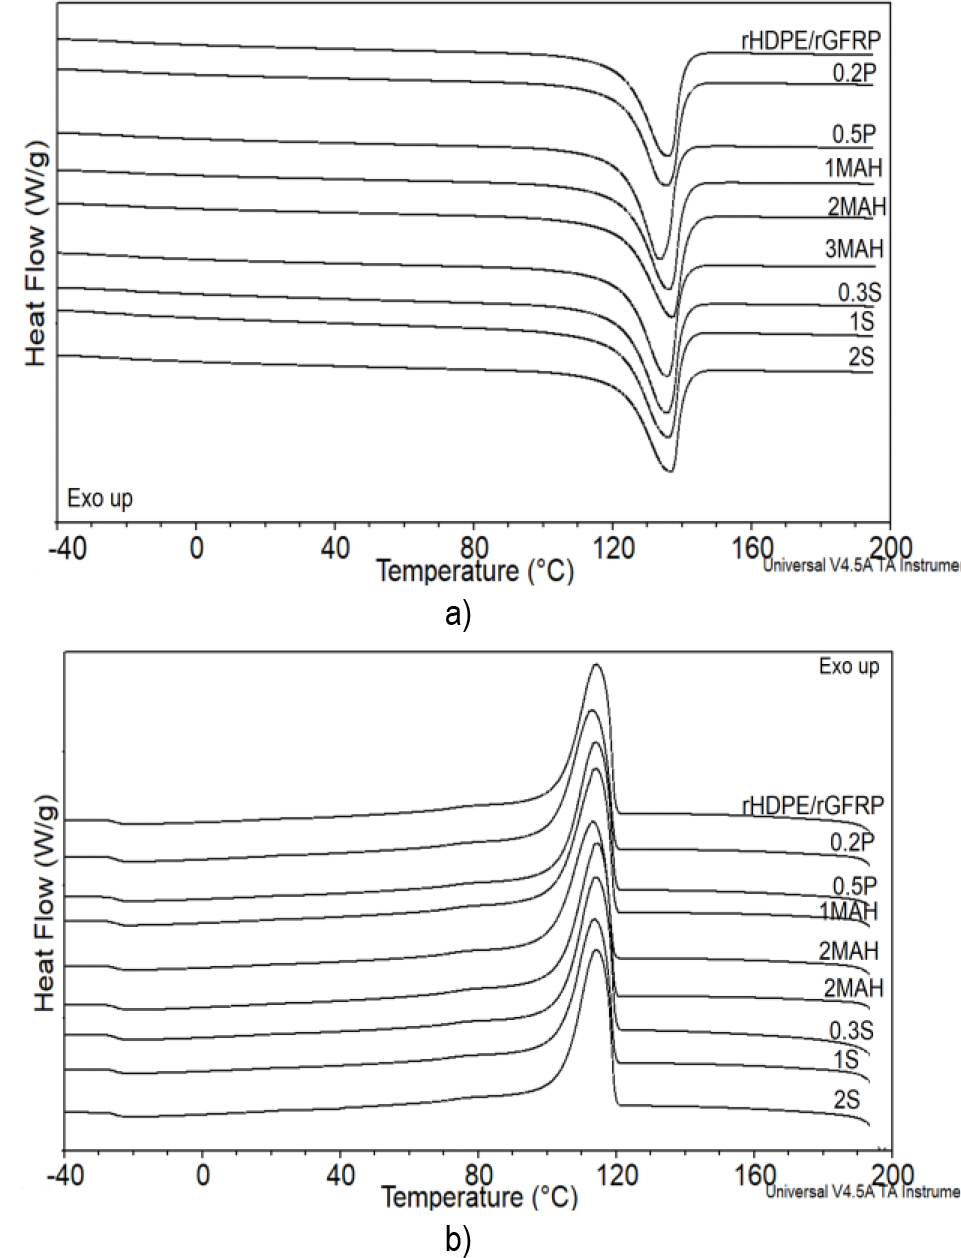
Fig. 12.
a)2nd heating curves and b) cooling curve for analyzing composites before irradiation test
Tab. 3.
DSC parameters determined for the rHDPE/rGFRP modified with various additives
| Sample name | Tm,°C | Tc,°C | Xc,% |
|---|---|---|---|
| rHDPE/rGFRP | 136 | 114 | 61.1 |
| 0.2P | 135 | 114 | 61.0 |
| 0.5P | 137 | 113 | 62.2 |
| 1MAH | 136 | 114 | 63.3 |
| 2MAH | 137 | 113 | 62.4 |
| 3MAH | 135 | 115 | 68.3 |
| 0.3S | 136 | 114 | 63.9 |
| 1S | 136 | 114 | 64.0 |
| 2S | 136 | 114 | 61.4 |
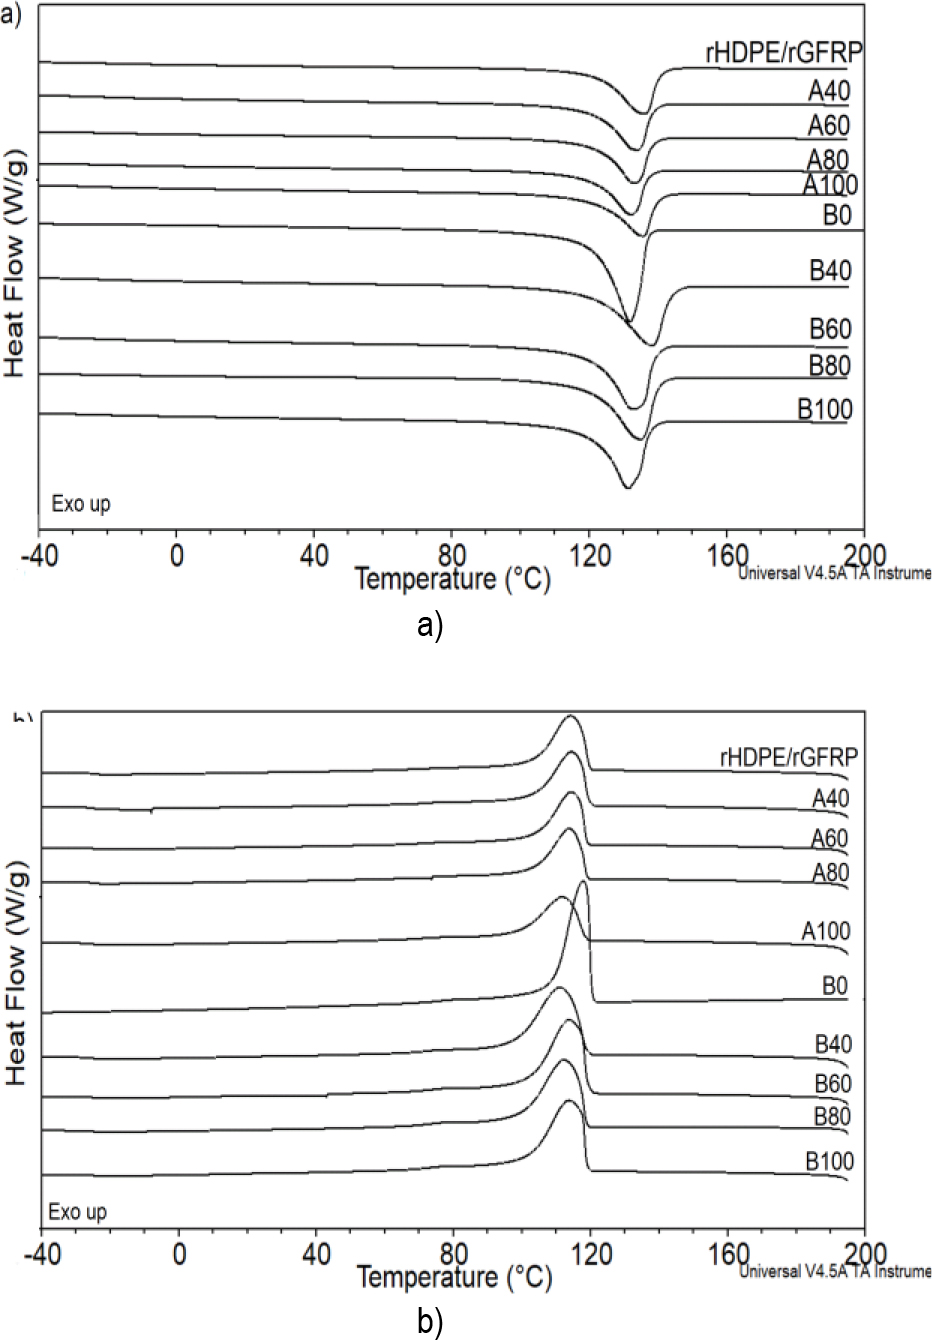
Fig. 13.
a) 2nd heating curves and b) cooling curve for analyzing composites after irradiation test