
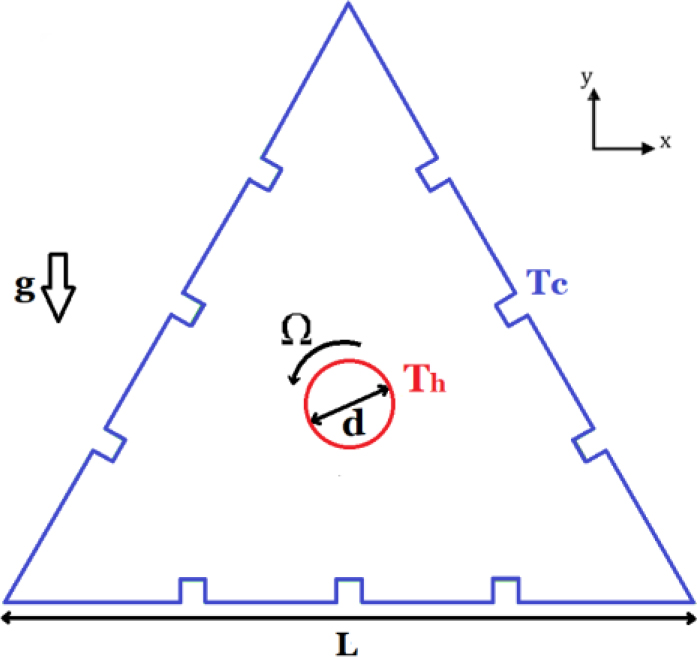
Fig. 1.
Diagrammatic representation of the problem
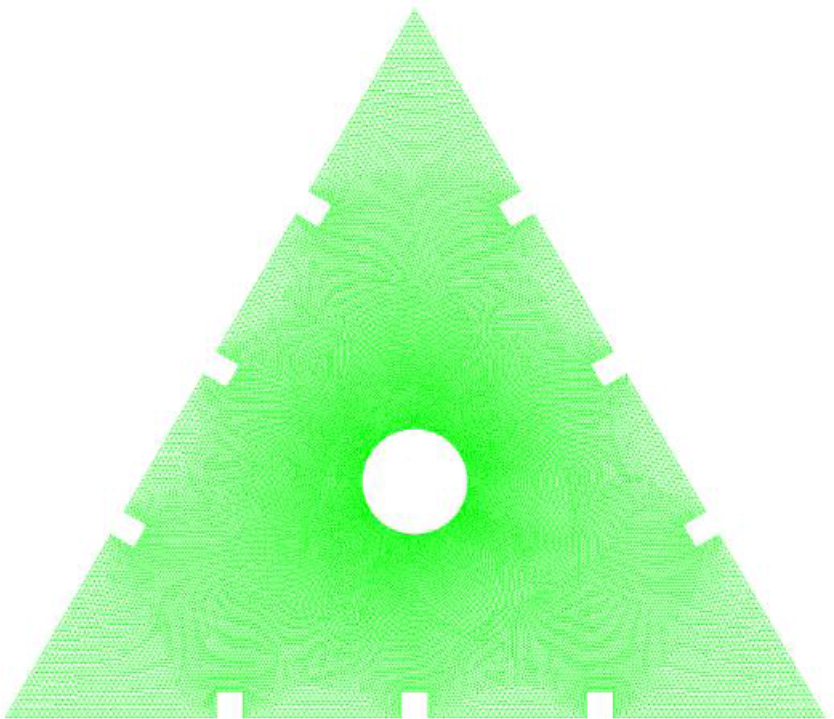
Fig. 2.
The structure of the grid used for the calculations
Tab. 1.
Grid independency test for n = 1.6, Re = 10, Ri = 2 and β = 0.12
| Mesh | Elements | Nu | Difference % | CPU Seconds |
|---|---|---|---|---|
| M1 | 130,000 | 3.41930 | 1.478 | 622 |
| M2 | 260,000 | 3.36876 | 0.011 | 1021 |
| M3 | 520,000 | 3.36913 | - | - |
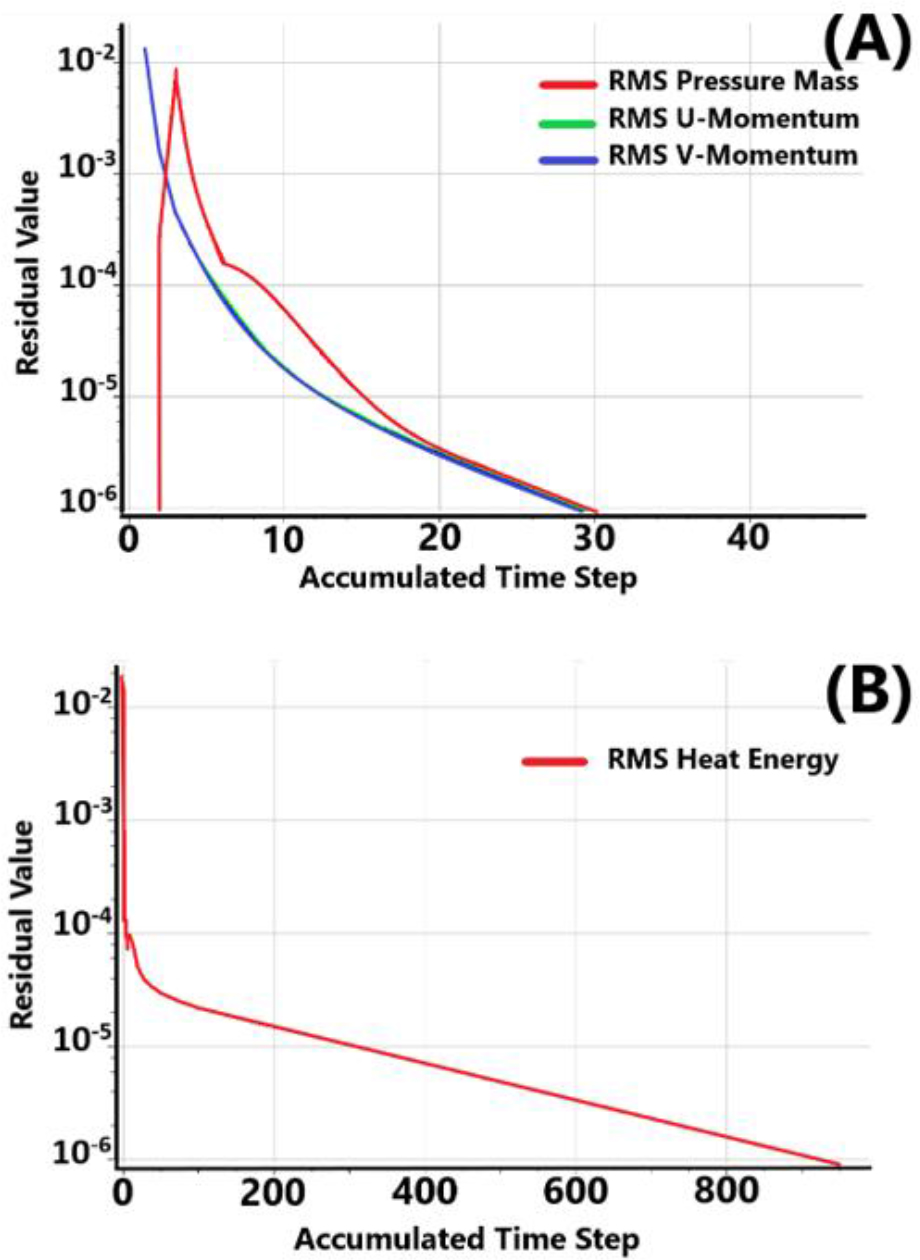
Fig. 3.
Residual Convergence for Re = 5, Ri = 0, n = 0.6 and β = 0.12
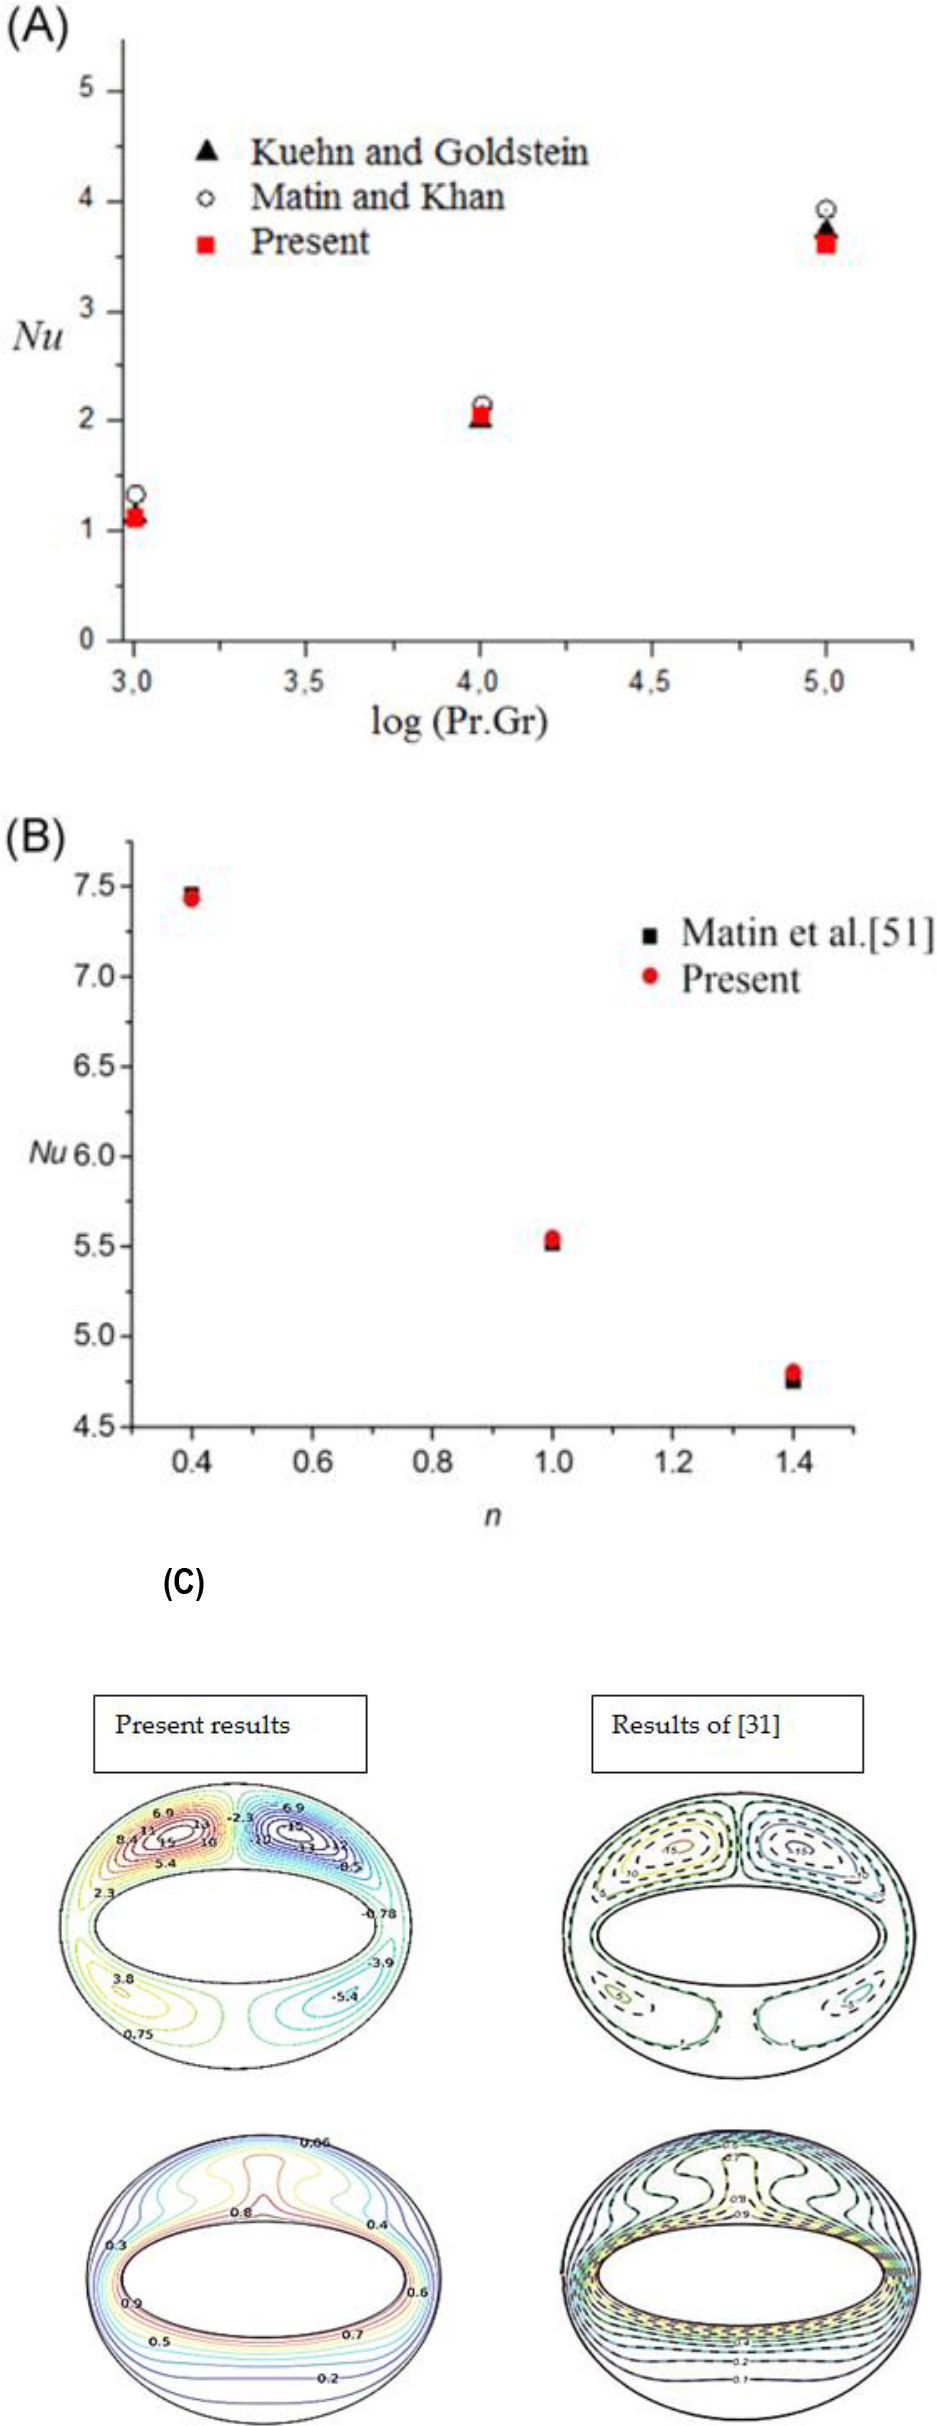
Fig. 4.
Validation tests
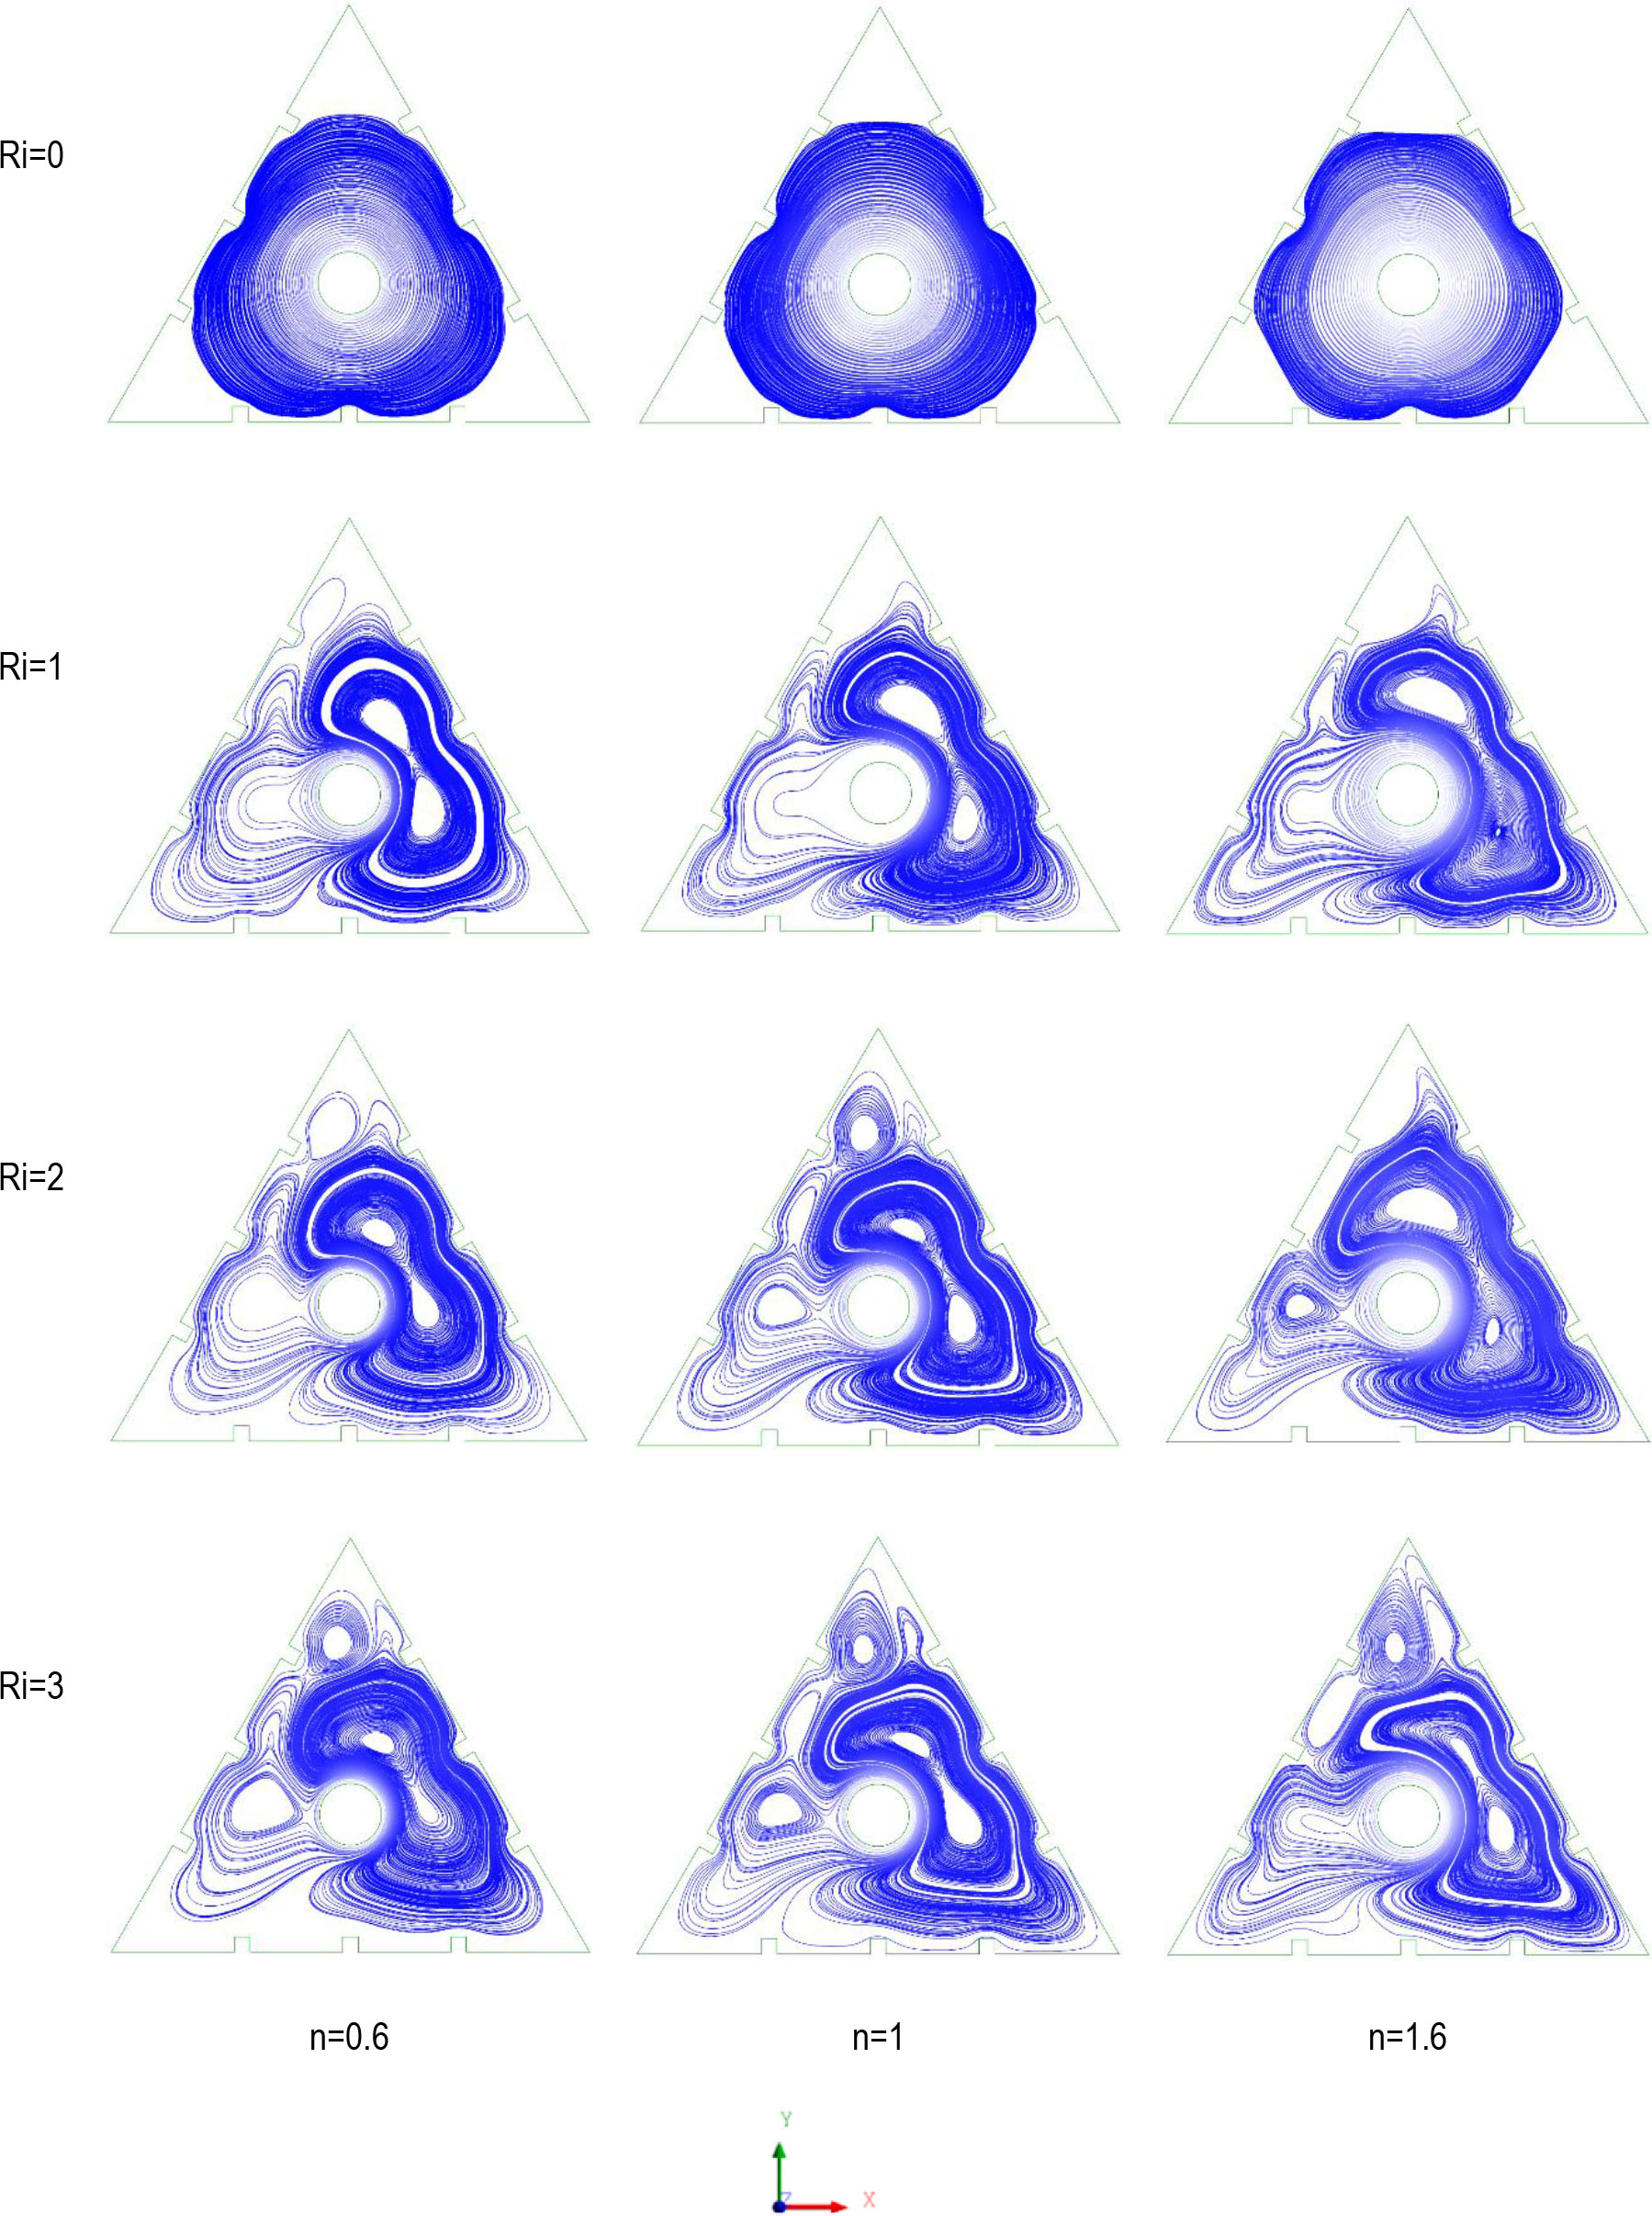
Fig. 5.
Streamlines for the case of blockage ratio of 0.12 at Re = 5
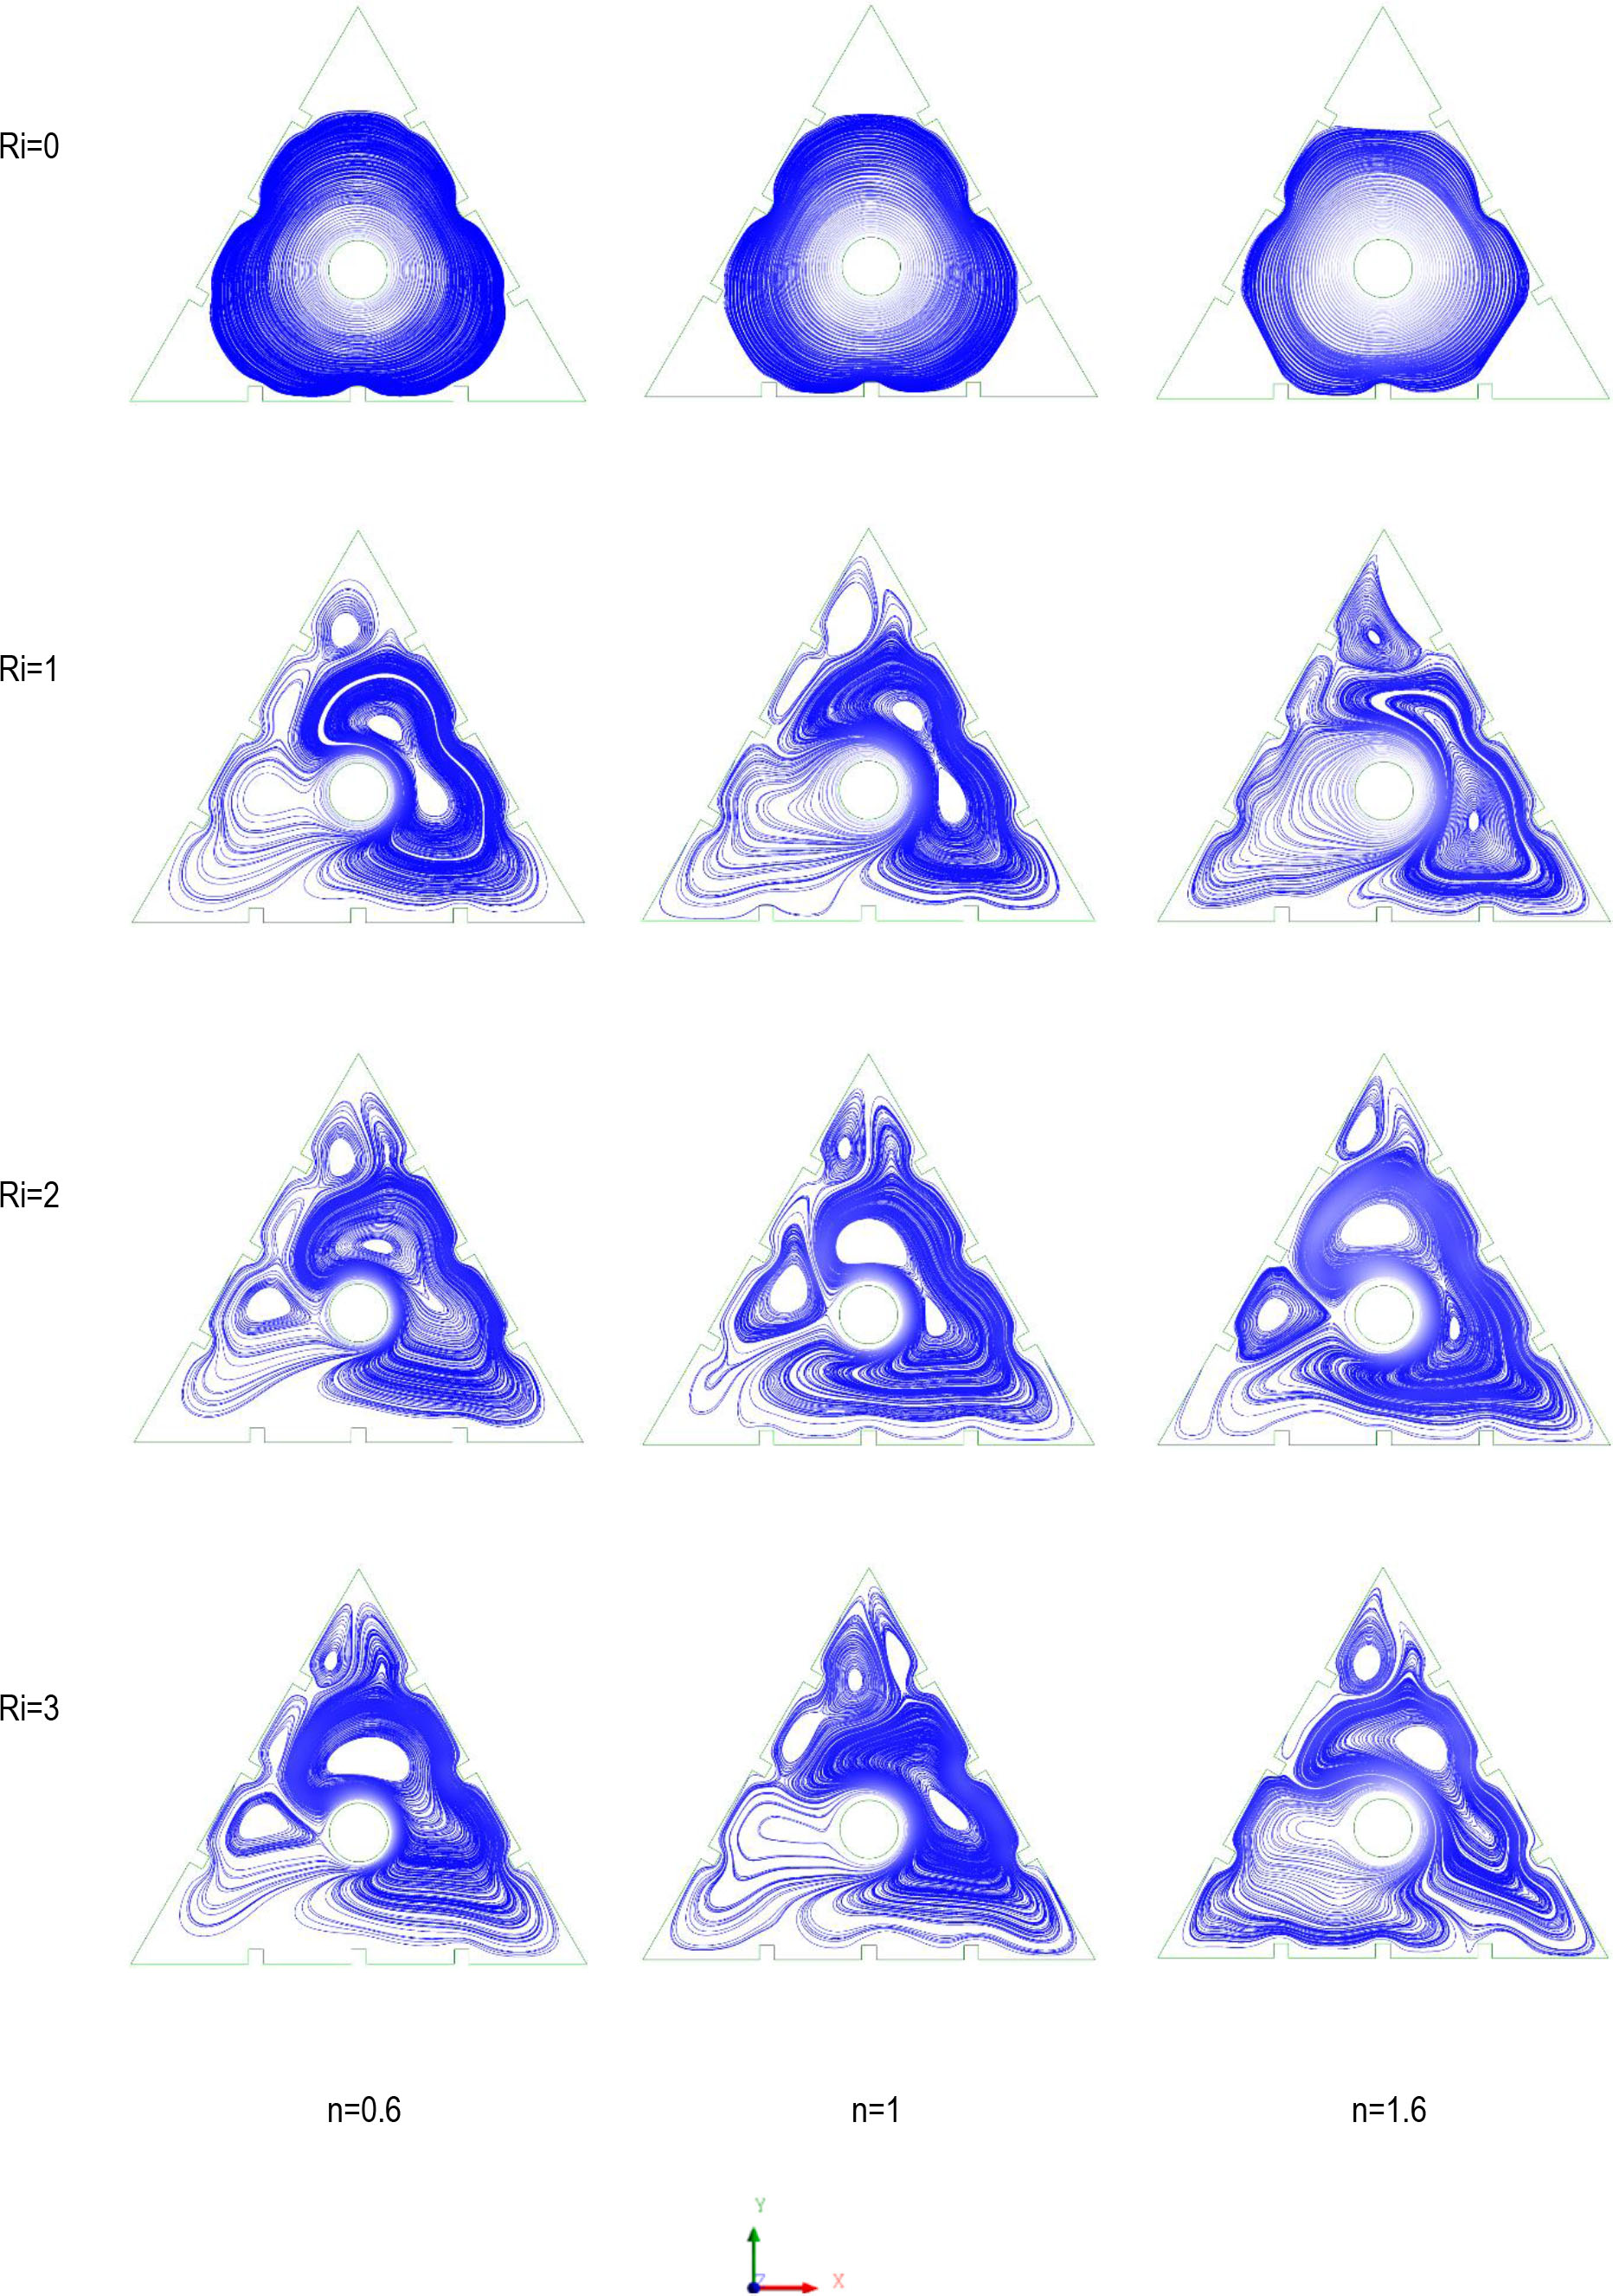
Fig. 6.
Streamlines for the case of blockage ratio of 0.12 at Re = 10
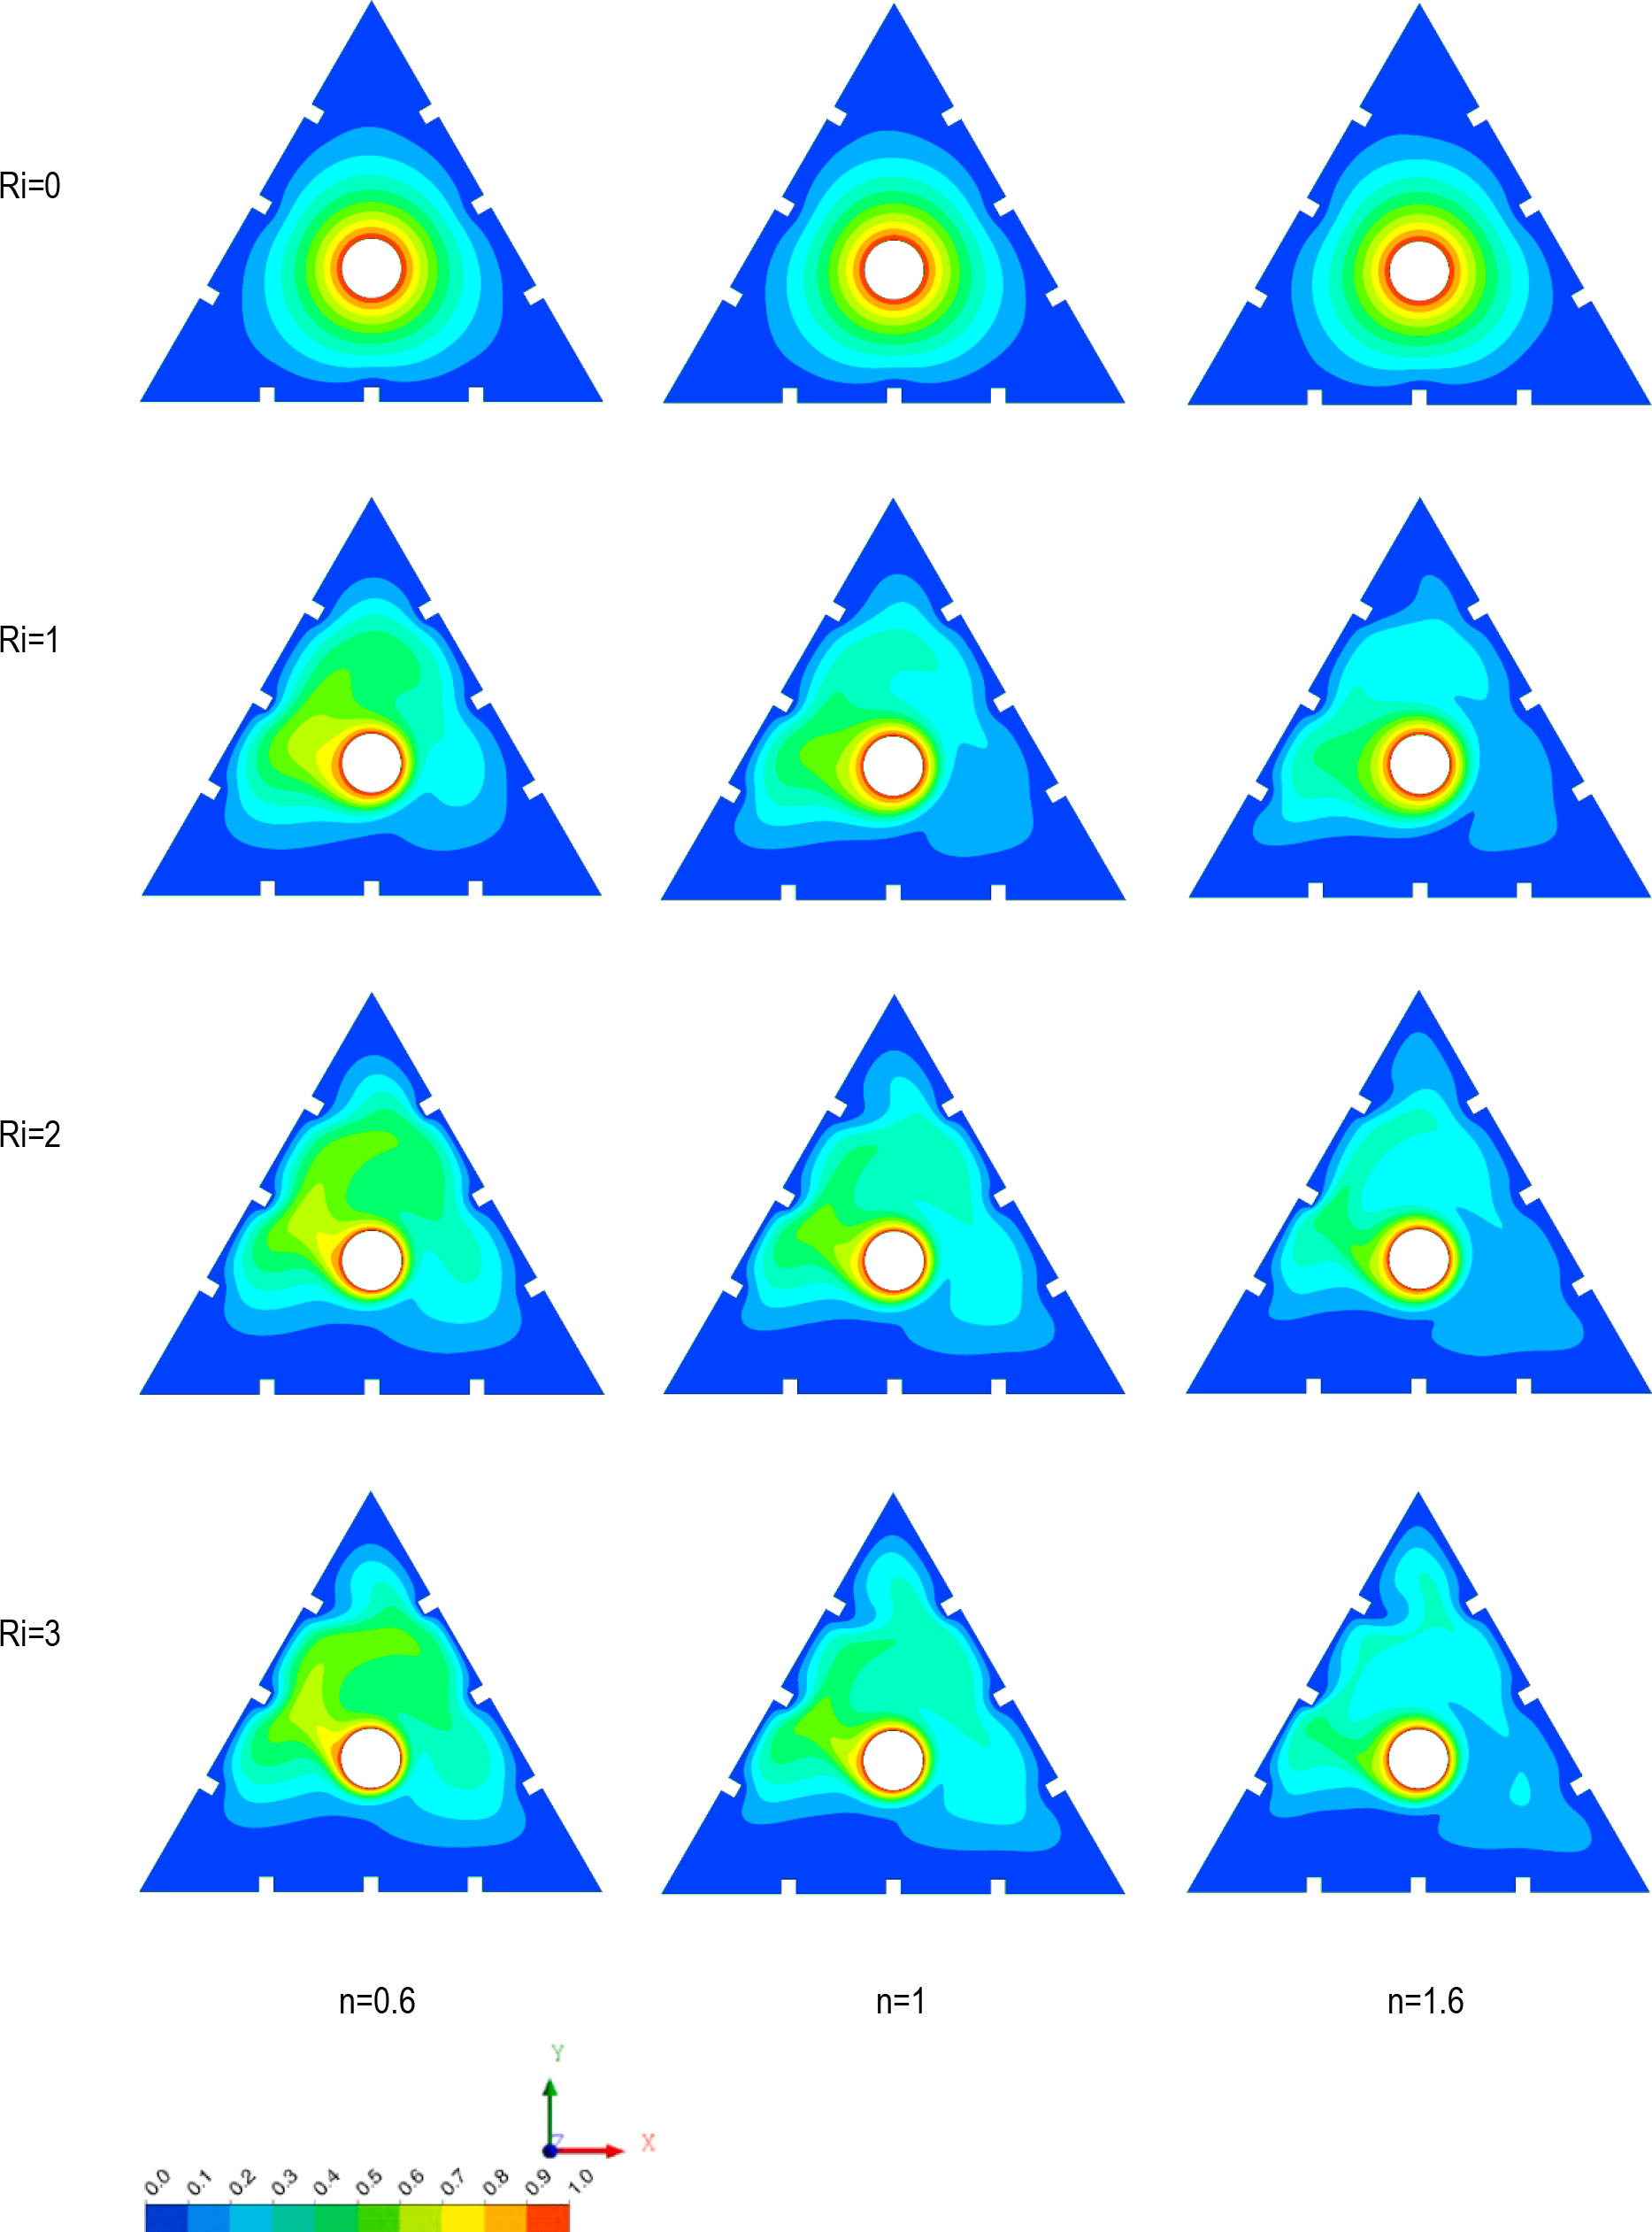
Fig. 7.
Isotherms for the case of blockage ratio of 0.12 at Re = 5
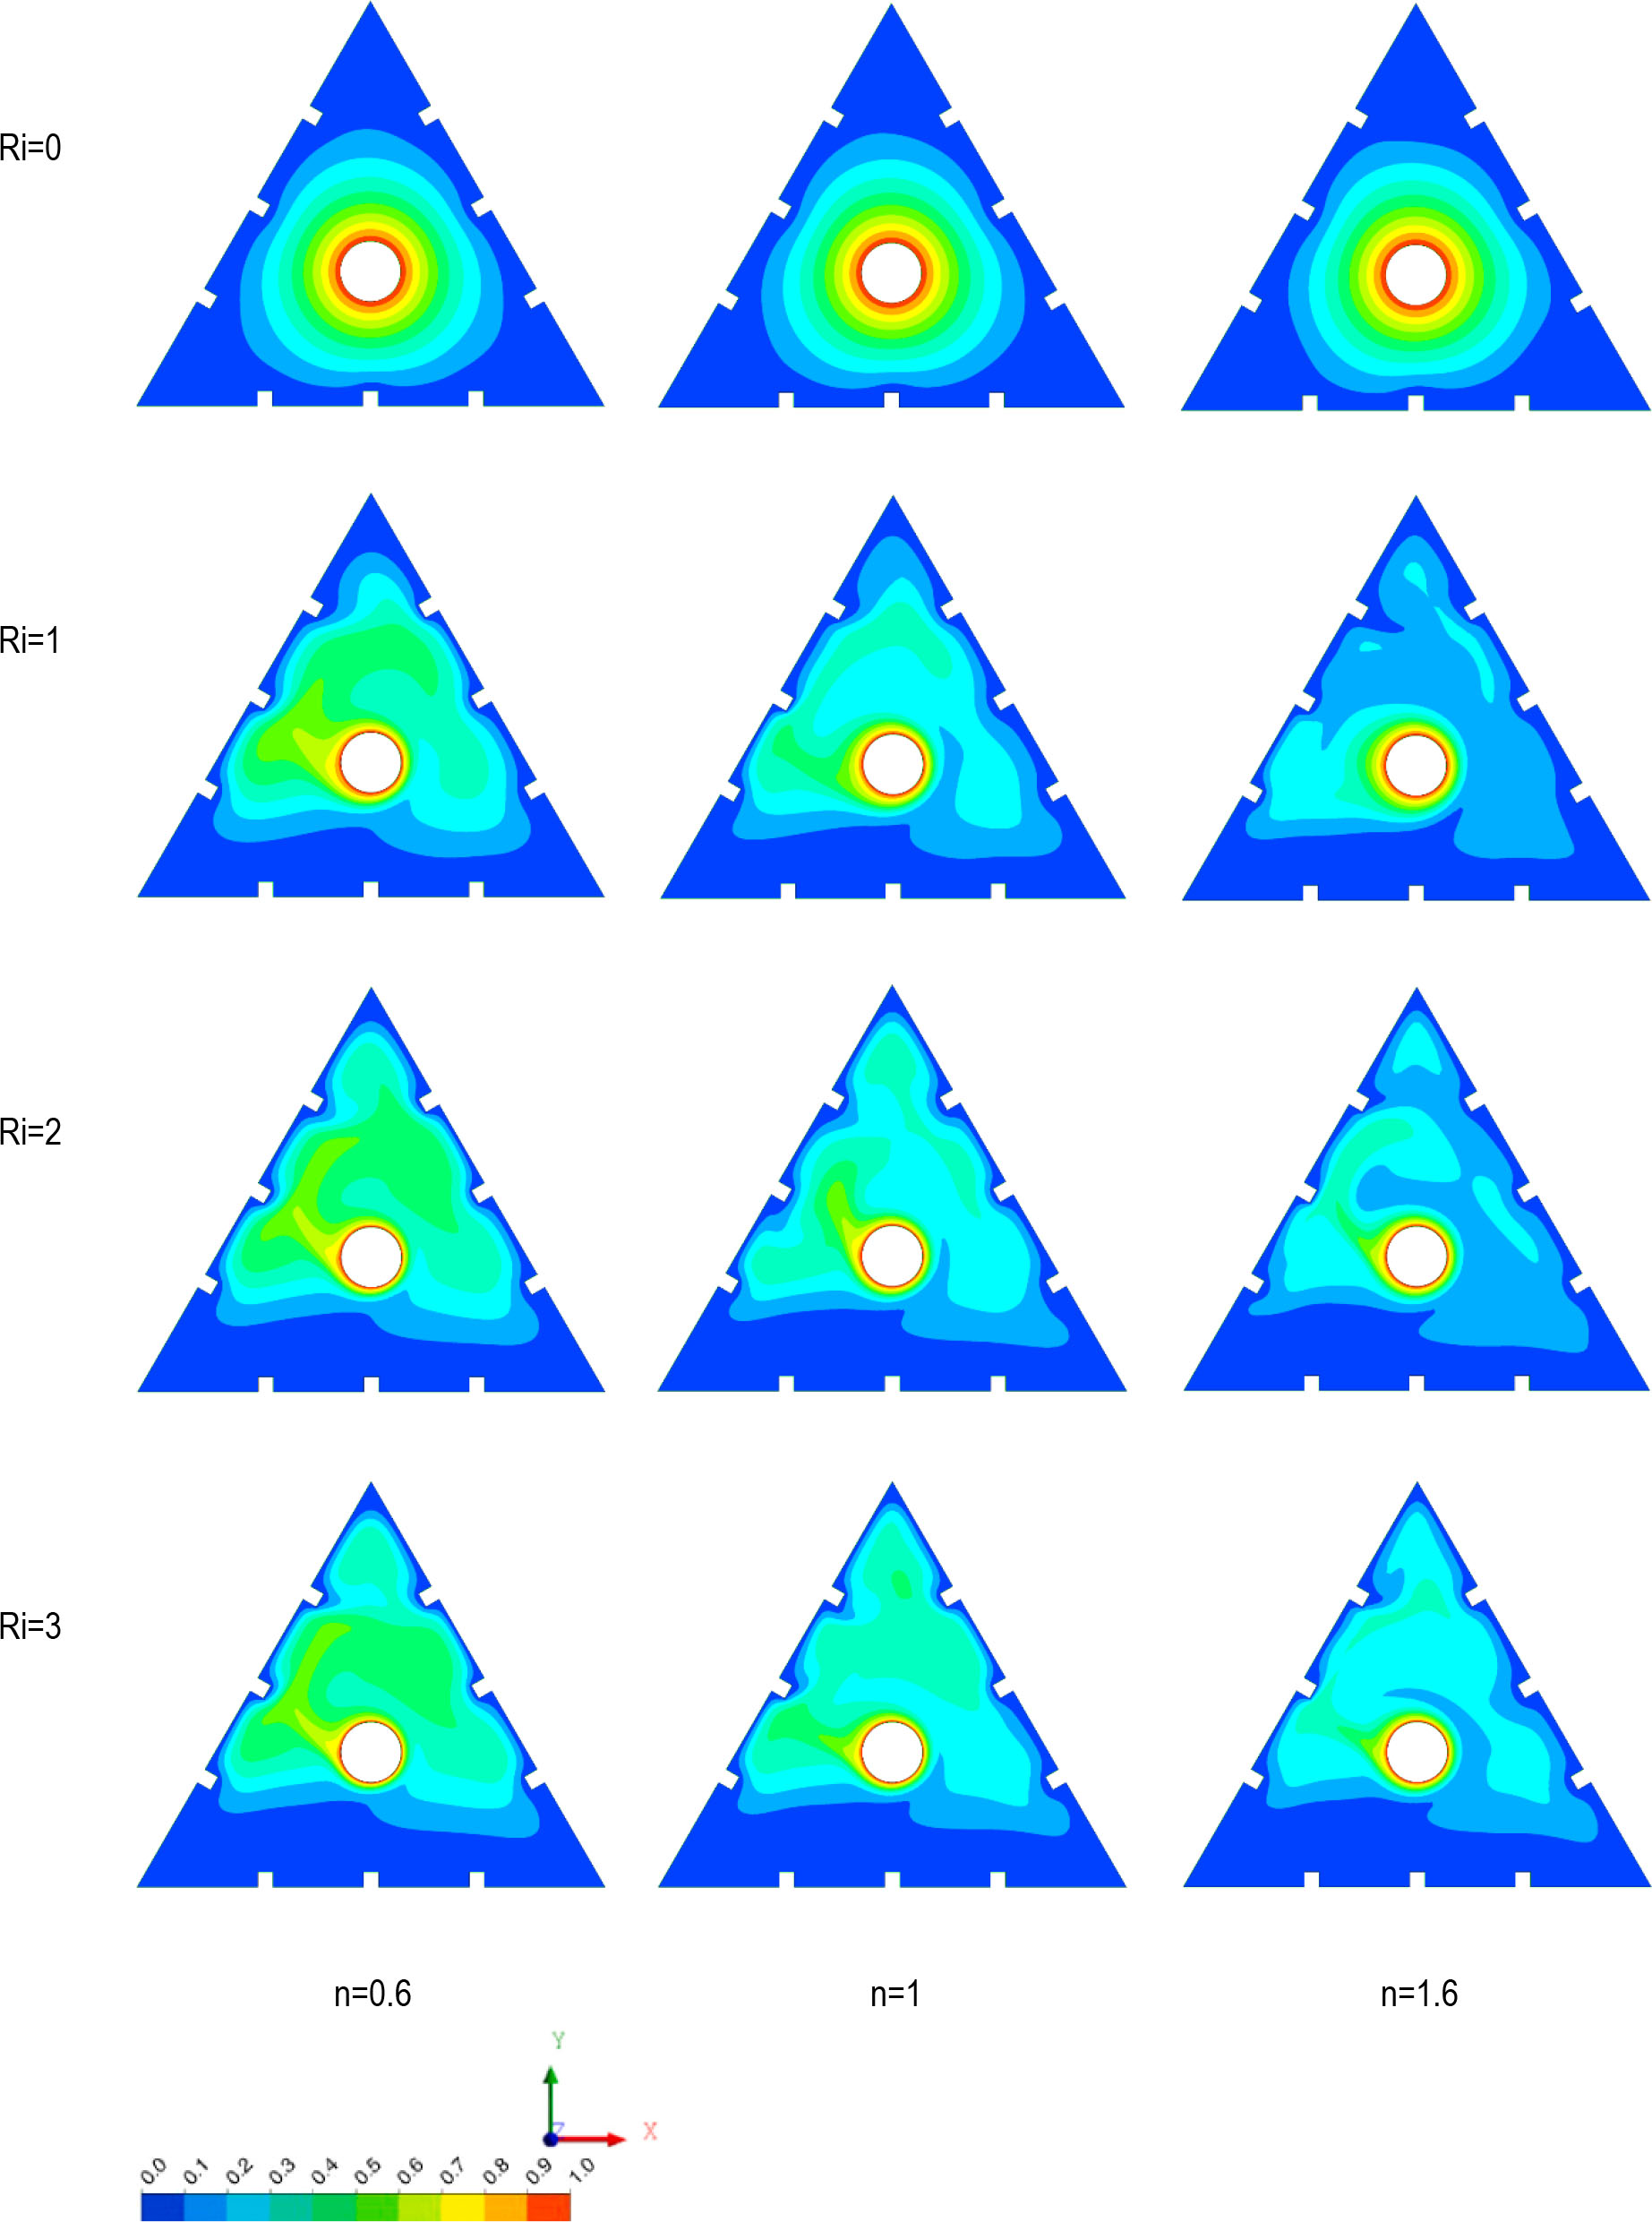
Fig. 8.
Isotherms for the case of blockage ratio of 0.12 at Re = 10
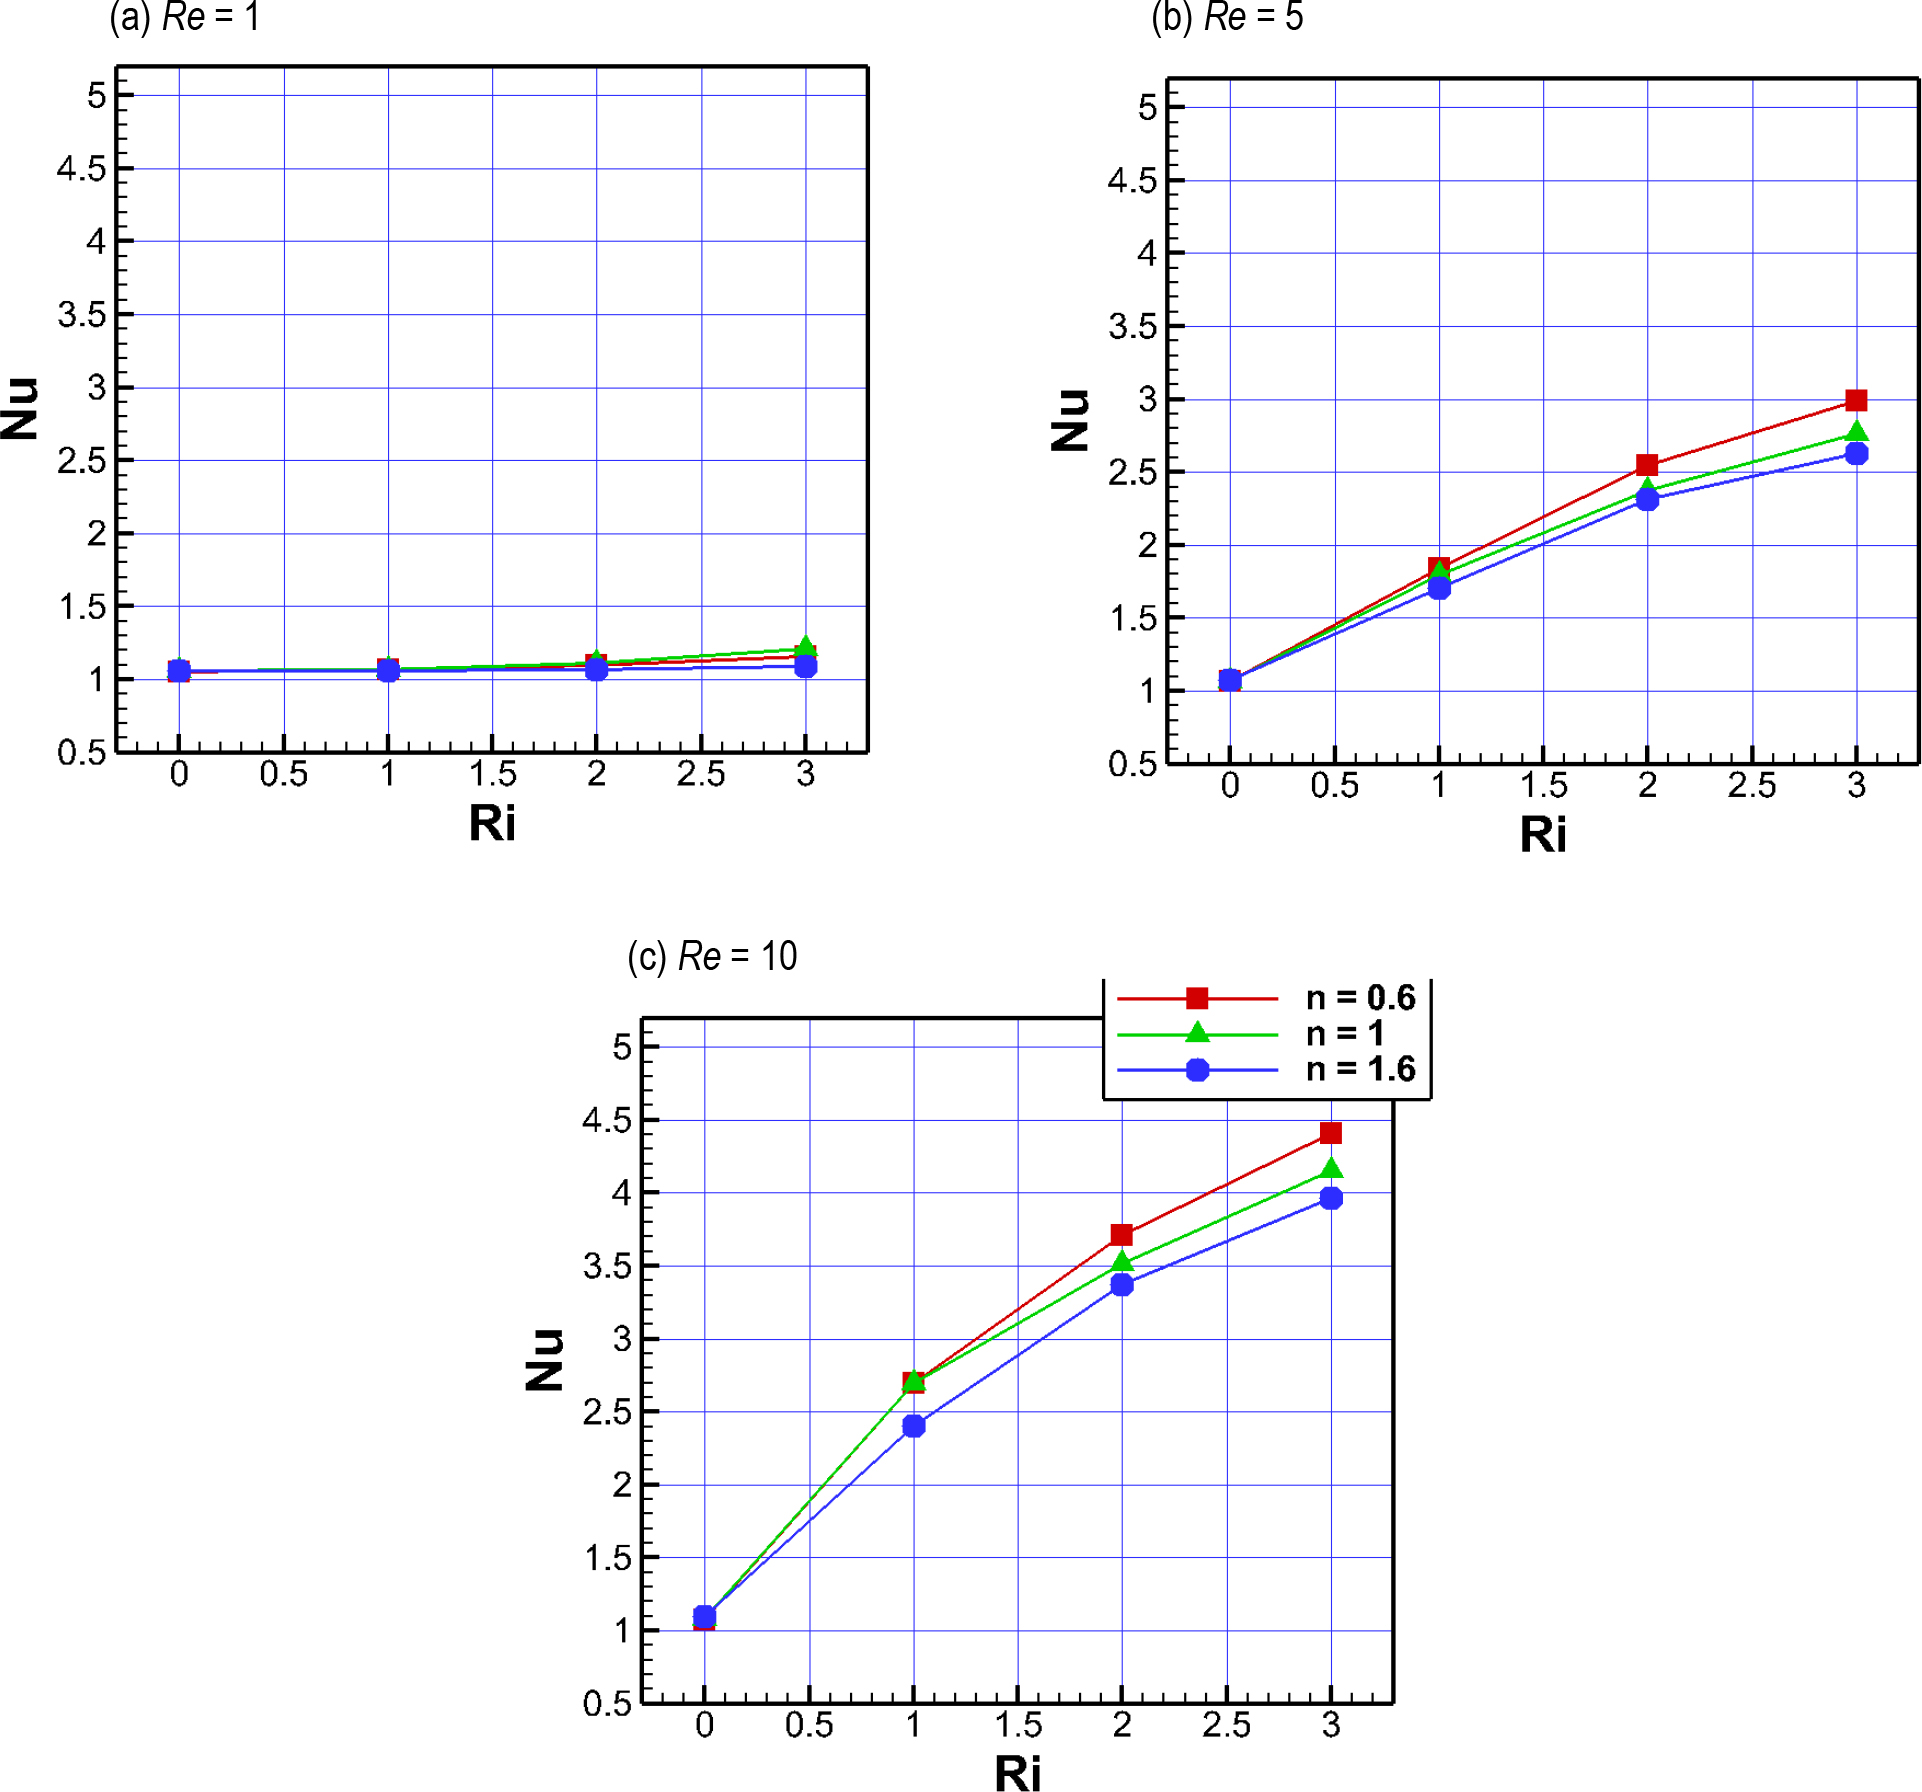
Fig. 9.
Values of Nu versus Ri and n: a) for Re = 1; b) Re = 5; and c) Re = 10
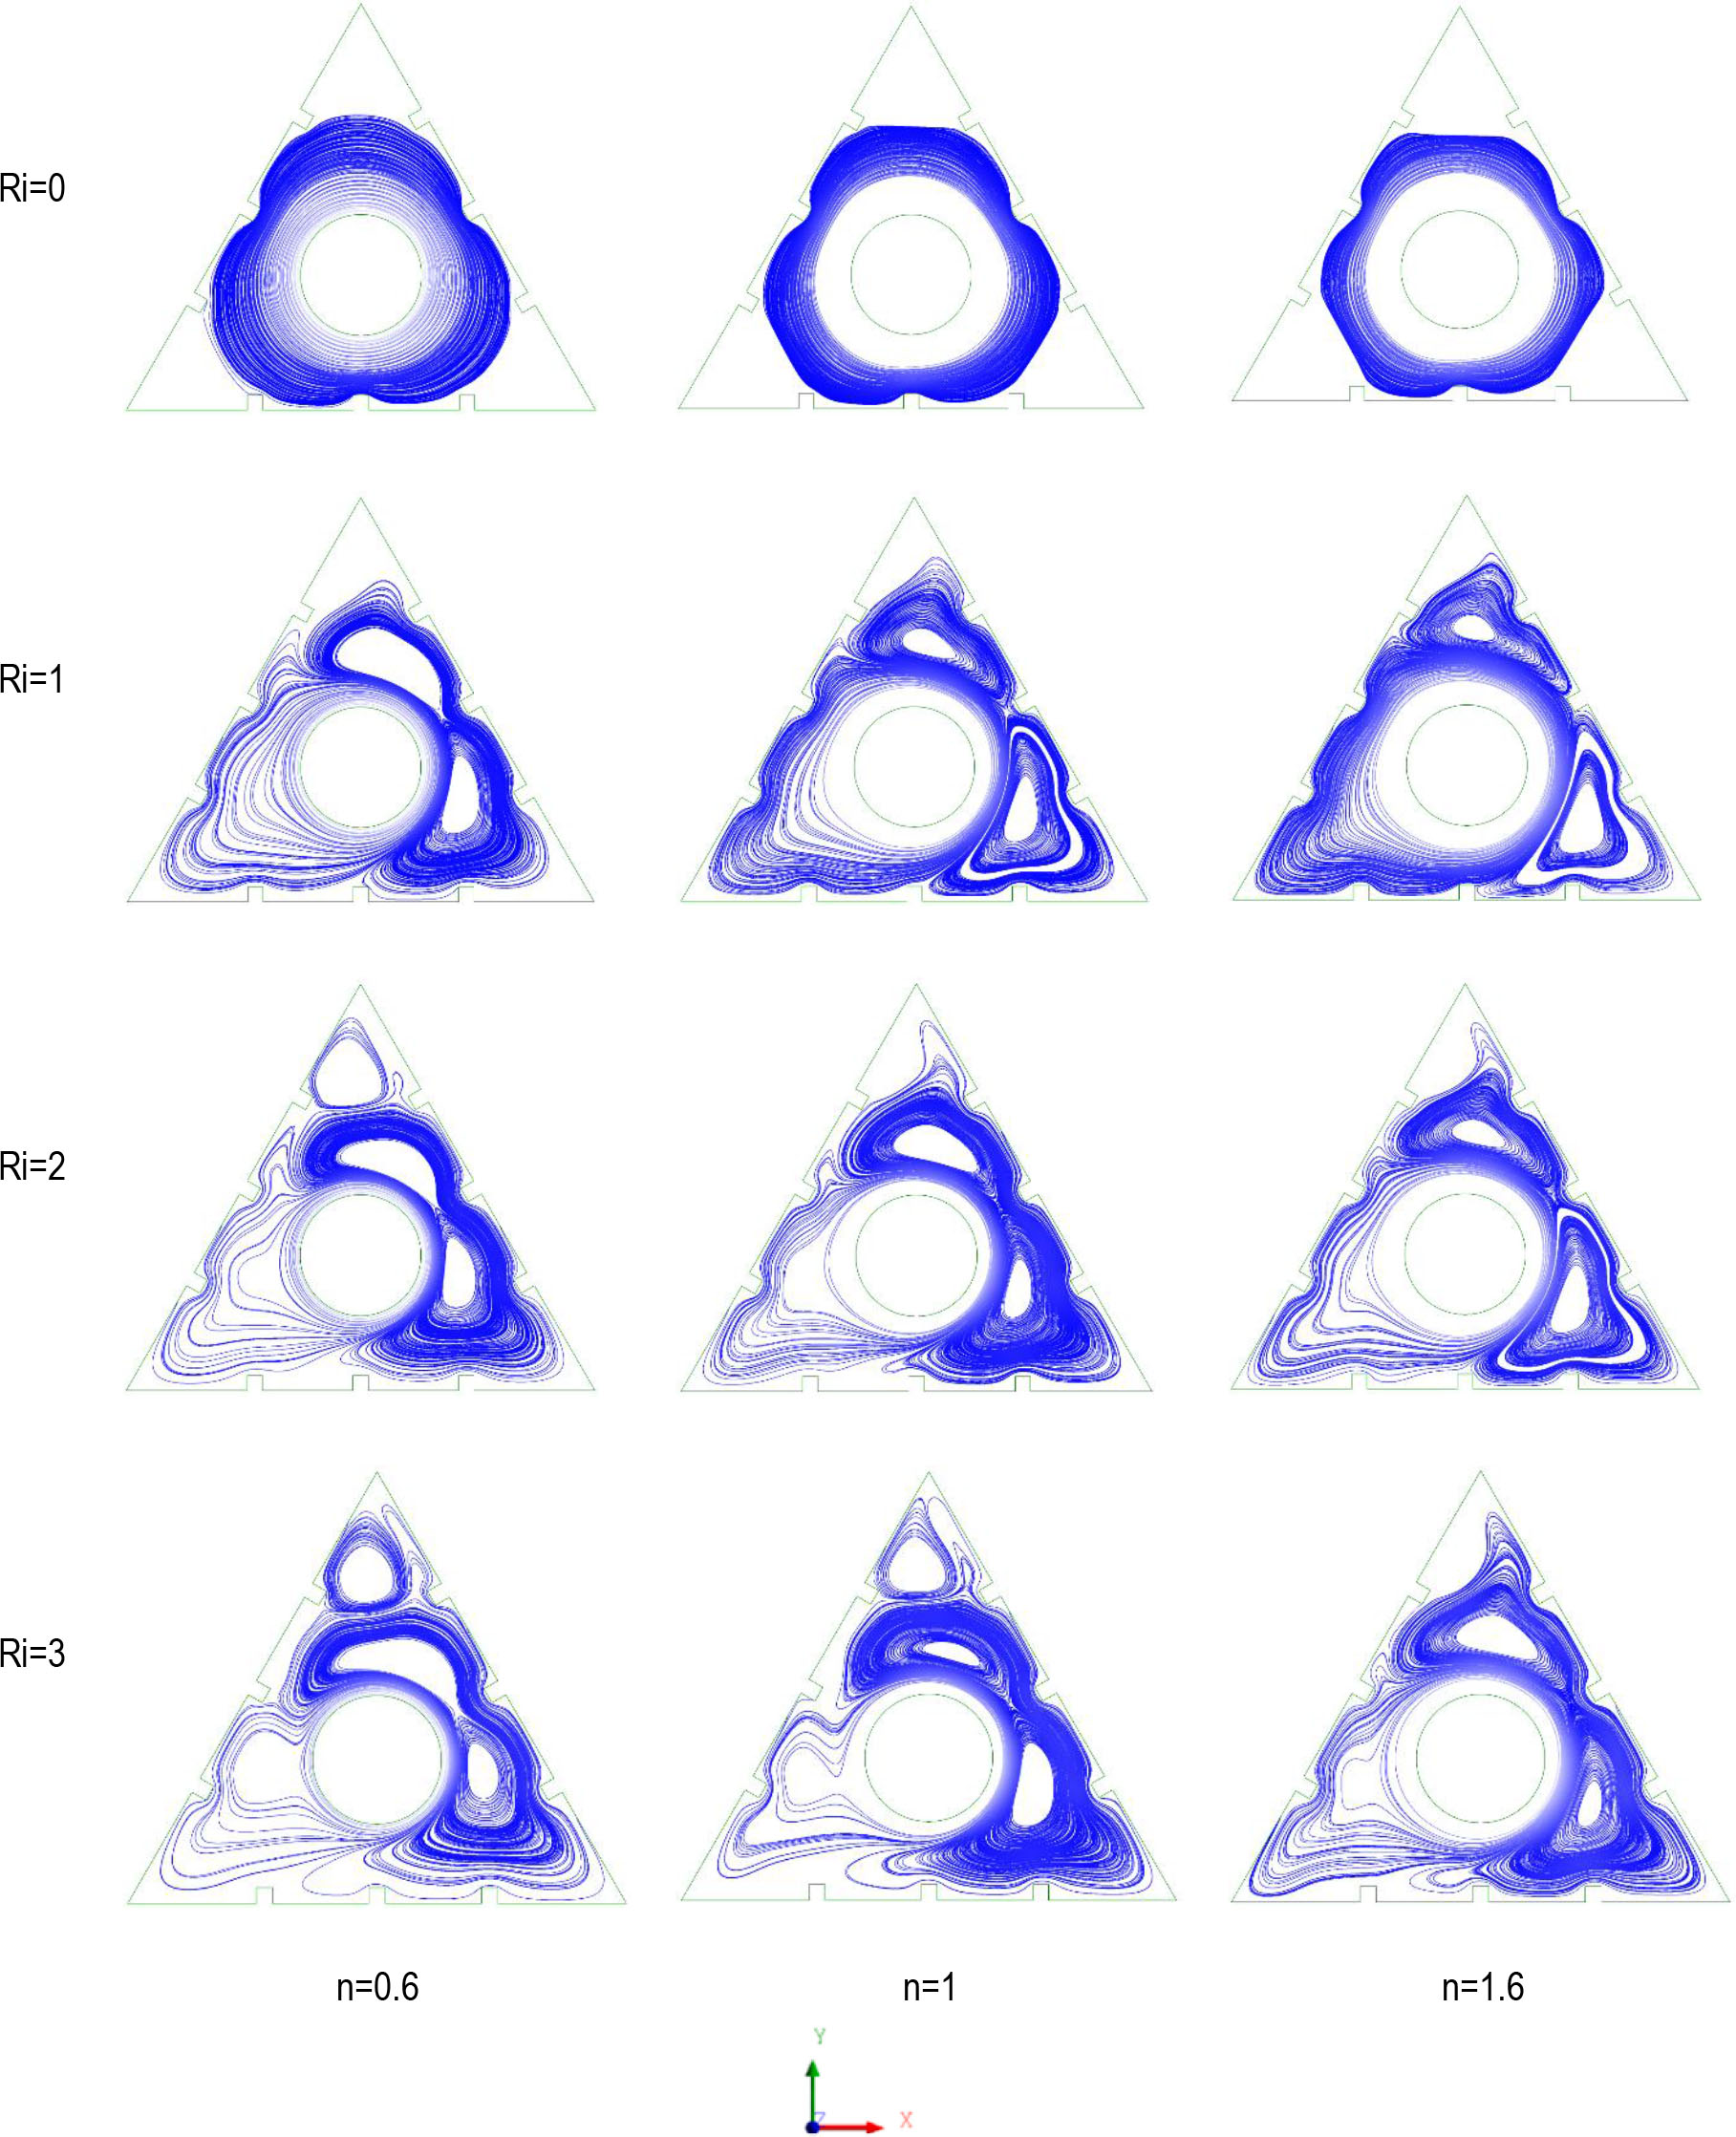
Fig. 10.
Streamlines for the case of blockage ratio of 0.24 at Re = 10
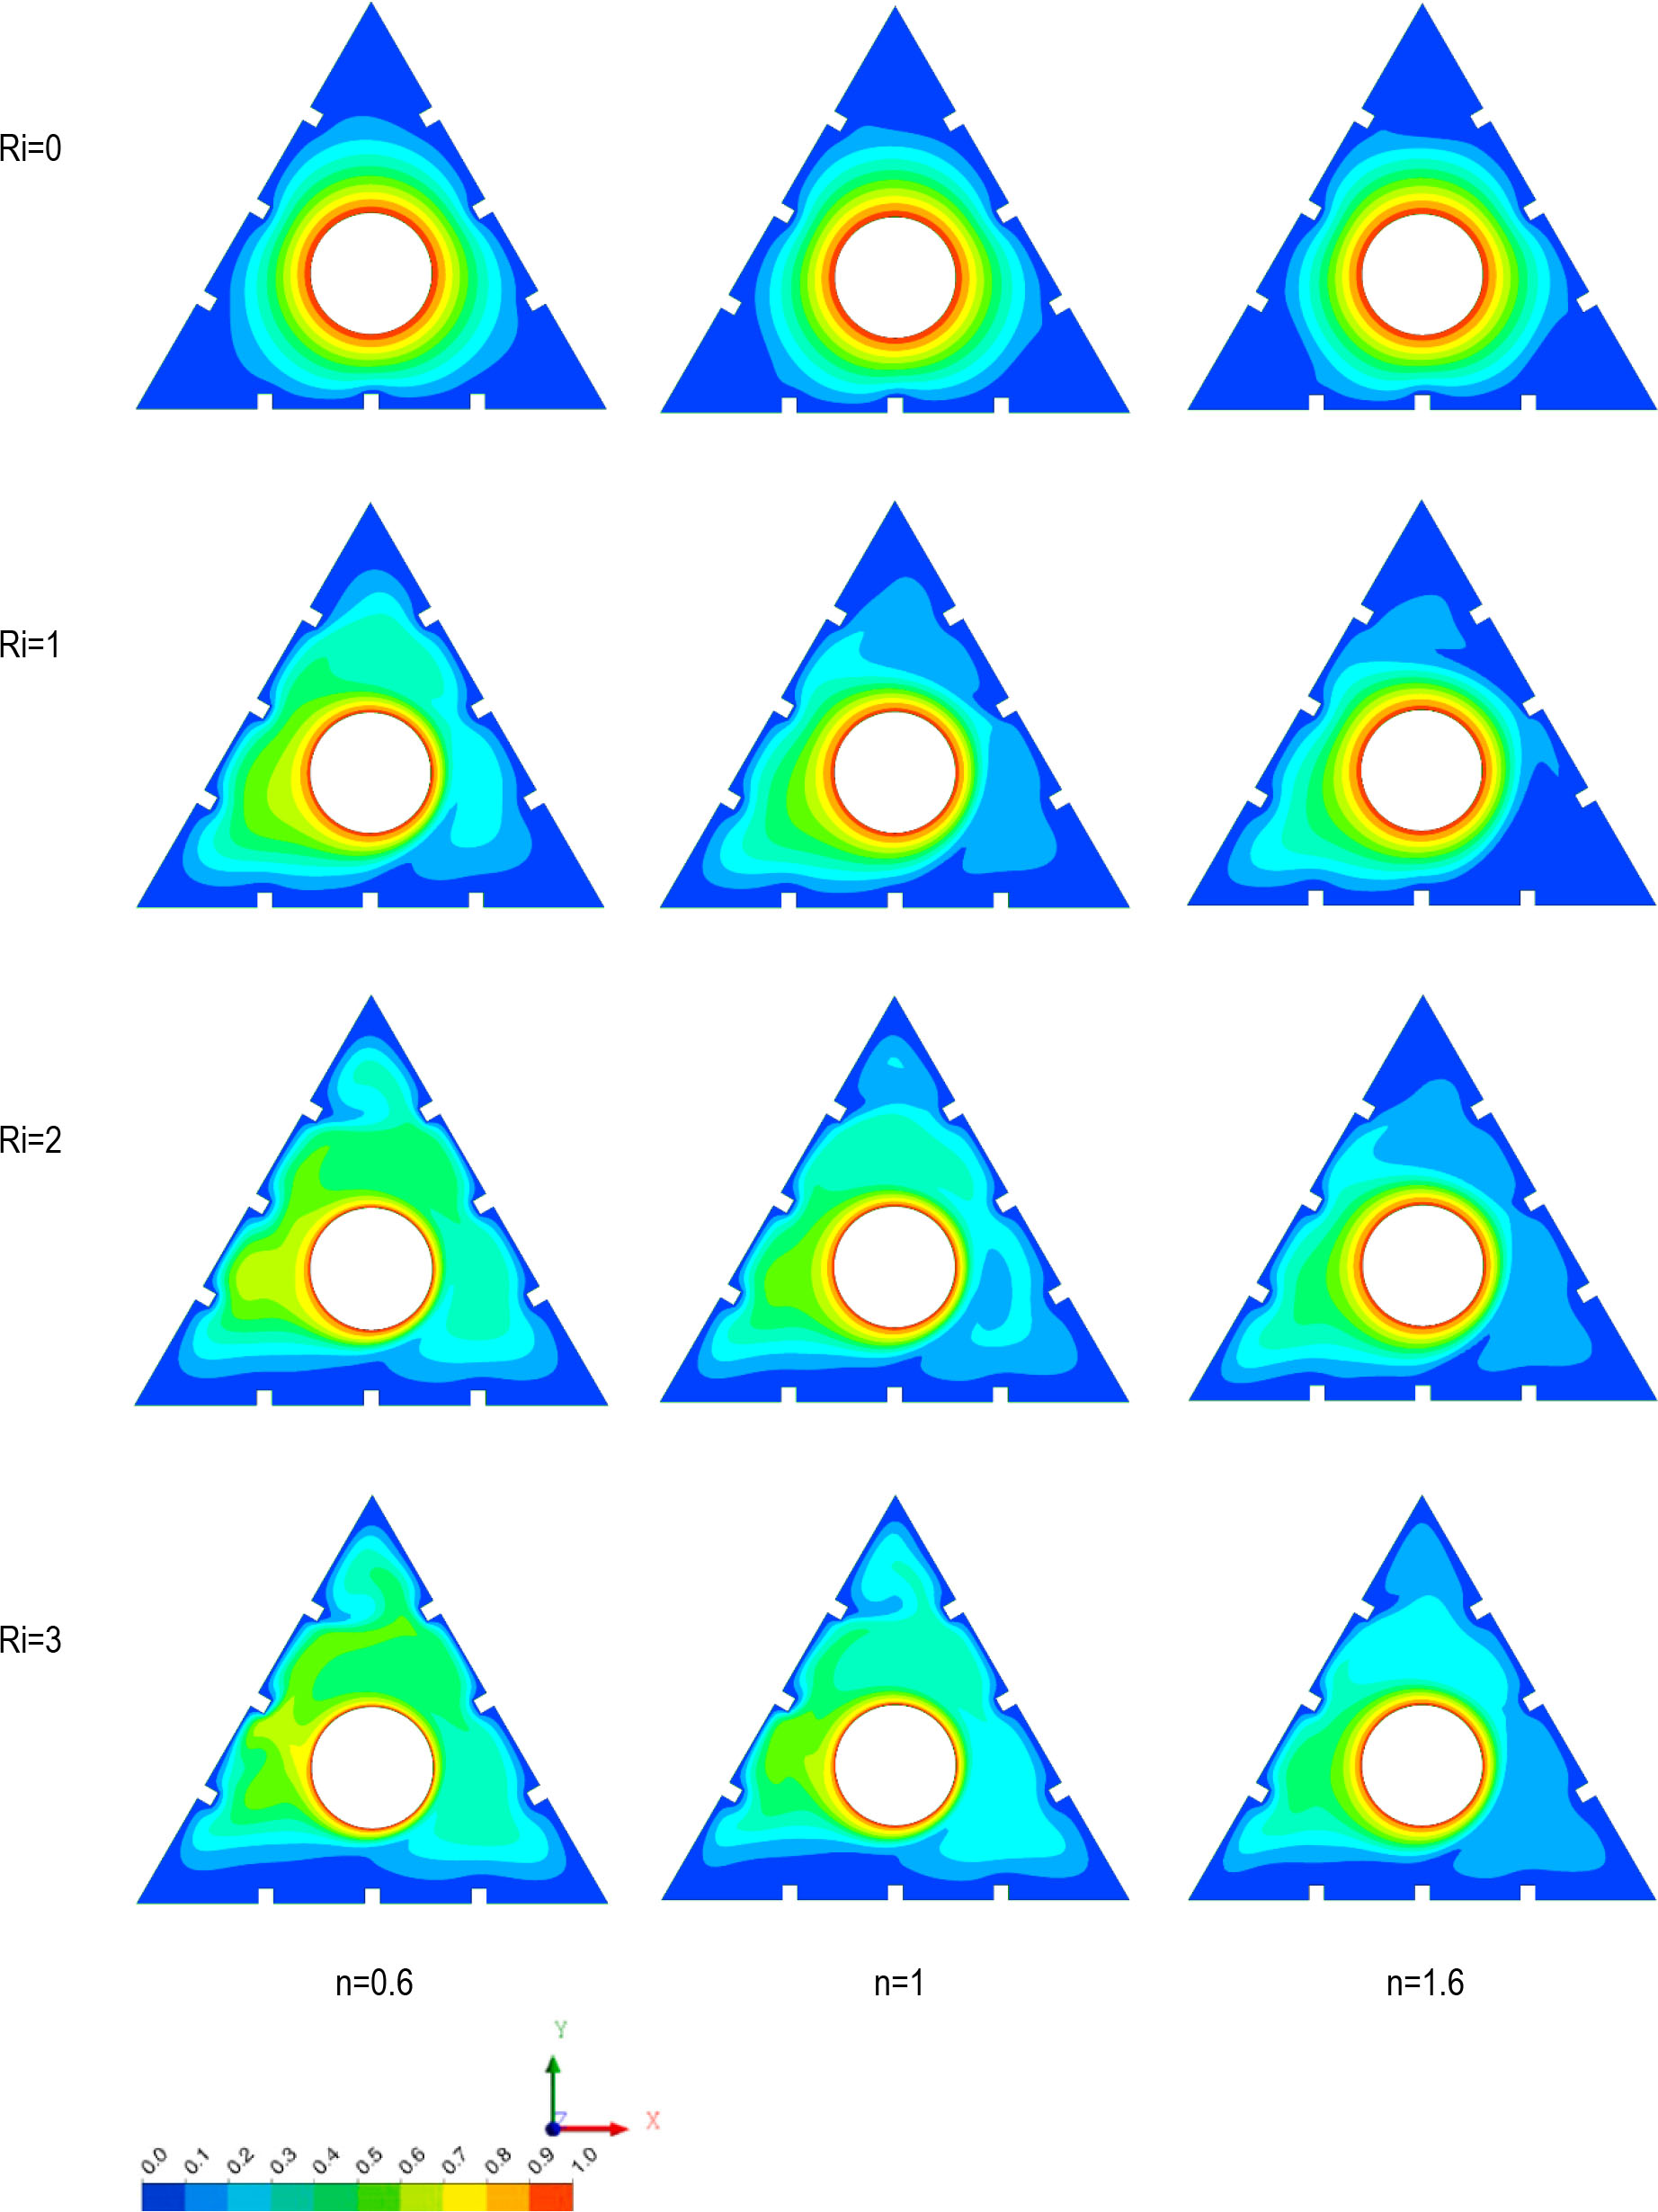
Fig. 11.
Isotherms for the case of blockage ratio of 0.24 at Re = 10
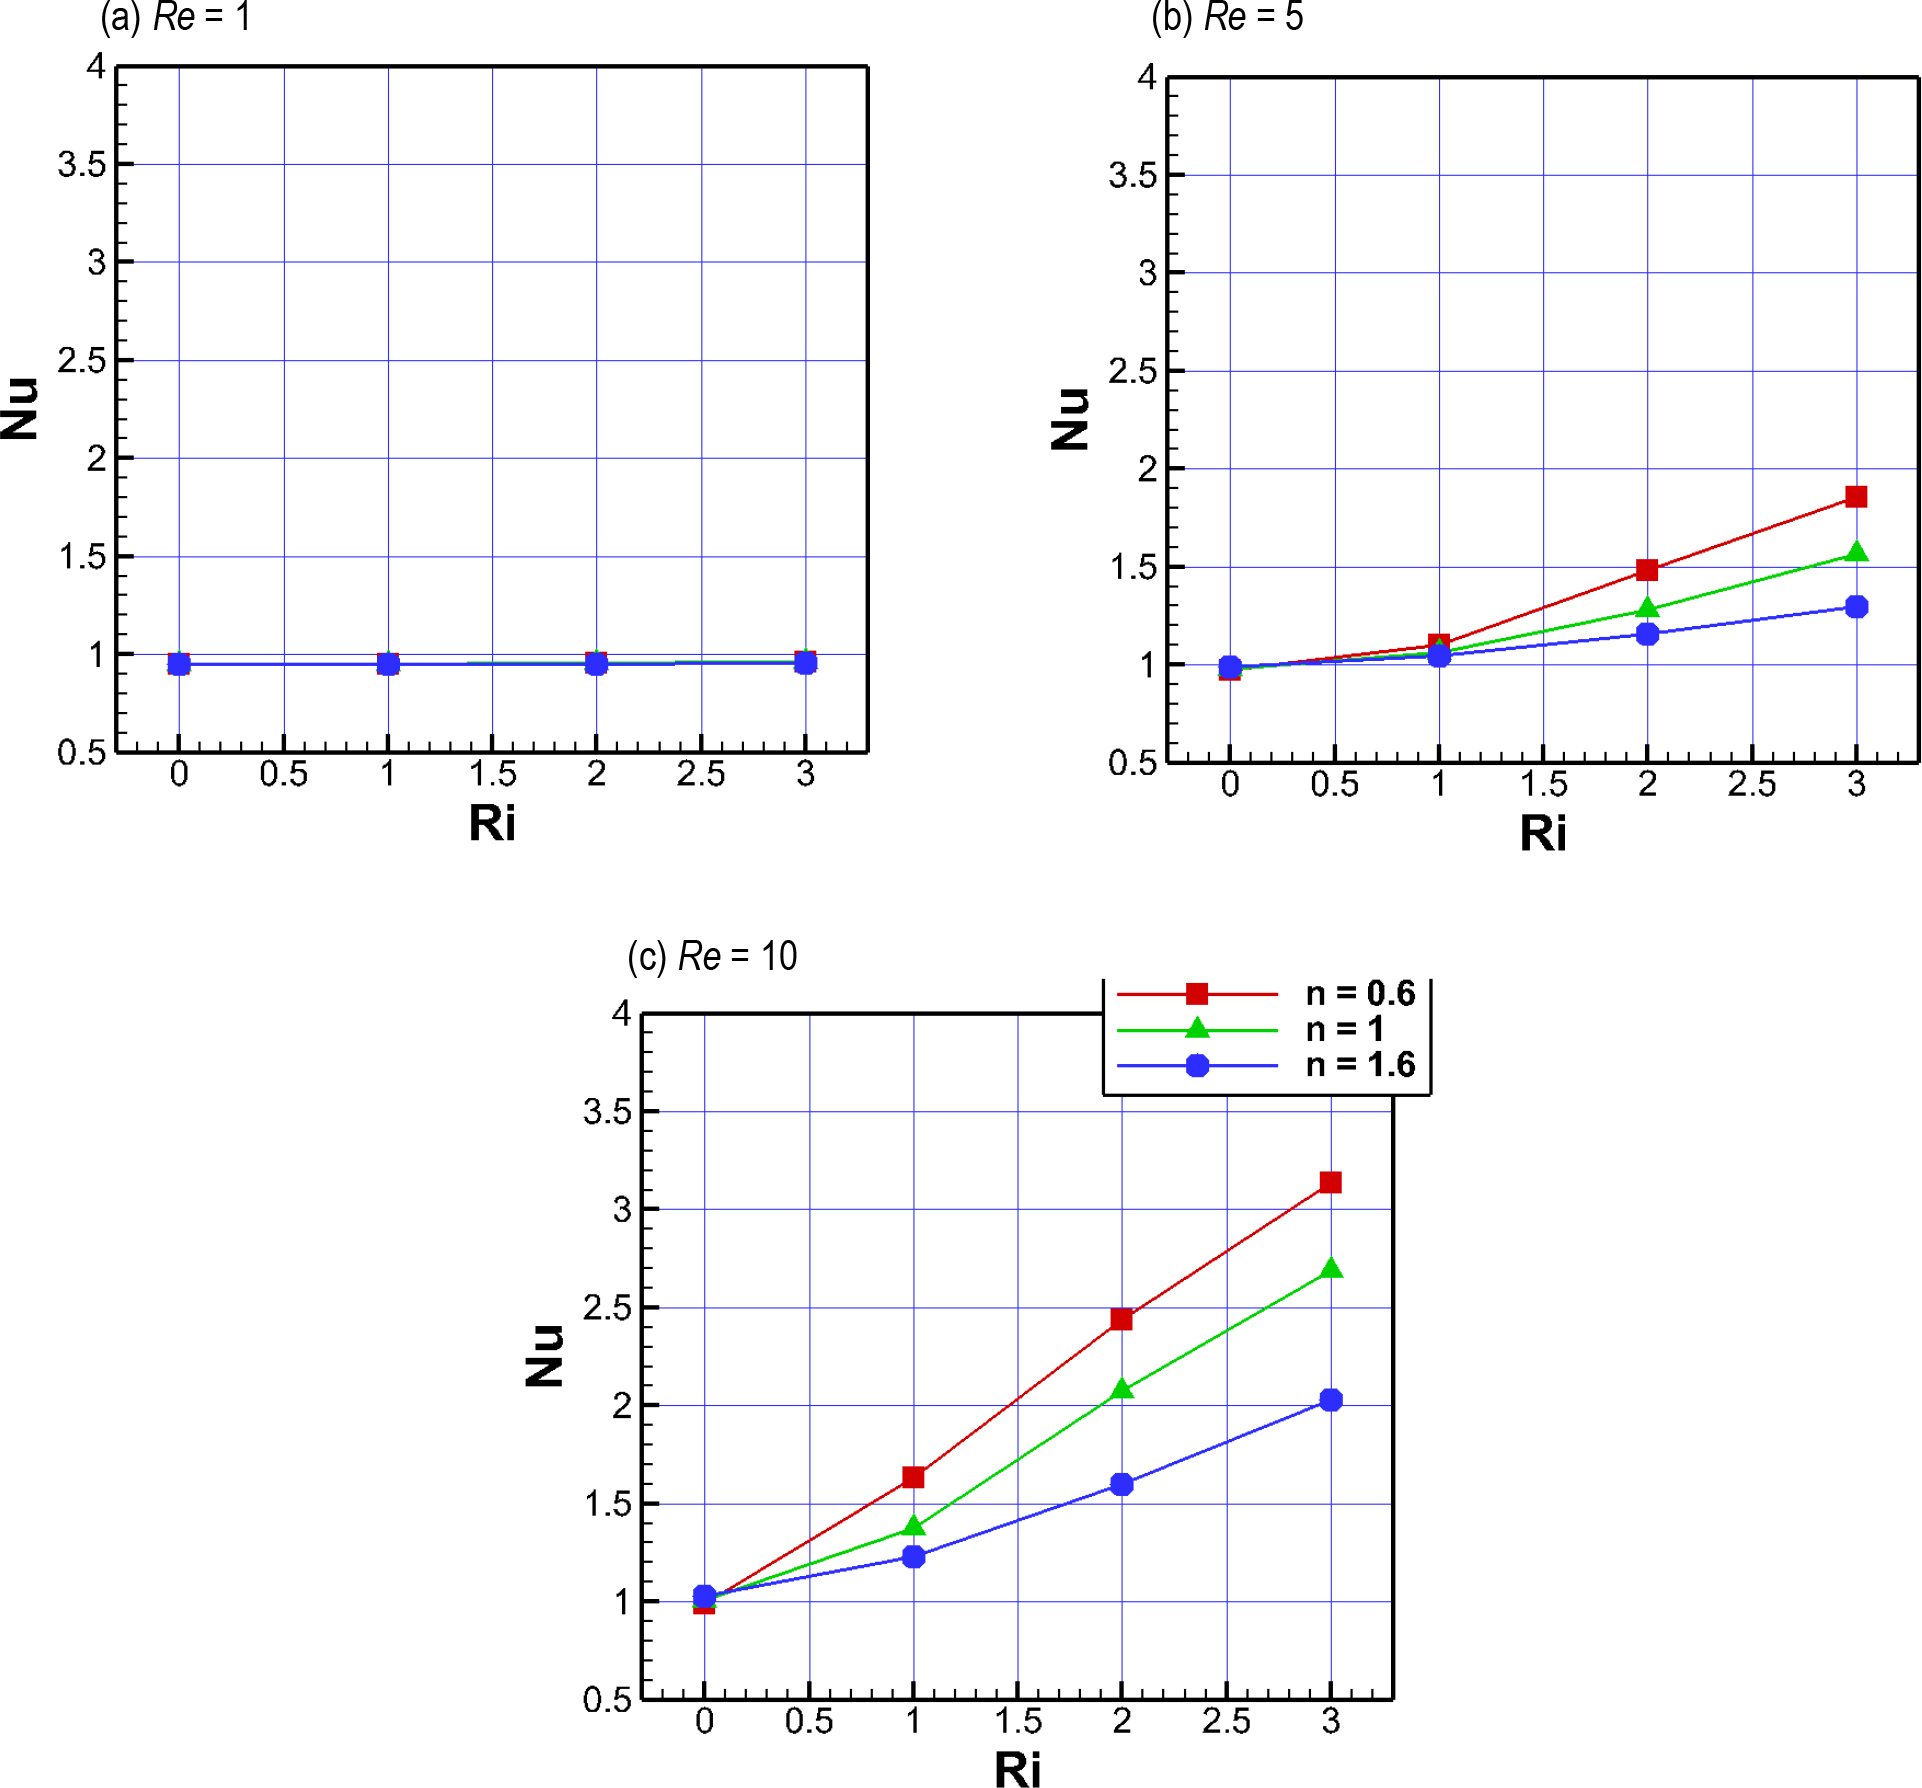
Fig. 12.
Values of Nu versus Ri and n: a) for Re = 1; b) Re = 5; and c) Re = 10
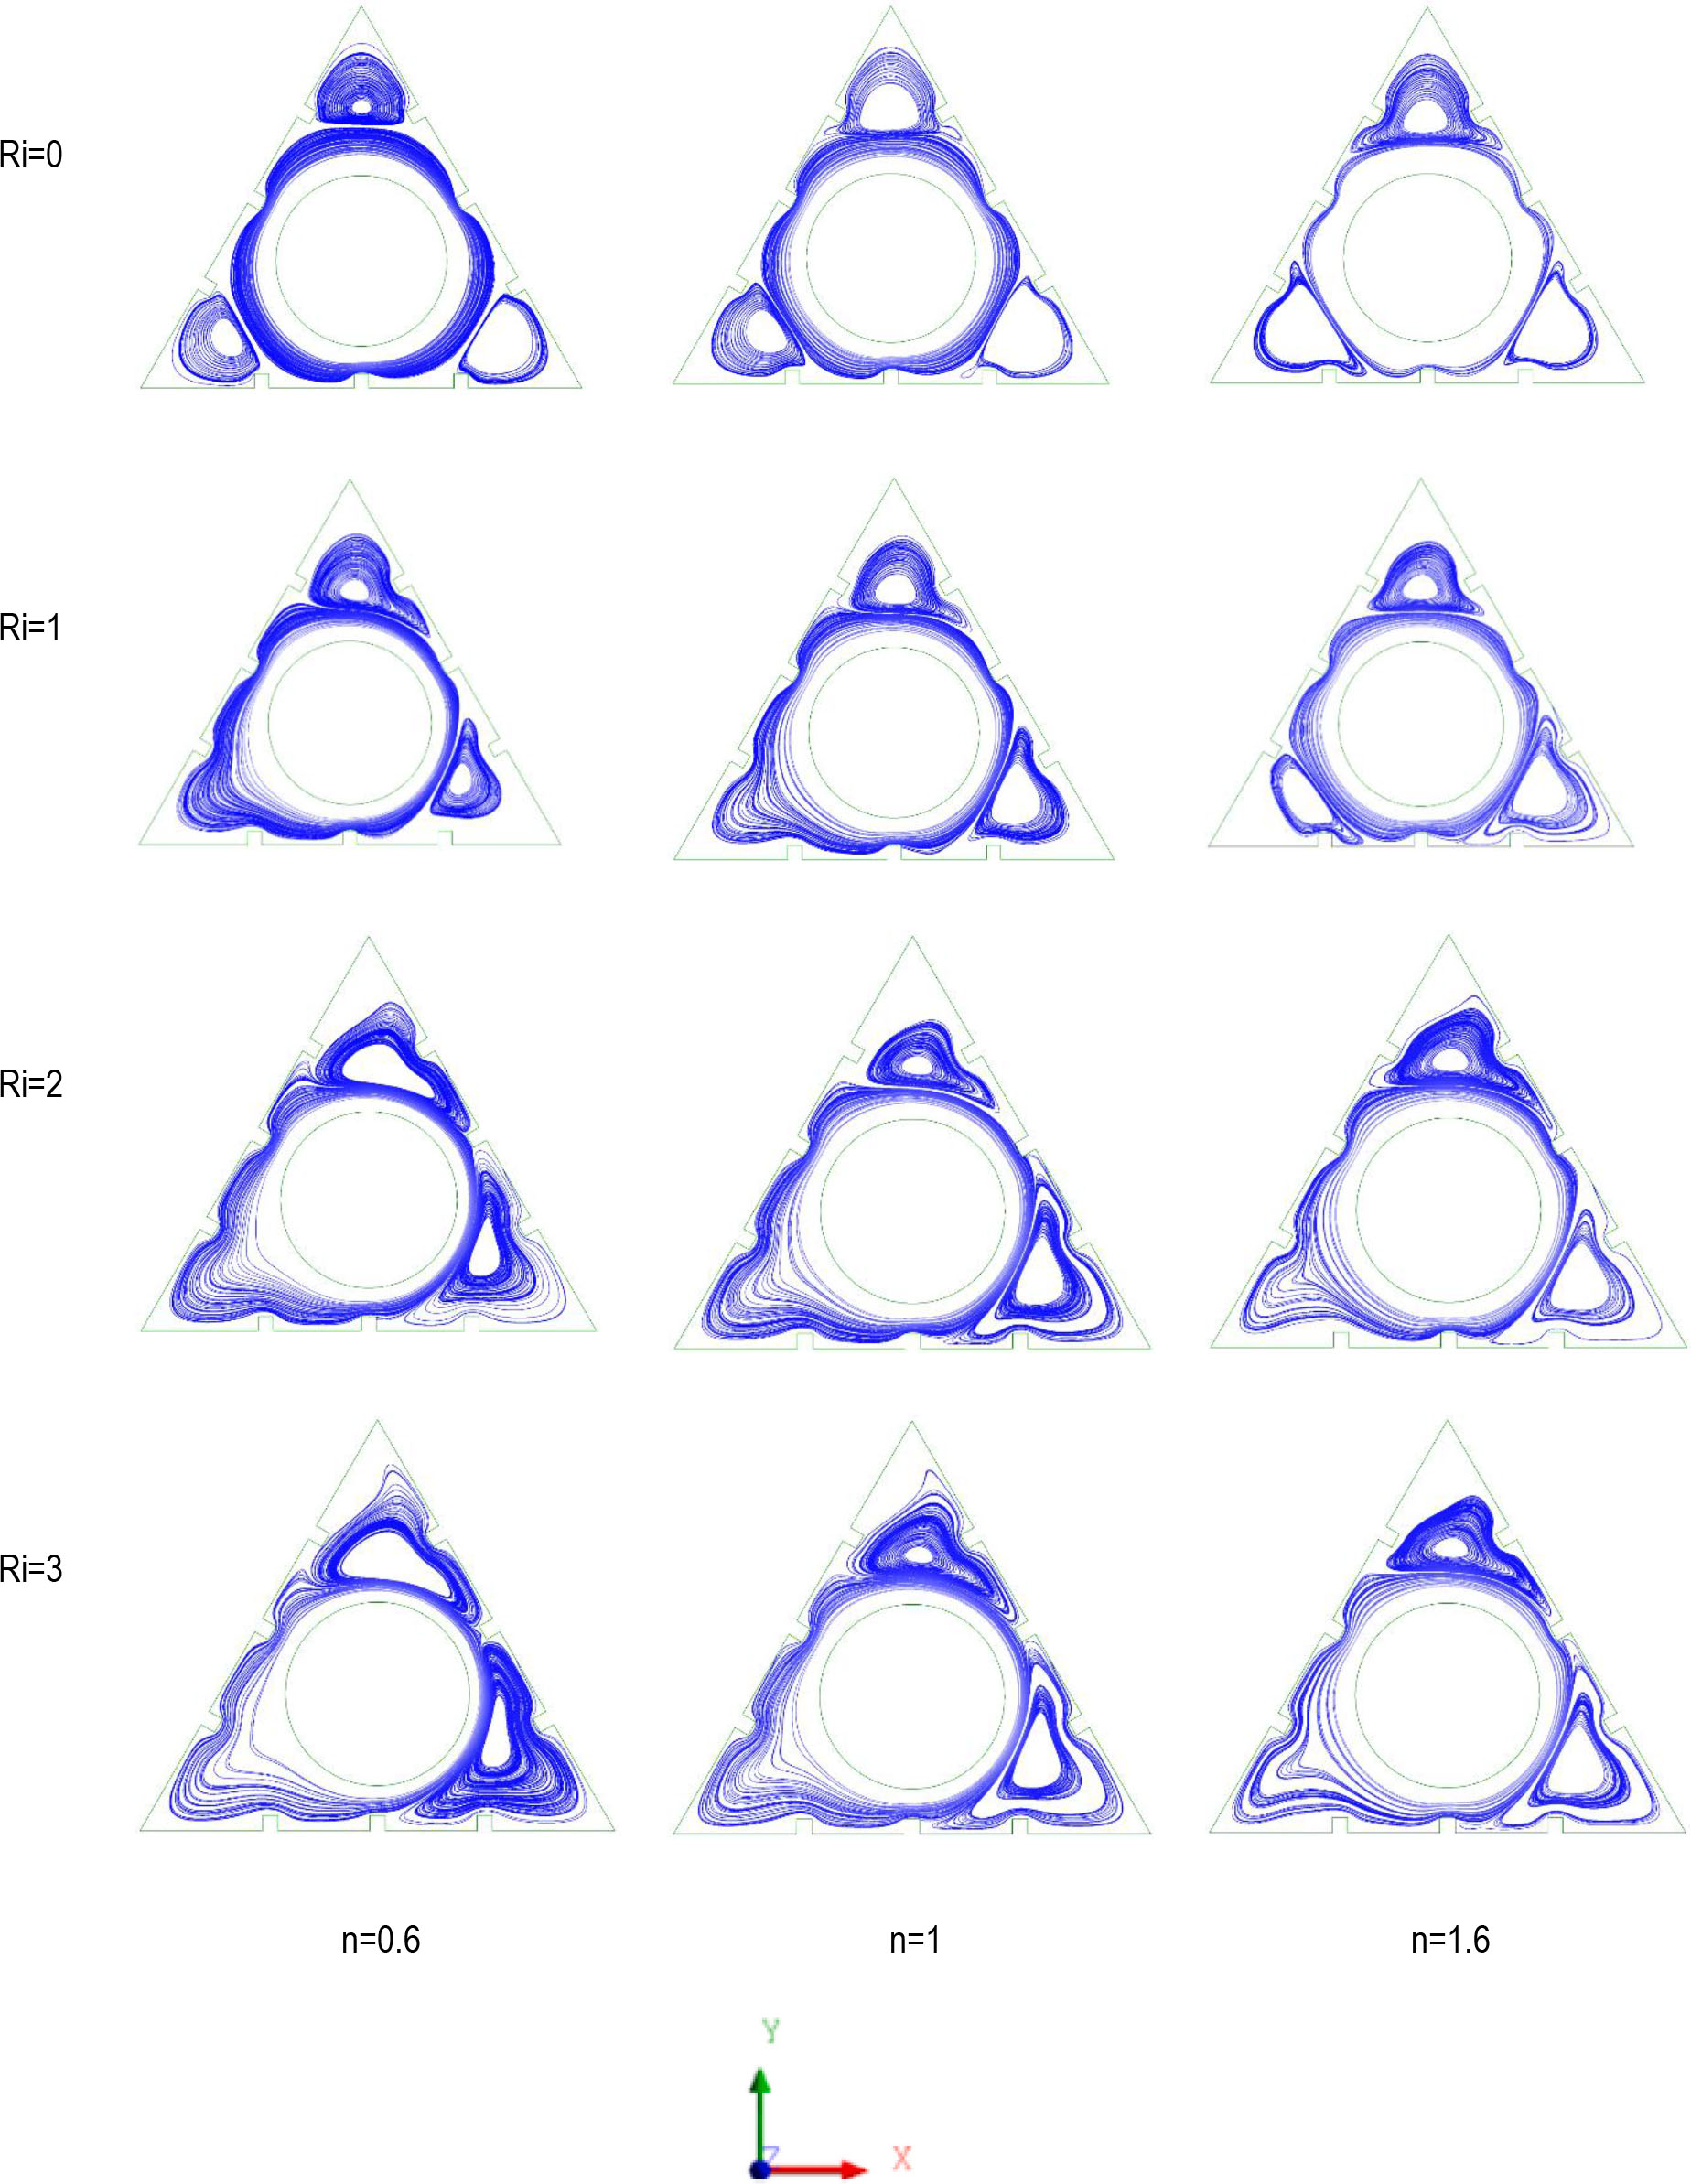
Fig. 13.
Streamlines for the case of blockage ratio of 0.36 at Re = 10
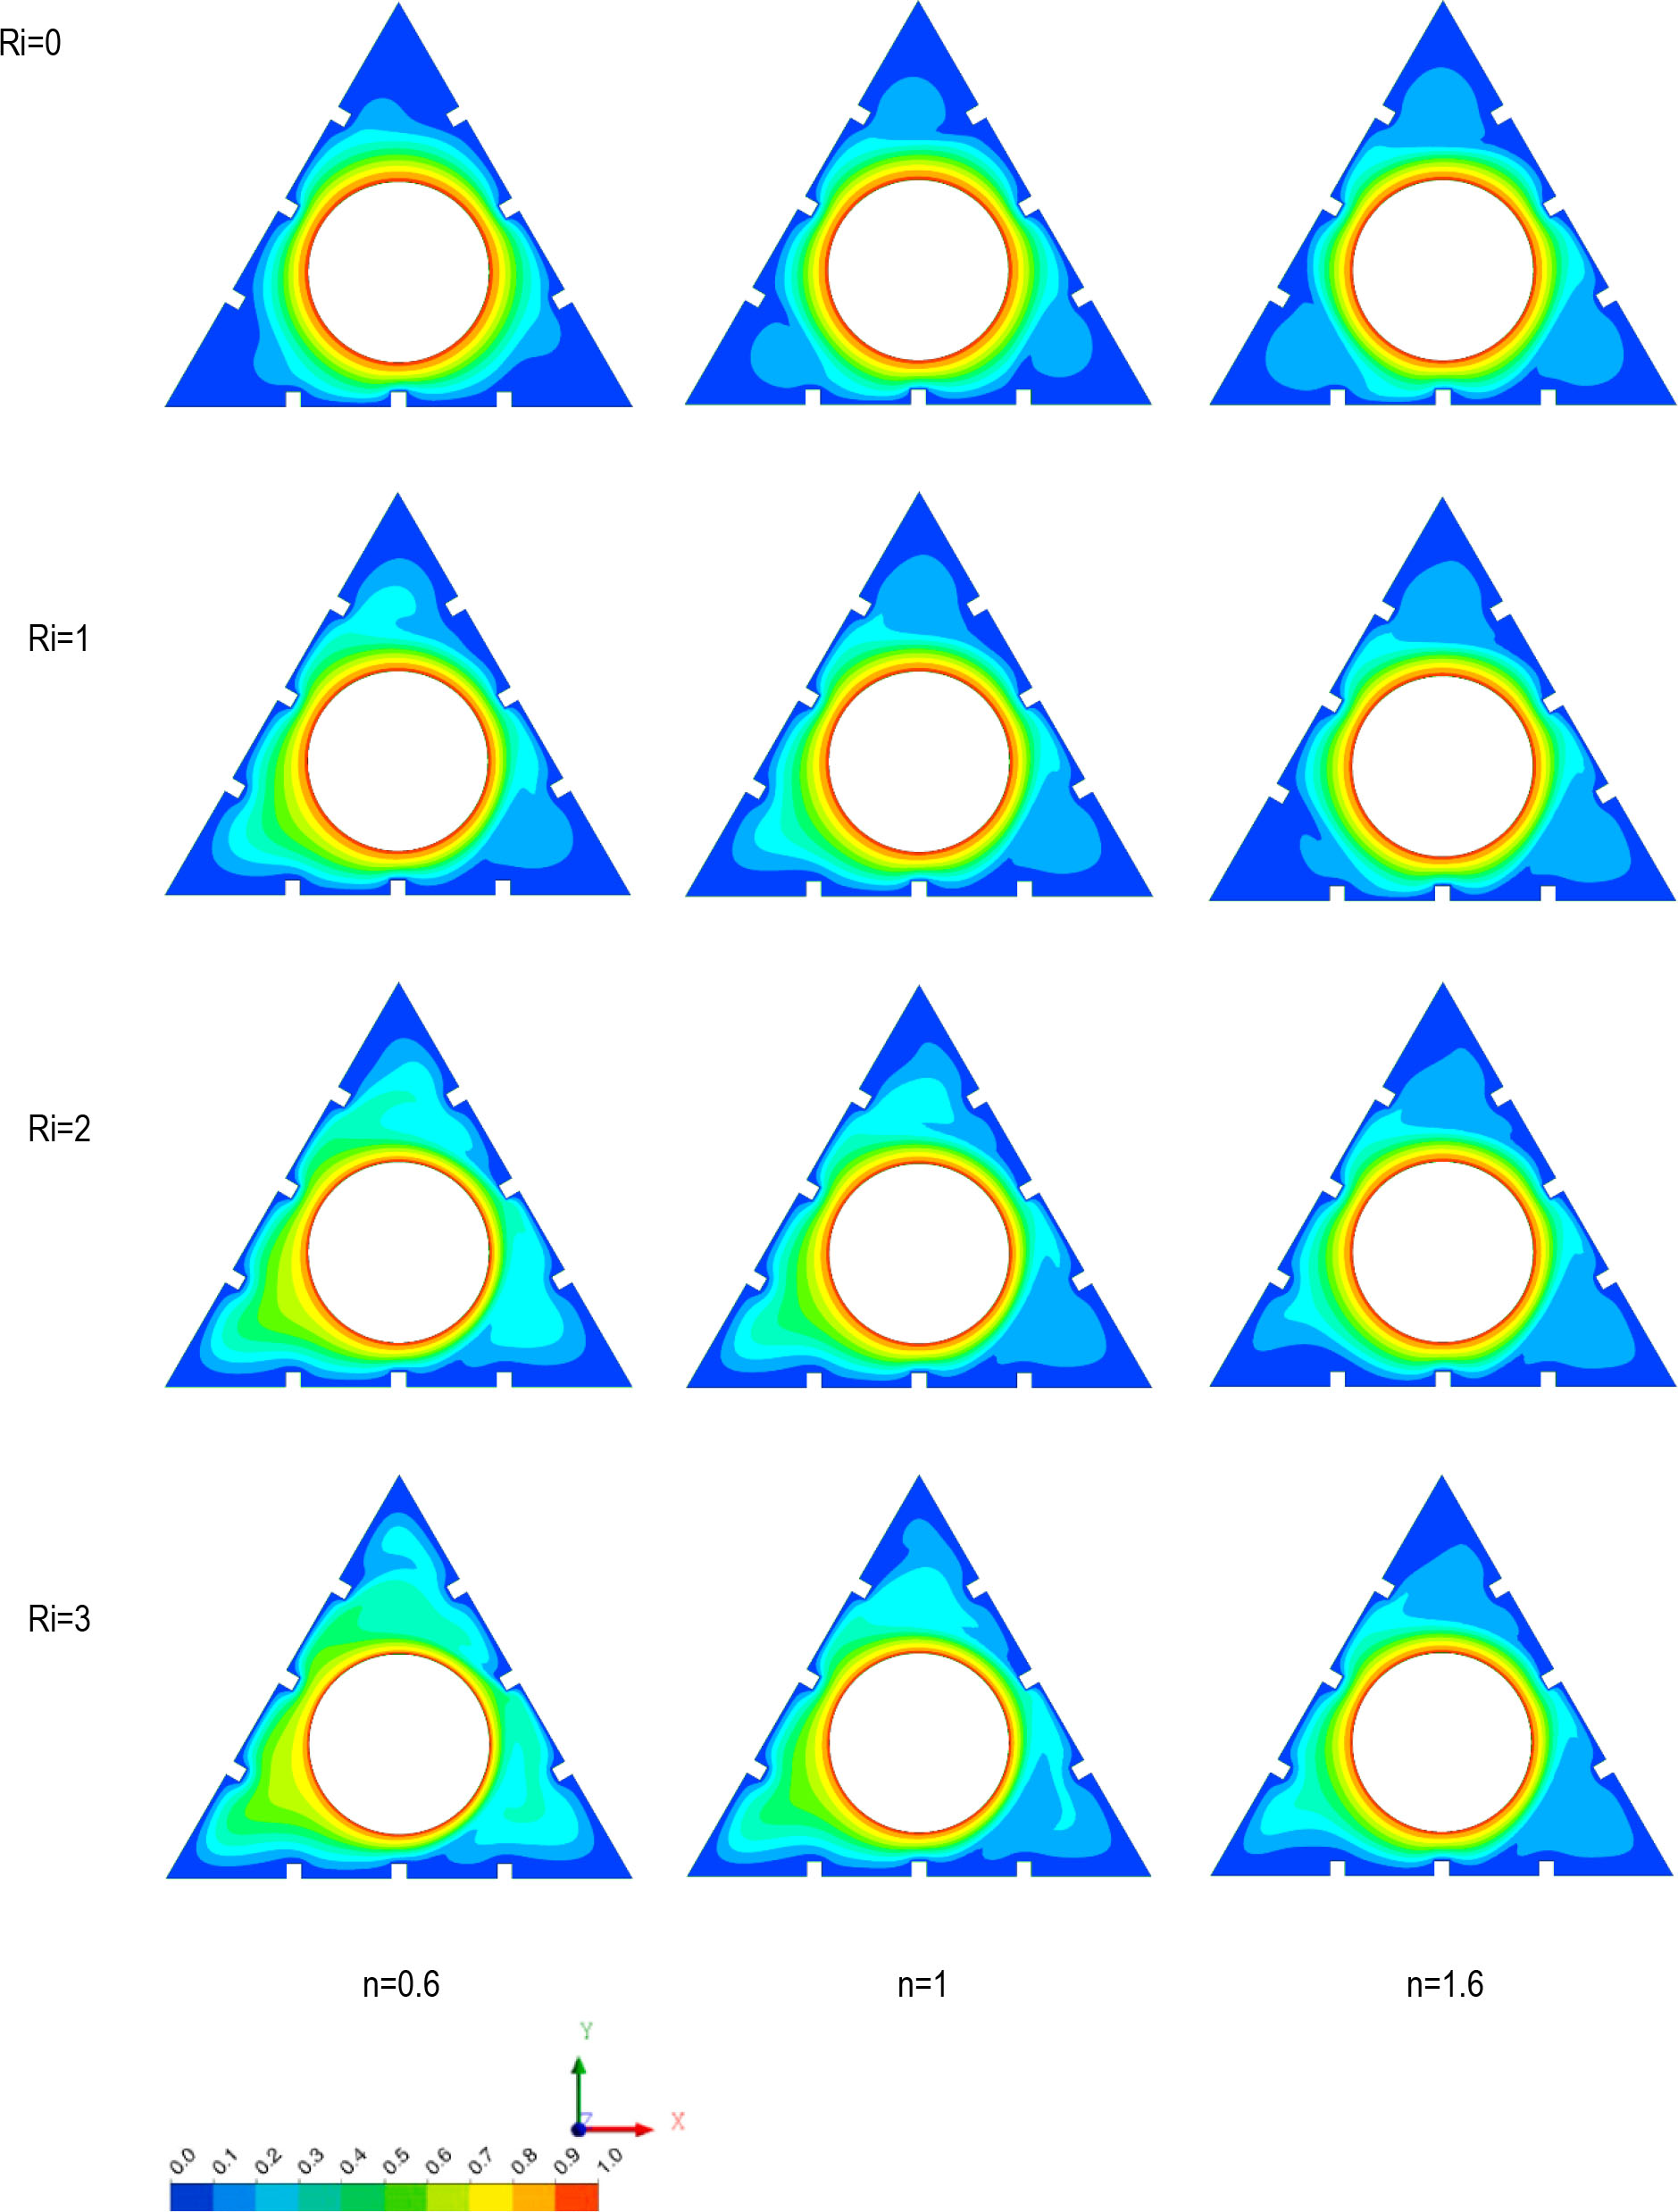
Fig. 14.
Isotherms for the case of blockage ratio of 0.36 at Re = 10
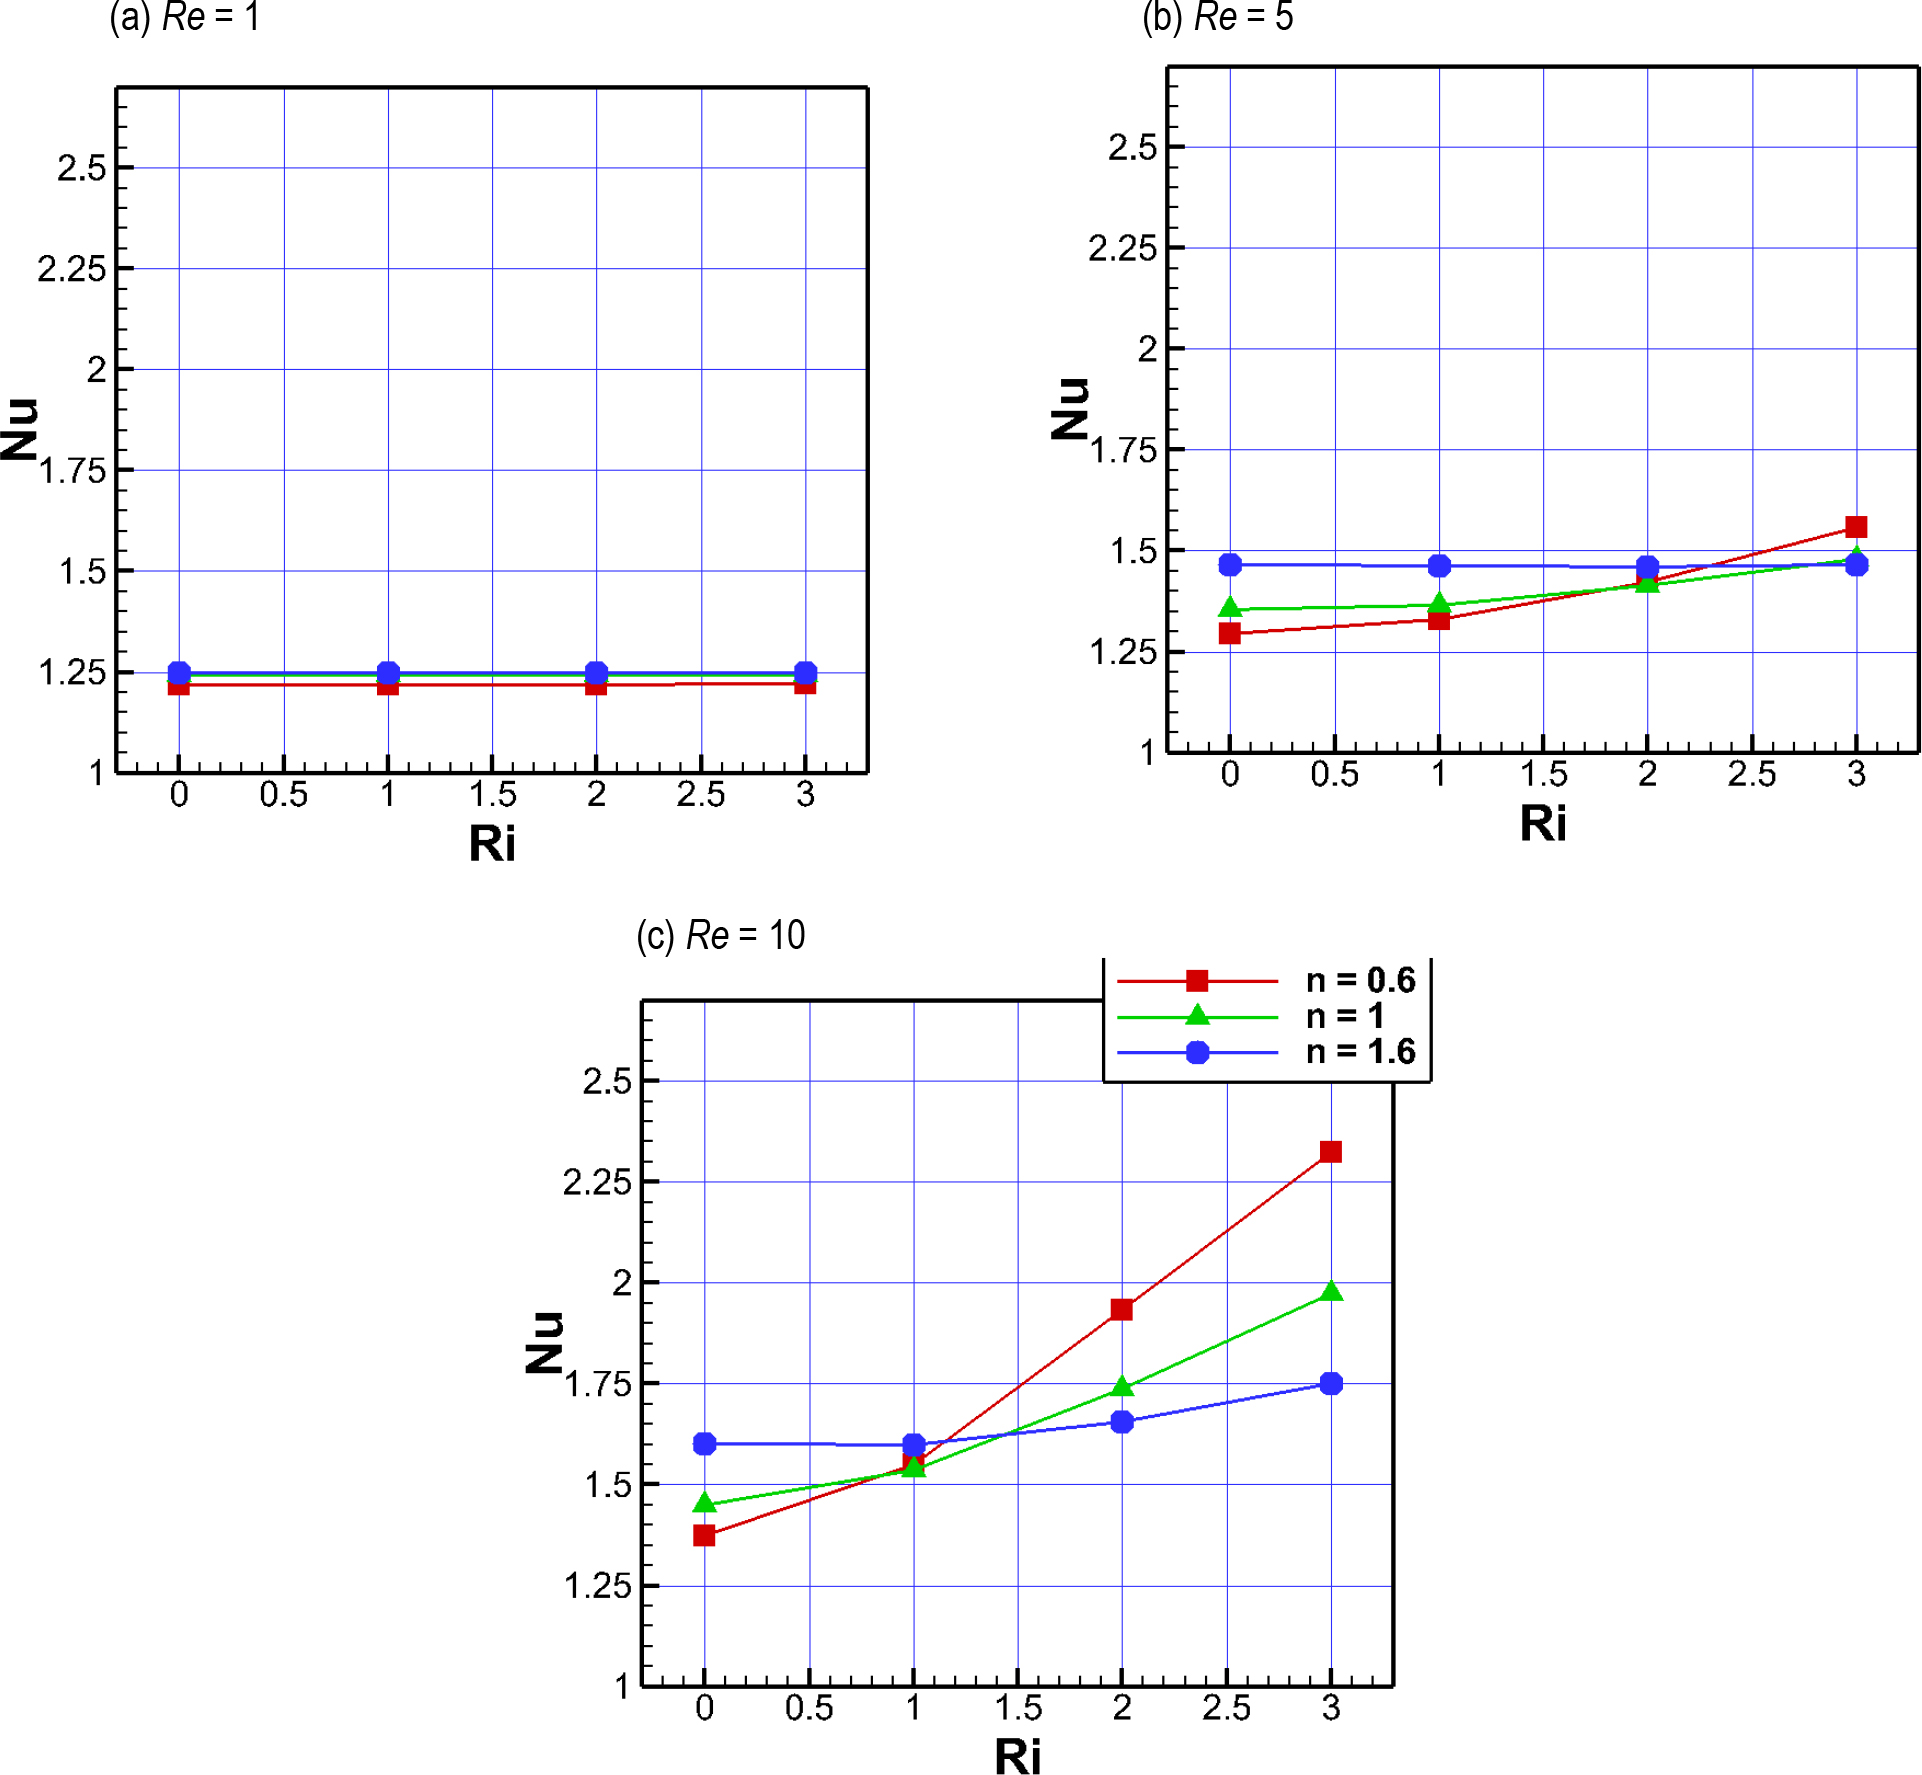
Fig. 15.
Values of Nu versus Ri and n: a) for Re = 1; b) Re = 5; and c) Re = 10
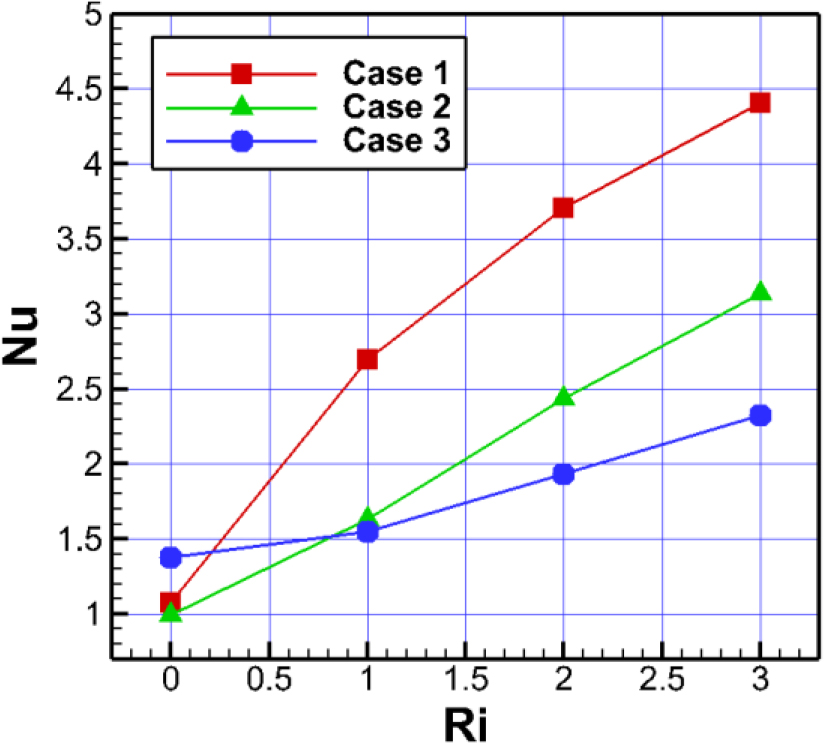
Fig. 16.
Values of Nu with Ri for the three cases at Re = 10 and n = 0.6