
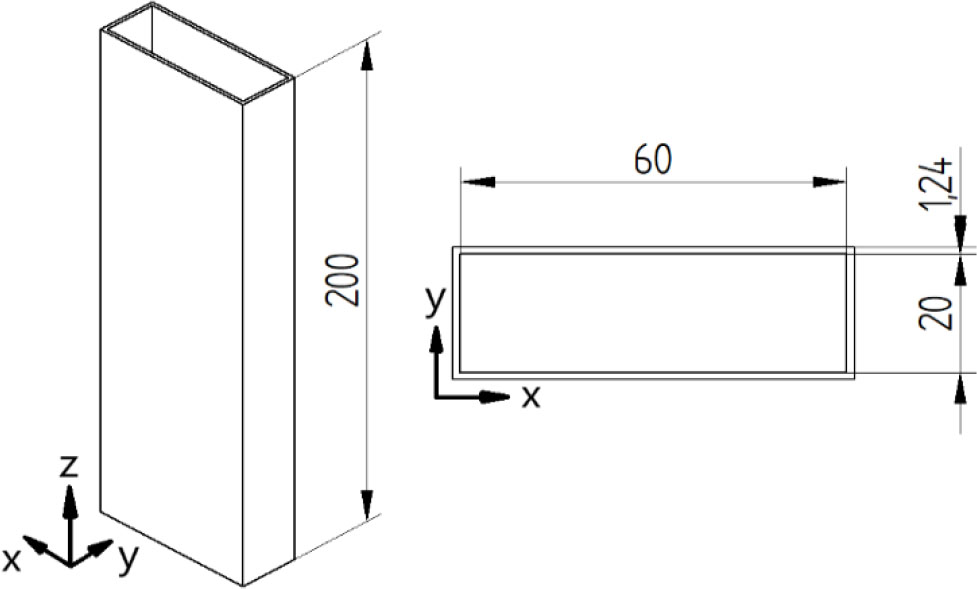
Fig. 1.
Overall dimensions of test specimen
Tab. 1.
Material properties of the carbon–epoxy composite:average values with standard deviation from a number of material test trials more extensively described in papers [13,19]
| Mechanical properties | Strength parameters | ||
|---|---|---|---|
| Young’s modulus E1 (MPa) | 103014.11 (2145.73) | Tensile strength (0°) Ftu (MPa) | 1277.41 (56.23) |
| Young’s modulus E2 (MPa) | 7361.45 (307.97) | Compressive strength (0°) Fcu (MPa) | 572.44 (46.20) |
| Poisson’s ratio u12 [-] | 0.37 (0.17) | Tensile strength (90°) Ftu (MPa) | 31.46 (9.64) |
| Kirchhoff modulus G12 (MPa) | 4040.53 (167.35) | Compressive strength (90°) Fcu (MPa) | 104.04 (7.34) |
| Shear strength (45°) Fsu(MPa) | 134.48 (2.71) | ||
Tab. 1.
Failure force values obtained experimentally and numerically
| Spec. No\Lay-up | 1 (N) | 2 (N) | 3 (N) | EXP Avg.Value (N) | FEM (N) |
|---|---|---|---|---|---|
| [0/90/0/90]s | 39799.60 | 39150.57 | 40573.07 | 39841.08 | 40462.60 |
| [45/-45/90/0]s | 33661.53 | 34416.62 | 34364.65 | 34147.60 | 34456.80 |
| [90/-45/45/0]s | 29448.82 | 31415.54 | 31172.51 | 30678.96 | 31884.60 |
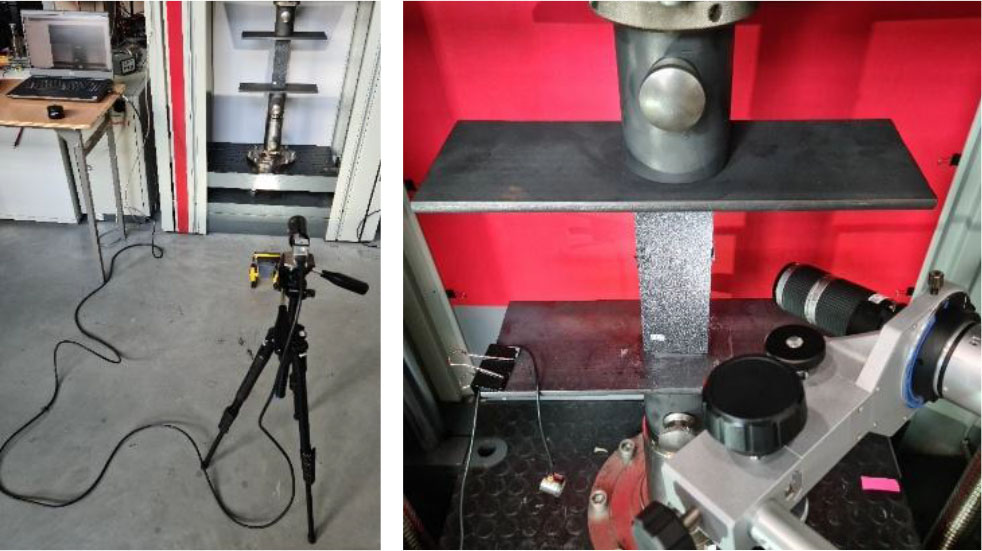
Fig. 2.
Test stand
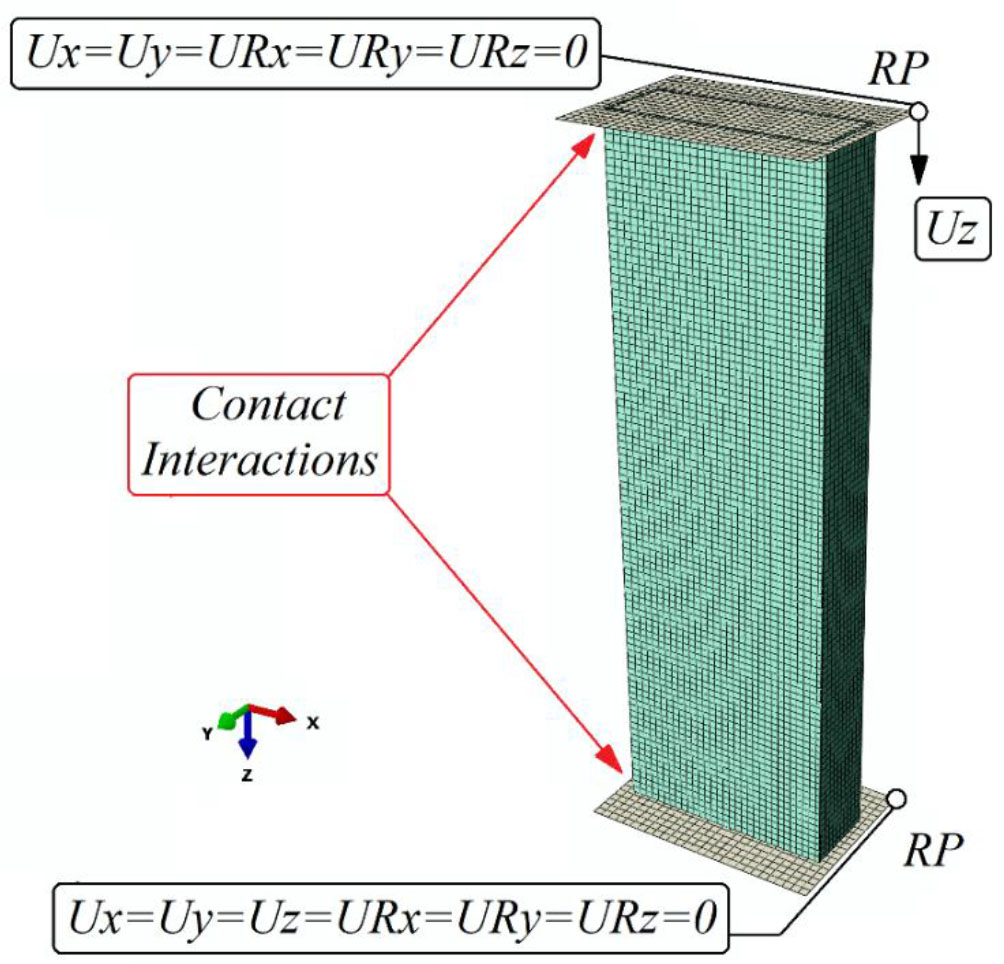
Fig. 3.
Numerical model with boundary conditions
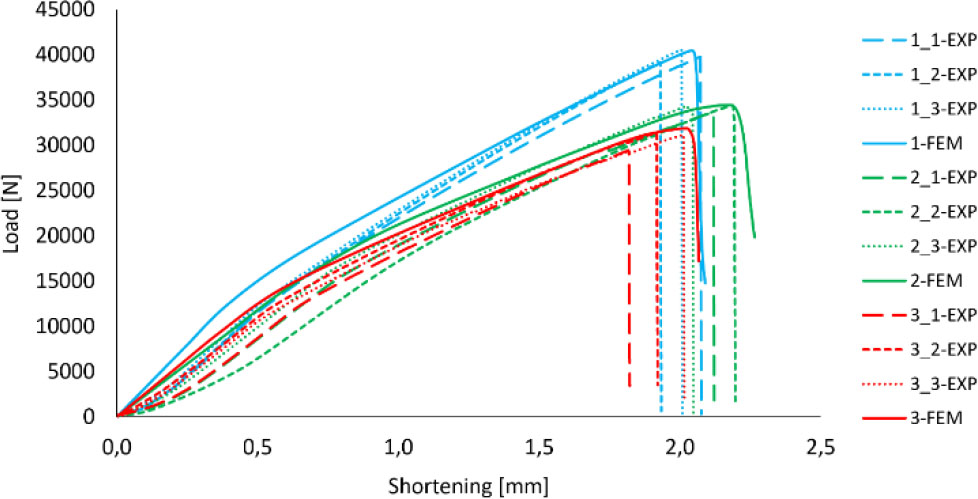
Fig. 4.
Summary of post-buckling equilibrium paths
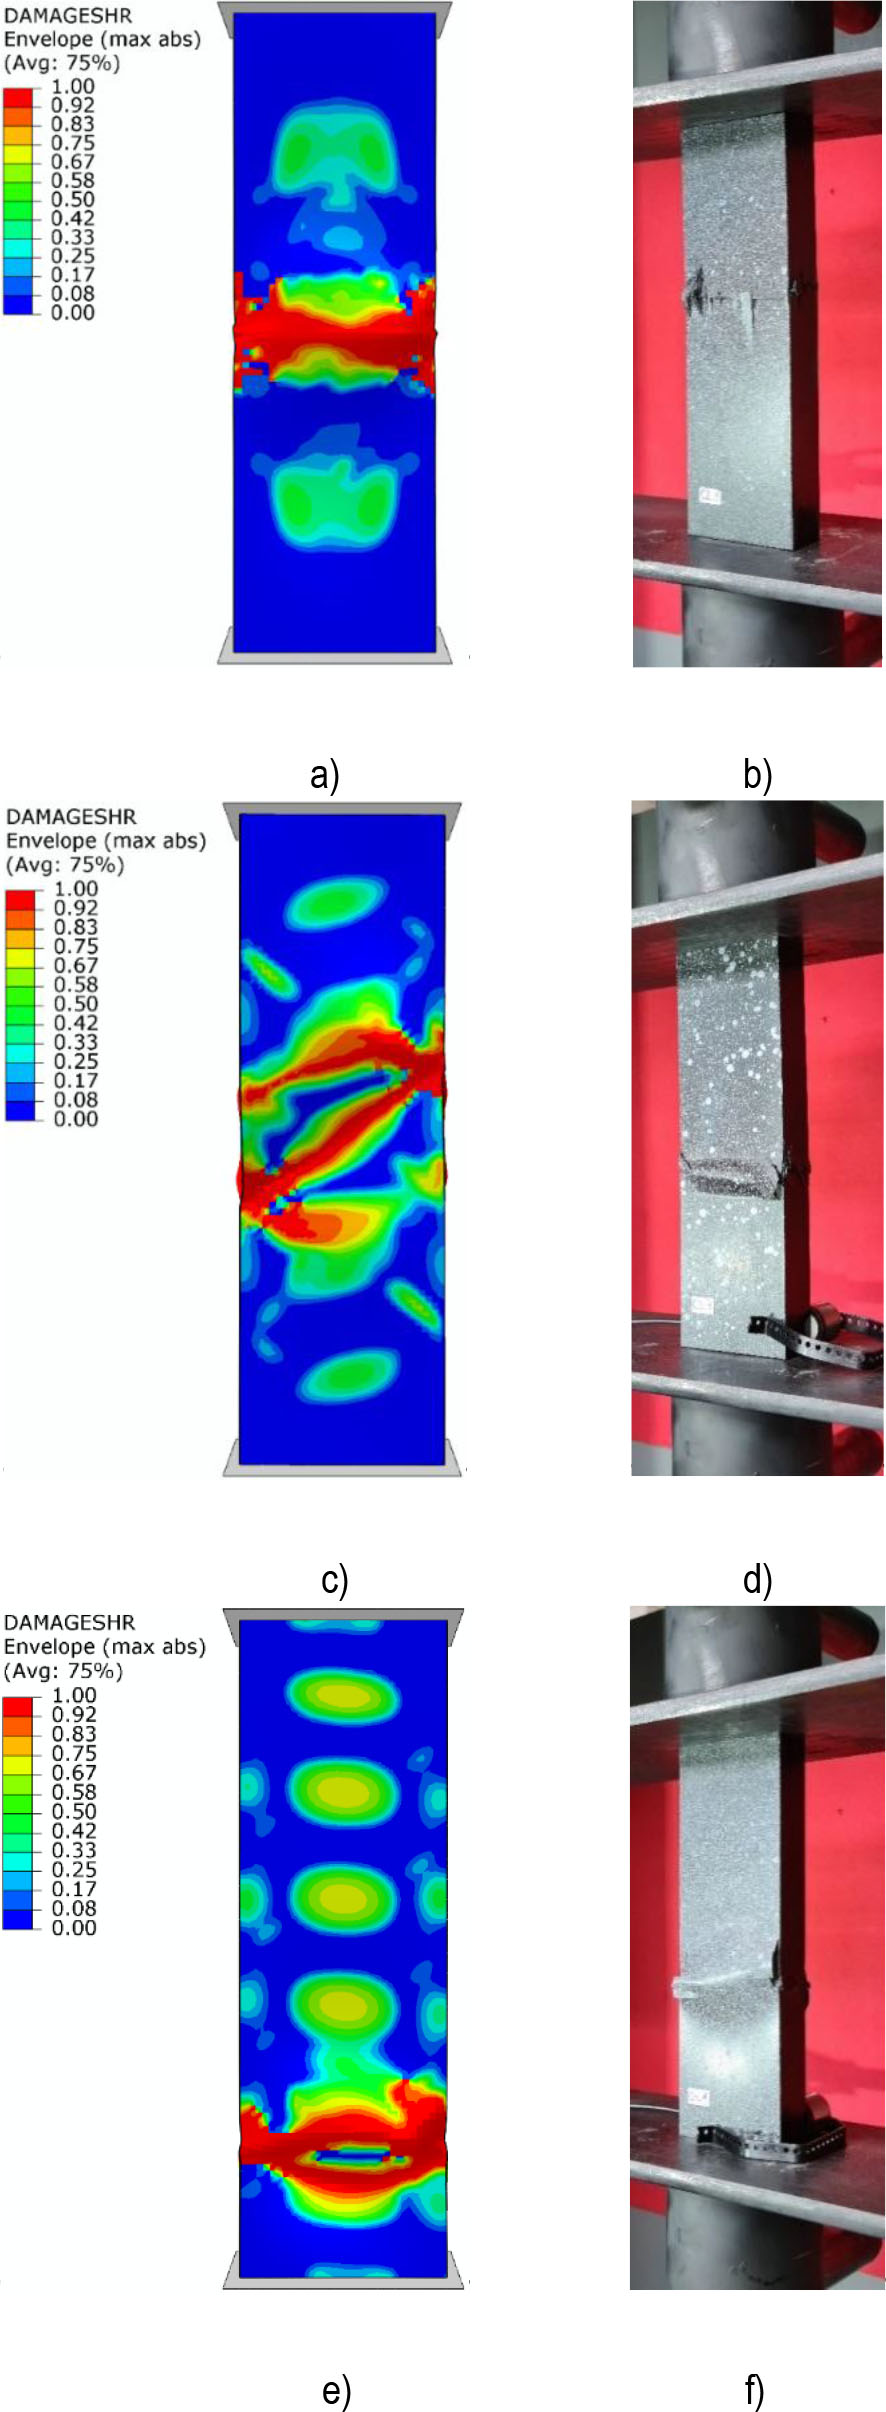
Fig. 5.
Comparison of numerical-experimental failure: a) FEM – 1 lay-up, b) EXP – 1 lay-up, c) FEM – 2 lay-up, d) EXP – 2 lay-up, e) FEM – 3 lay-up, f) EXP – 3 lay-up
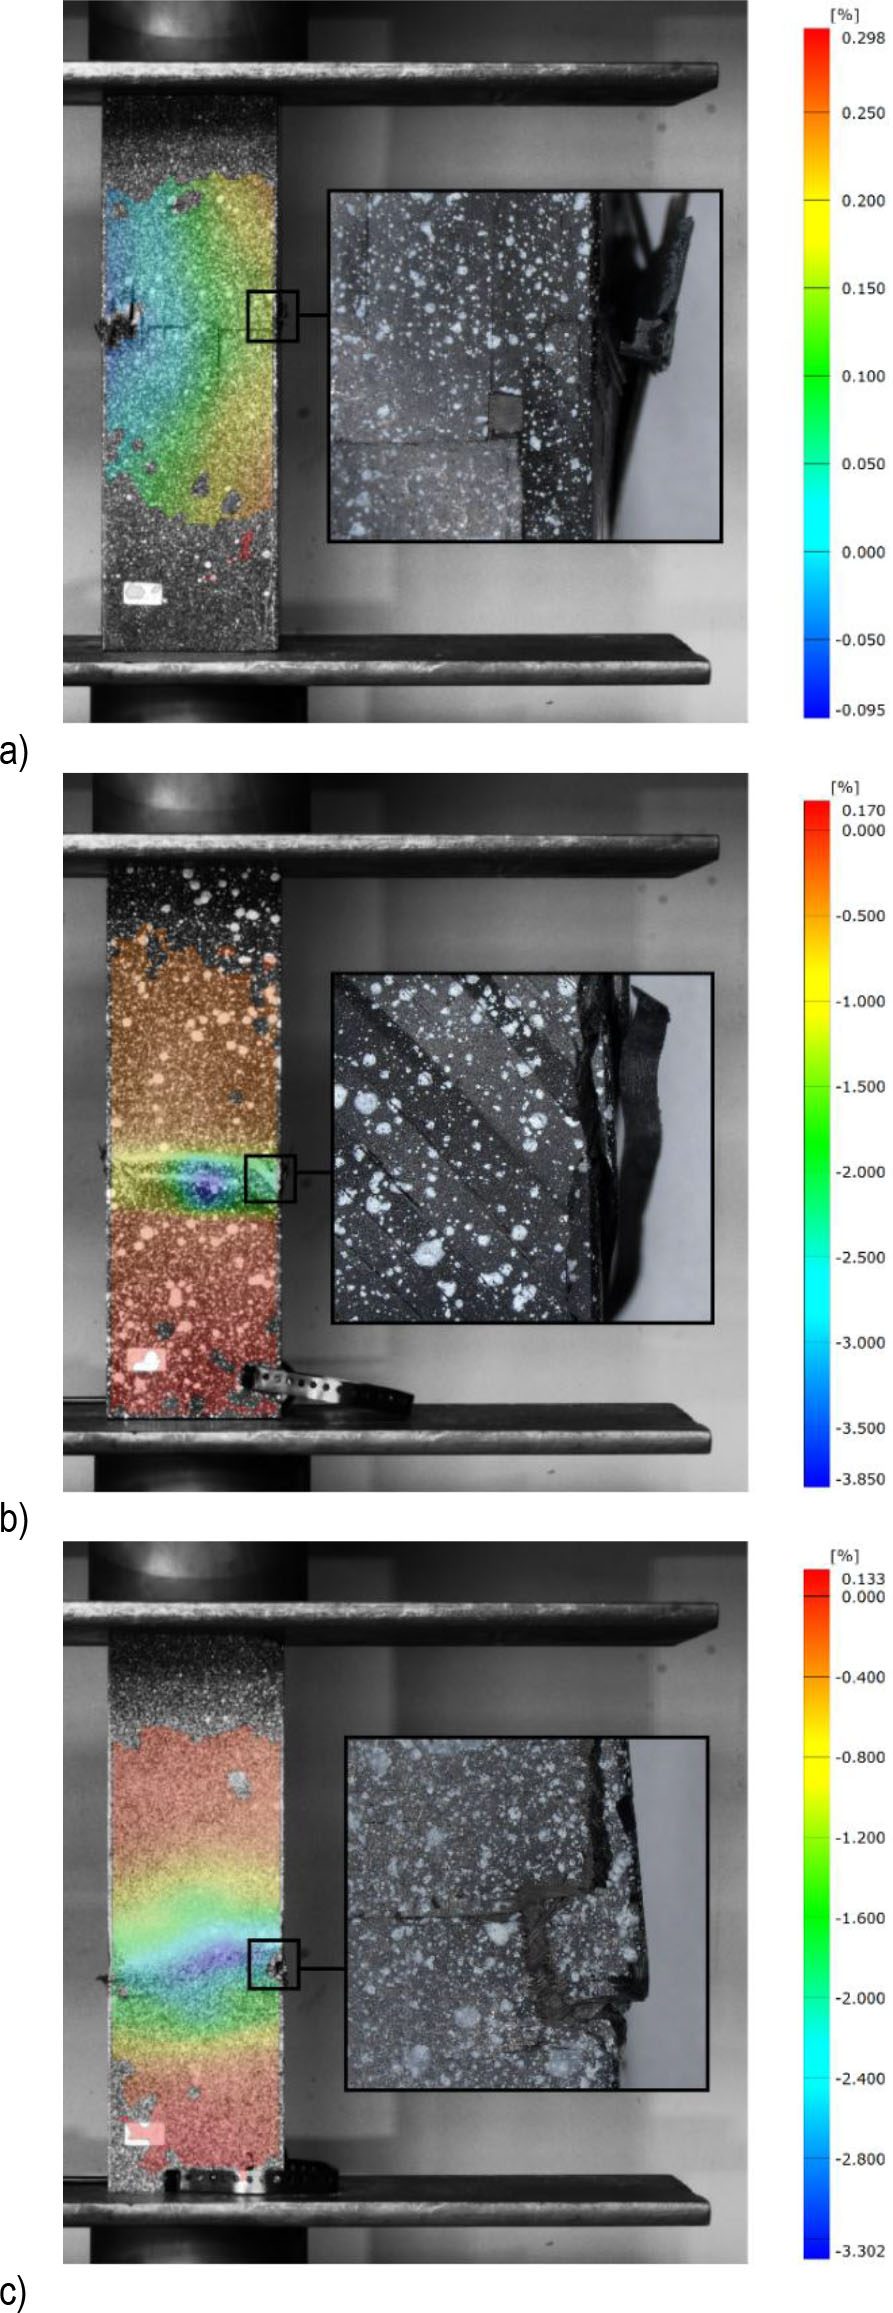
Fig. 6.
Damaged structures with graphical visualization of deformations and enlarged representation of selected damage areas: a) 1 lay-up, b) 2 lay-up, c) 3 lay-up
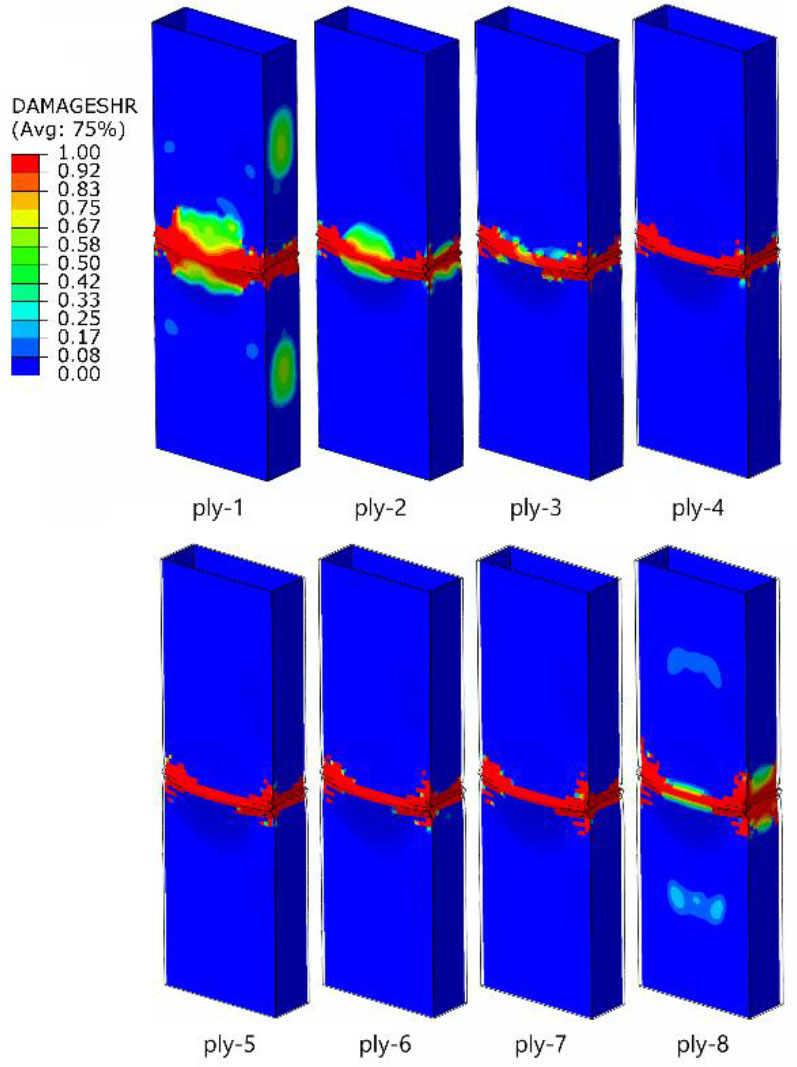
Fig. 7.
Comparison of the damage level of individual layers