
1. Introduction
Water pollution threatens aquatic life and human health (Goh et al. 2019; Lin et al. 2022). This pollution is linked to the impact of large quantities of organic and inorganic waste resulting from human activities (Chowdhary et al. 2020; Lin et al. 2022). The immediate consequences are water quality deterioration, creating a favourable environment for numerous microorganisms, including viruses, fungi, parasites, and bacteria (Gamze et al. 2023).
Concerning bacteria, Pseudomonas aeruginosa (P. aeruginosa), which is commonly found in aquatic environments, and Staphylococcus aureus (S. aureus), which is generally associated with external contamination, are implicated in many waterborne infections (Fanny et al. 2008; Gretchen et al. 2025). Their abundance in surface waters is most often linked to nutrient and organic pollution resulting from human activities (Esiobu et al. 2013; Adriana et al. 2020), and this may pose health risks to people who use these resources (Fanny et al. 2008; Gretchen et al. 2025). In fact, people can become infected by swimming in contaminated waters, drinking contaminated water, or eating fish from contaminated waters. The body parts most at risk are the skin, mouth, salivary glands, oesophagus, stomach, and intestines (Sharma and Gilbert 2018; Treuting et al. 2018; Soni et al. 2024). P. aeruginosa and S. aureus are the most common colonizers of the cystic fibrosis lung and frequently overlap to cause chronic and persistent coinfections associated with severe diseases (Gretchen et al. 2025).
Land use in the catchment areas of the Taabo, Kossou, and Faé reservoirs is characterized by intense urbanization, livestock farming, agriculture, and mining activities. Several populations observed near these bodies of water and upstream waterways practice these activities (Groga et al. 2012; Koné 2012). Therefore, discharges from these activities could end up in the reservoirs, altering their quality and causing water-borne diseases, while these reservoirs are commonly used for fishing and fish farming. Recent studies on the quality of these three reservoirs showed an abundant presence of faecal indicator bacteria, in particular Escherichia coli and Intestinal Enterococci (Tiémoko et al. 2020) and high concentrations of cultivable heterotrophic bacteria (Tiémoko et al. 2025). This indicates that these water bodies are increasingly exposed to faecal contamination and excessive inputs of other organic matter, which may contribute to a deterioration in water quality. The concentration of pathogenic bacteria could therefore be high in these waters, posing a threat to public health. Furthermore, unlike lakes, there is little knowledge about the distribution of pathogenic bacteria in these reservoirs, which are complex ecotones linking fluvial ecosystems with the terrestrial environments of their catchments. The aim of this study was to assess the variation in pathogen abundance, including P. aeruginosa and S. aureus, in the Kossou, Taabo, and Faé reservoirs.
2. Materials and Methods
2.1. Study area
The Kossou, Taabo and Faé hydroelectric reservoirs, located in the center, south and south-west of Côte d'Ivoire respectively, constitute the study area (Fig. 1). In brief, the Taabo, Kossou, and Faé reservoirs cover areas of 62 km2, 1,700 km2, and 16.28 km2 with watersheds of 58,700 km2, 32,400 km2, and 2,424 km2, respectively (Da costa and Diétoa 2007; Groga et al. 2012; Koné 2012). These catchment areas are mainly characterized by urban areas, livestock farming, agriculture, and farms.
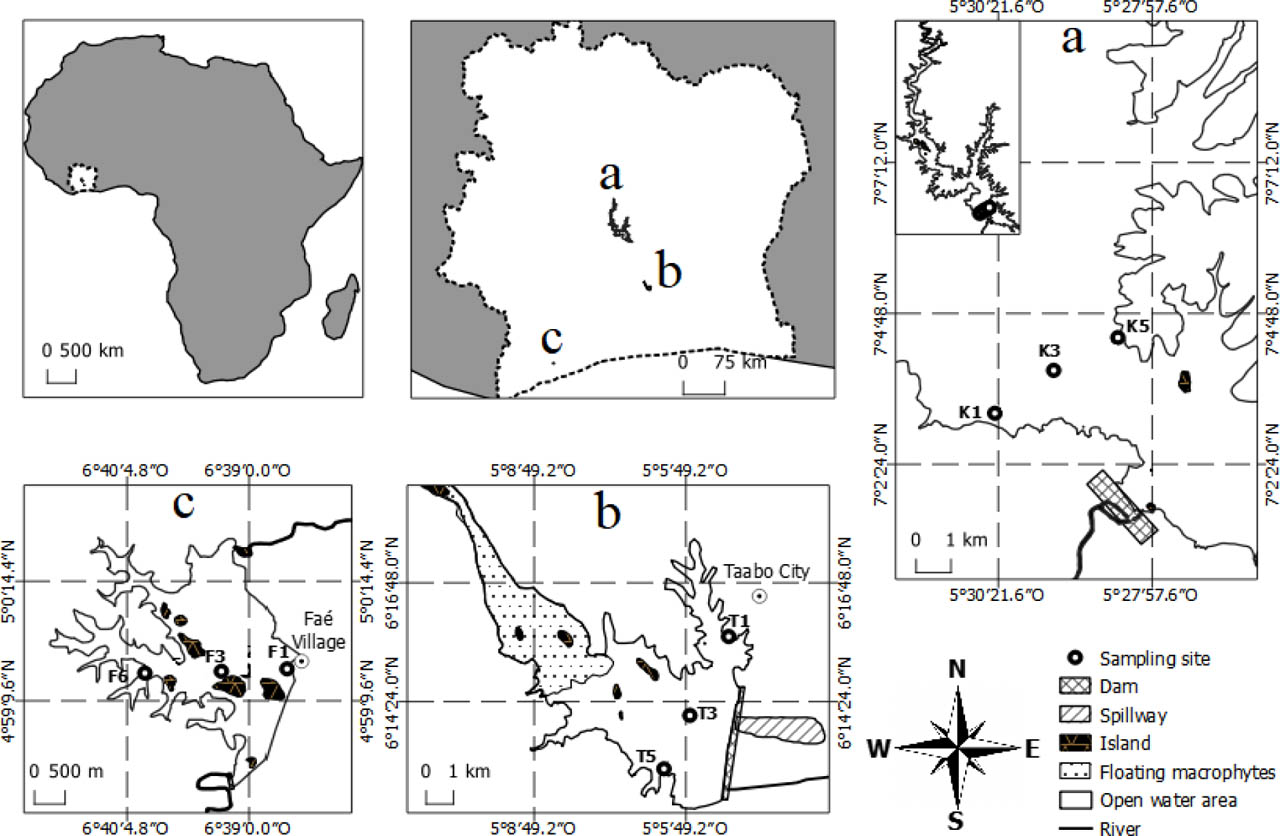
Fig. 1
Location of sampling stations in the studied reservoirs. a: Lake Kossou; b: Lake Taabo; c: Lake Faé (Tiémoko et al. 2025)
2.2. Water sampling
Water sampling was conducted from February 2018 to October 2018, specifically in February (Fe), April (Ap), June (Jn), July (Jl), September (Se), and October (Oc). Three sampling points were selected along tran-sects in Lake Kossou (K1, K3, and K5), Lake Taabo (T1, T3, and T5), and Lake Faé (F1, F3, and F6) to compare shore areas and depth areas (Figure 1). Briefly, sterile 1L bottles were filled with water sampled from the surface of all reservoirs at the various sampling points. A total of 54 samples were collected for microbiological analysis. The bottles were labeled and transported to the laboratory on ice in cooler boxes (4 °C), then analyzed within a maximum of 8 h after sampling. The activities observed around the various sampling points are described in Table 1.
Table 1:
Coordinates and characteristics of the sampling sites in each man–made reservoir
| Reservoirs | Sampling points | Description of land use types | Coordinates | |
|---|---|---|---|---|
| Latitude (N) | longitude (W) | |||
| Kossou | K1 | Small village near of the lake, cattle farming, mining activities in the shore | 07°03′12.5″ | −05°30′25.1″ |
| K3 | Fishing area | 07°03′53.3″ | −05°29′30.1″ | |
| K5 | of the lake, cattle farming | 07°04′24.6″ | −05°28′30.2″ | |
| Taabo | T1 | Urban zone near of lake, cattle farming on the shore, agriculture (hevea, cassava crops) | 06°15′46.6» | −05°04′57.4» |
| T3 | Fish farming into the lake, fishing area | 06°13′58.3» | −05°05′45.2» | |
| T5 | Big village close to the lake, fishing area, agriculture | 06°12′59.2» | −05°06′14.6» | |
| Fae | F1 | Big village very close to the lake, fishing area | 04°59′24.2» | −06°38′01.3″ |
| F3 | Fishing area, watercourse pathway, agriculture on the shore (cocoa, hevea) | 04°59′26.3» | −06°39′00.8″ | |
| F6 | Fishing area, agriculture on the shore (cocoa, hevea crops) | 04°59′24.5» | −06°39′55» | |
2.3. Culture-based enumeration of pathogen bacteria
Pseudomonas aeruginosa (P. aeruginosa) was analyzed using Cetrimide agar (Liofilchem: 610041, Italy) supplemented with glycerol and Staphylococcus aureus (S. aureus) was analyzed using Baird-Parker agar (CONDA Pronodisa: CAT: 1100.00, Spain) supplemented with Egg Yolk Tellurite Enrichment and sulfamethazine. These analyses were carried out in accordance with the manufacturers' instructions. Briefly, filtration of a sample volume (1 mL, 10 mL, or 100 mL) through a sterile filter membrane (porosity 0.22 μm) was carried out, and the membrane was deposited on the agar. The agar plates were incubated for 44 hours at 41°C for P. aeruginosa and for 48 hours at 35°C for S. aureus. Following incubation, the characteristic blue-green, fluorescent colonies of P. aeruginosa and the characteristic convex, black, shiny colonies with a halo of S. aureus were isolated for biochemical testing. Biochemical tests were performed on the two bacterial strains, focusing particularly on motility, Gram staining, catalase activity, and oxidase activity. DNAse and coagulase tests were carried out as additional tests for S. aureus only. After incubation and biochemical tests, plate counts were expressed as Log Colony Forming Units per 100 milliliters (Log CFU/100 mL). Pure cultures were collected and stored in 20% glycerol at −20°C for PCR analysis.
2.4. Molecular characterization of pathogen bacteria
2.4.1. DNA extraction of colonies
Genomic DNA of P. aeruginosa and S. aureus was extracted from isolated colonies using a method adapted from Sambrook et al. (2001). The following modifications were introduced: each colony was suspended in 400 μL of PBS buffer, and for S. aureus, an enzymatic treatment with lysozyme (1 mg/mL) was performed at 37°C for 30 min to facilitate cell wall lysis. Cells were then lysed by adding SDS (1%) and proteinase K (0.25 mg/mL), followed by incubation at 56°C for 30 min. DNA was purified by phenol-chloroform-isoamyl alcohol extraction (25:24:1), then precipitated with isopropanol in the presence of 0.5 M NaCl. The pellet was washed with 70% ethanol, allowed to air dry, and resuspended in 50 μL of TE buffer. The extract was stored at −20°C. DNA quality and quantity were assessed using a Nanodrop (Mettler Toledo UV5Nano) and electrophoresis on 0.8% agarose gel. The results indicated that the extracted DNA was of good quality, with absorbance ratios and gel profiles consistent with genomic DNA, making it suitable for further molecular analysis.
2.4.2. Polymerase chain reaction (PCR)
The molecular detection of P. aeruginosa and S. aureus was performed using conventional PCR targeting the gene encoding 16S rRNA. Thus, for P. aeruginosa, the primer pair PA-SS-F (5′-GGGGGATCTTCGGACCTCA-3′) and PA-SS-R (5′-TCCTTAGAGTGCCCACCCG-3′) was used to amplify a 956 bp fragment (Spilker et al. 2004). Concerning S. aureus, the primer pair 16S rRNA-F (5′-GTAGGTGGCAAGCGTTATCC-3′) and 16S rRNA-R (5′-CGCACATCAGCGTCAG-3′) was used to amplify a fragment of approximately 228 bp (Karmakar et al. 2016). The PCR amplification reaction was performed using the Go-Taq Polymerase Flexi 2 enzyme kit (Promega), with a 25 µl reaction mixture consisting of: 1X Gotaq buffer (Promega) of Taq polymerase (Promega) at 0.025 U/µl, 10 µM of each primer, 0.2 mM dNTPs (New England Biolabs), 1 mM MgCl2 (Promega) and 5 µl of DNA (200 ng). The amplification conditions were as follows for the 16S RNA gene of P. aeruginosa: a denaturation phase at 94°C for 5 min, followed by 35 cycles (denaturation: 94°C for 30 s, hybridization: 53°C for 30 s and elongation: 72°C for 1 min), with a final elongation at 72°C for 10 min. Concerning S. aureus, the amplification conditions were as follows for the 16S rRNA gene: a denaturation phase at 94°C for 5 min, followed by 35 cycles (denaturation: 94°C for 1 min, hybridization: 55°C for 1 min and elongation: 72°C for 1 min), with a final elongation at 72°C for 10 min. PCR products were detected using an automated gel reader (Gel Documentation System BL, Axygen) after electrophoresis in a 1.5% agarose gel containing SybrSafe in TAE buffer (1X).
2.5. Comparison test and representation of pathogen bacteria line plot
Statistical tests were required to analyze the data on pathogen bacteria distribution in hydroelectric reservoirs. This includes the Shapiro-Wilk test, followed by Kruskal-Wallis and U Mann-Whitney tests. RStudio 4.1.2 software was used to perform these tests and the significance level is 0.05. A Spearman test was performed to examine the correlation between pathogen bacteria. Principal Component Analysis (PCA) was used to show the distribution of bacteria according to the sampling sites. The ade4 and factoextra packages were used for PCA implementation. Pathogen bacteria line plots, Spearman correlation analysis, and PCA were all carried out using RStudio software.
3. Results
3.1. Detection of P. aeruginosa and S. aureus
The genomic DNA extraction from colonies showed good integrity, confirmed by electrophoresis on 0.8% agarose gel, with high molecular weight DNA profiles. Absorbance ratios (A260/A280) ranged from 1.7 to 1.9, indicating sufficient purity for molecular analysis. Amplification of the 16S rRNA gene enabled specific detection of the two bacteria studied. The primer pairs PA-SS-F/PA-SS-R generated a fragment of approximately 956 bp (Fig. 2), specific to P. aeruginosa. Similarly, using the primer pairs 16S rRNA-F/16S rRNA-R, a 228 bp fragment (Fig. 3) specific to S. aureus was obtained. No non-specific amplification was detected in the negative controls. Among 54 strains of each bacterium, only 18 strains of P. aeruginosa (33.3%) and 16 strains of S. aureus (29.6%) showed negative results for 16S rRNA gene amplification.
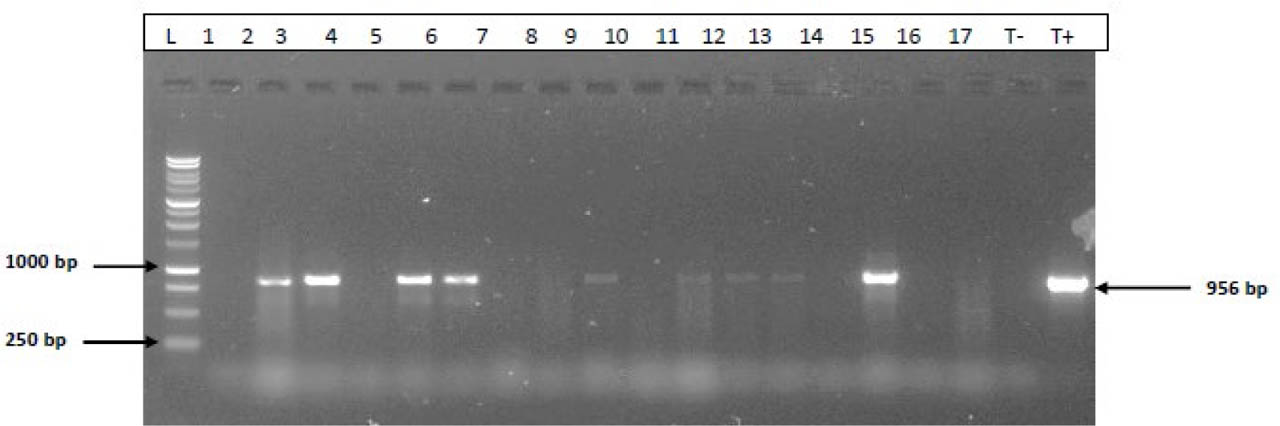
Fig. 2
Gel electrophoresis (1.5%) of amplified 16S rRNA gene products from P. aeruginosa. L: molecular weight marker (1kb); 1–17: samples; T-: negative control, T+: positive control (956 bp)
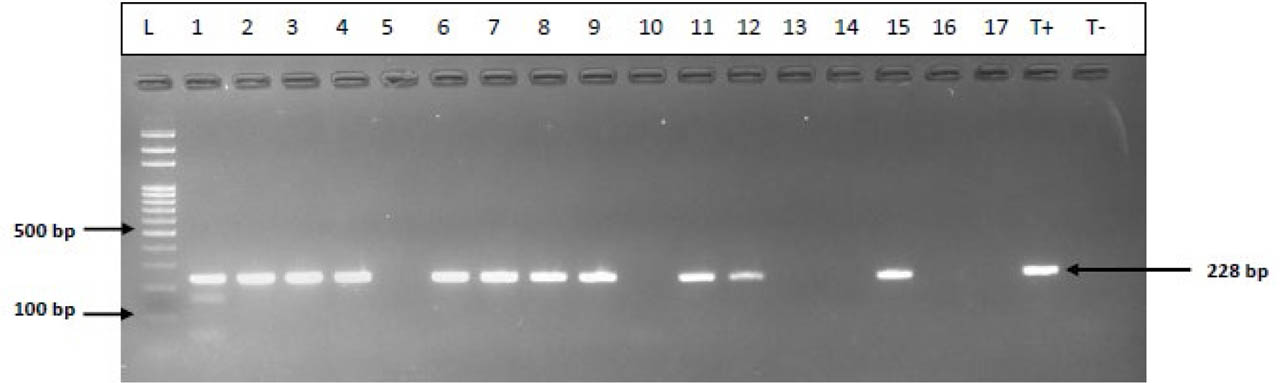
Fig. 3
Gel electrophoresis (1.5%) of amplified 16S rRNA gene products from S. aureus. L: molecular weight marker (100 bp); 1–17: samples; T-: negative control, T+: positive control (228 bp)
3.2. Spatial and temporal variation of pathogen bacteria abundance
The temporal variation of pathogen bacteria abundance in different reservoirs was observed to determine periods of high growth. Bacteria median concentrations ranged from 0.97 Log CFU/100 mL to 2.57 Log CFU/100 mL. The highest abundances of P. aeruginosa and S. aureus were generally recorded during the last four sampling months, namely June, July, September, and October (Fig. 4; Fig. 5).
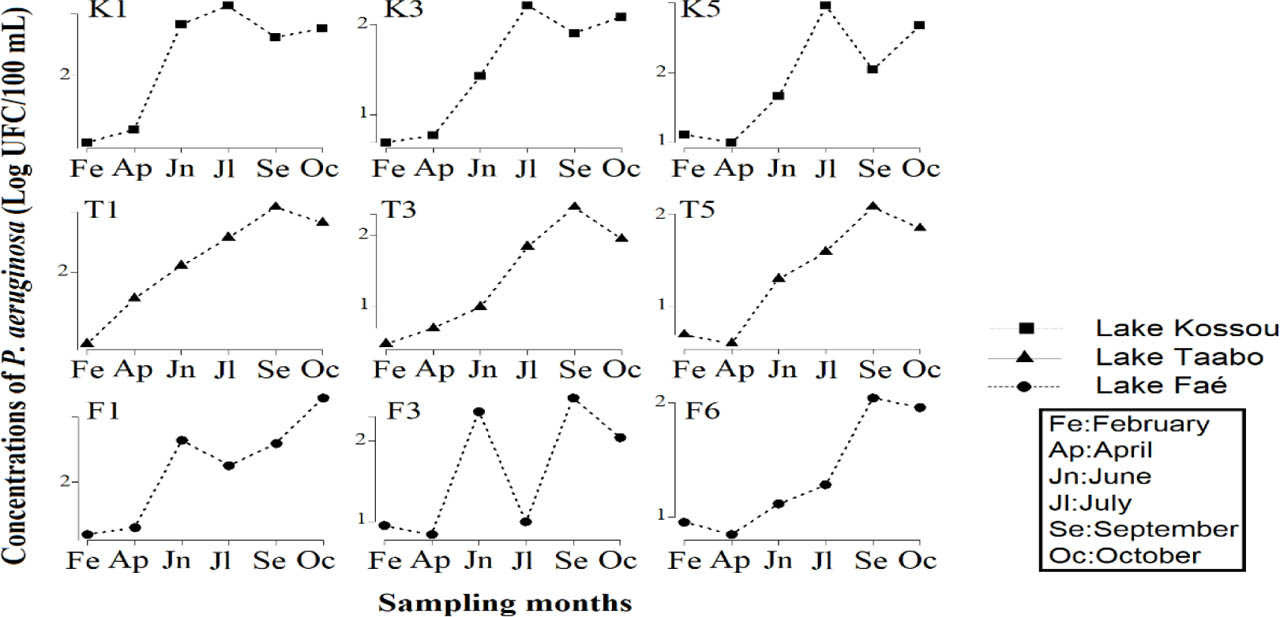
Fig. 4
Spatial and temporal variation of P. aeruginosa in hydroelectric reservoirs. Lake Kossou sampling sites: K1, K3, K5; Lake Taabo sampling sites: T1, T3, T5; Lake Faé sampling sites: F1, F3, F5.
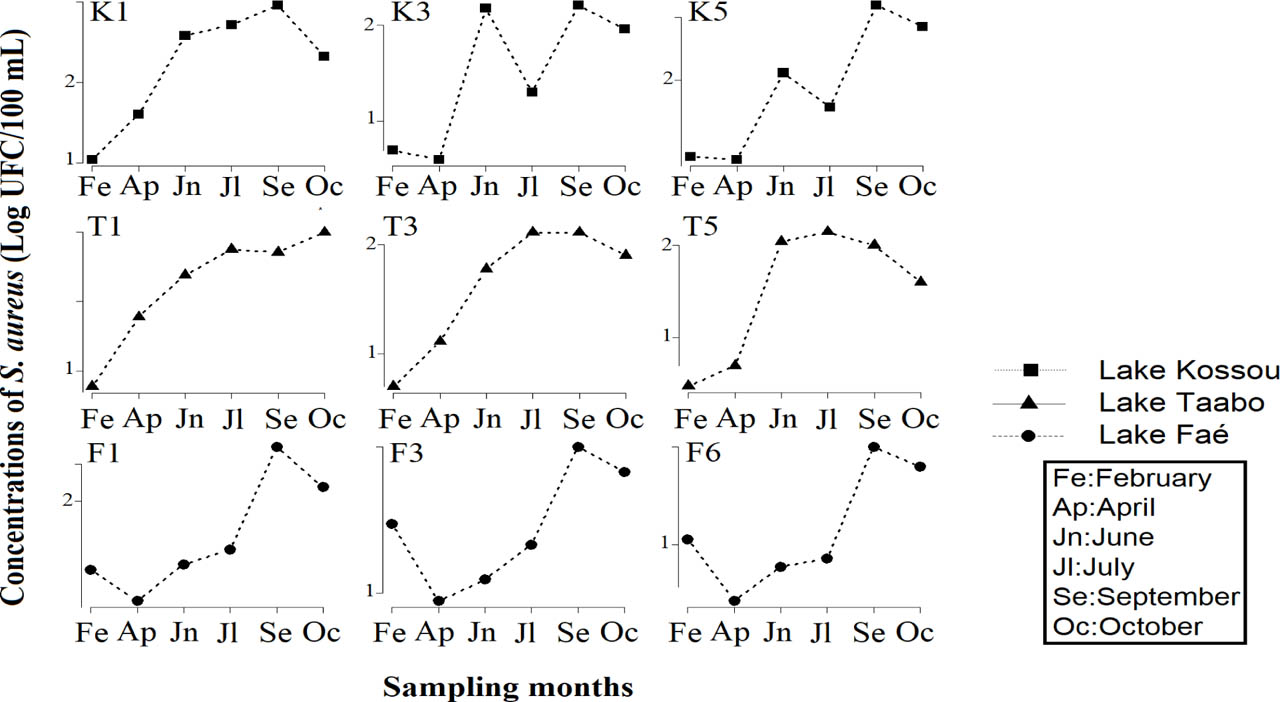
Fig. 5
Spatial and temporal variation of S. aureus in hydroelectric reservoirs. Lake Kossou sampling sites: K1, K3, K5; Lake Taabo sampling sites: T1, T3, T5; Lake Faé sampling sites: F1, F3, F5.
PCA revealed that the K1, T1, and F1 sampling sites recorded high overall concentrations of P. aeruginosa and S. aureus, respectively, for the Kossou, Taabo, and Faé reservoirs (Fig. 6). The highest concentrations of pathogen bacteria were therefore obtained in shore areas in the different reservoirs. The Kruskal-Wallis test revealed no significant differences in the concentrations of P. aeruginosa recorded at the different sampling points for each reservoir (Lake Taabo: p = 0.1171; Lake Kossou: p = 0.3123; Lake Faé: p = 0.09281). There were also no significant differences in S. aureus concentrations between sampling points in Lake Taabo (Kruskal-Wallis: p = 0.1528) and Lake Kossou (Kruskal-Wallis: p = 0.2636). However, in Lake Faé, the Mann-Whitney test (pF1-F5 = 0.04307) revealed a significant difference in S. aureus concentrations between F1 and F5.
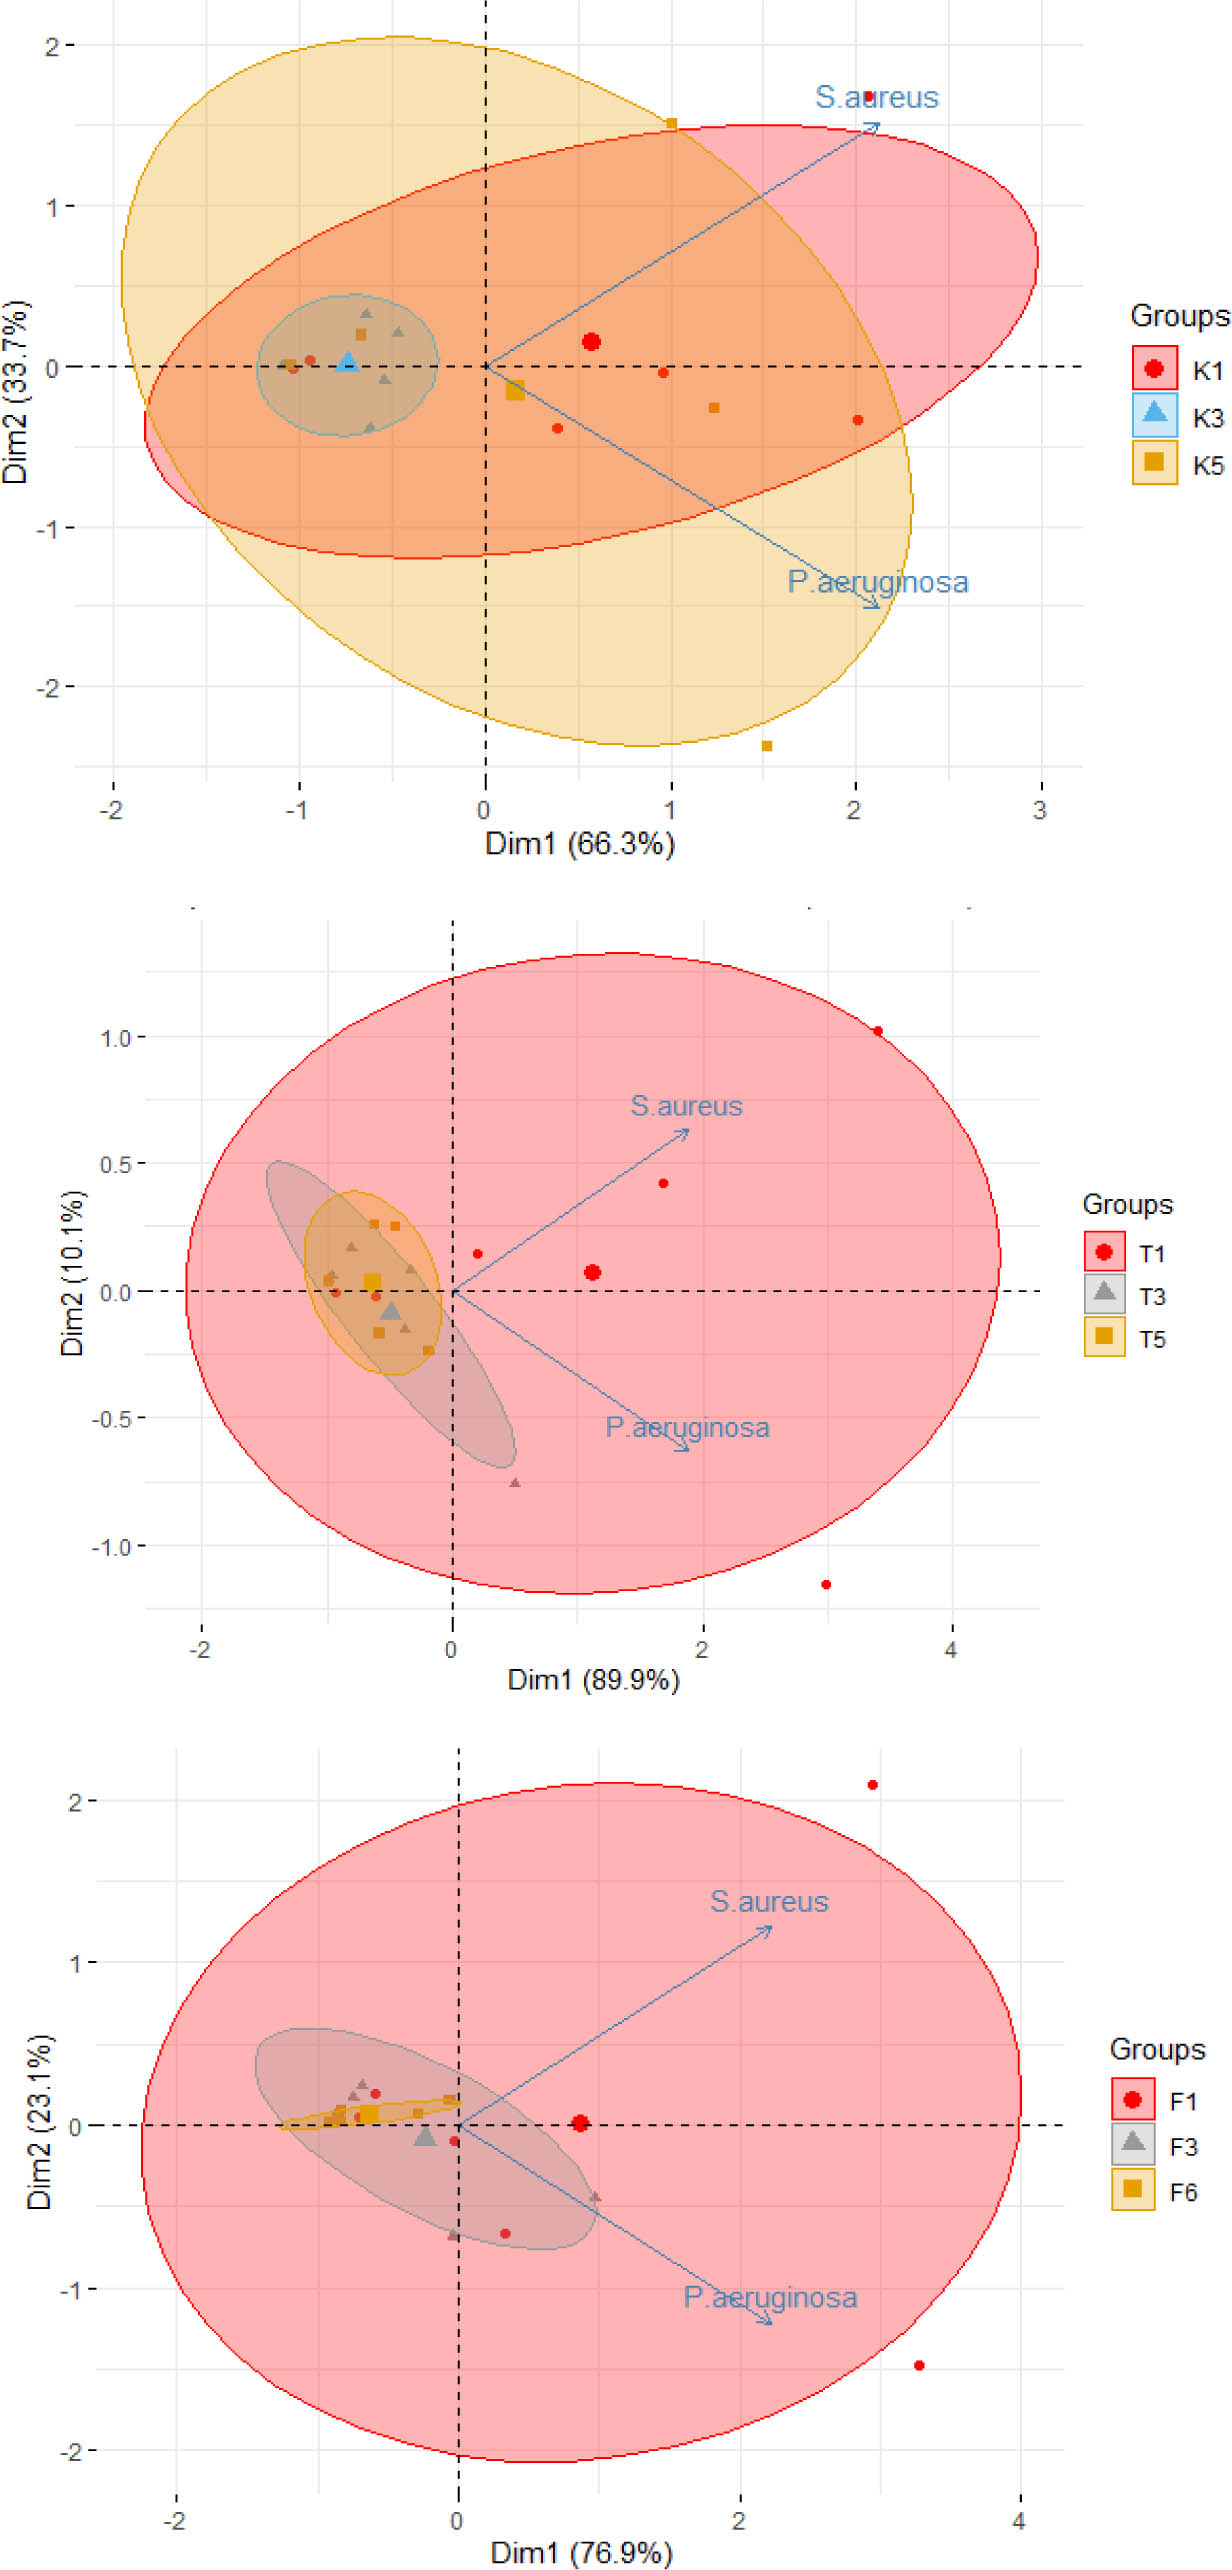
Fig. 6
Principal Component Analysis (PCA) on the distribution of bacteria; Pseudomonas aeruginosa: P. aeruginosa; Staphylococcus aureus: S. aureus; Lake Kossou sampling sites: K1, K3, K5; Lake Taabo sampling sites: T1, T3, T5; Lake Faé sampling sites: F1, F3, F6
3.3. Relation between pathogen bacteria in reservoirs
Correlation relationships between pathogenic bacteria were studied in all hydroelectric reservoirs (Fig. 7). The results indicated weak correlations between these pathogenic bacteria.
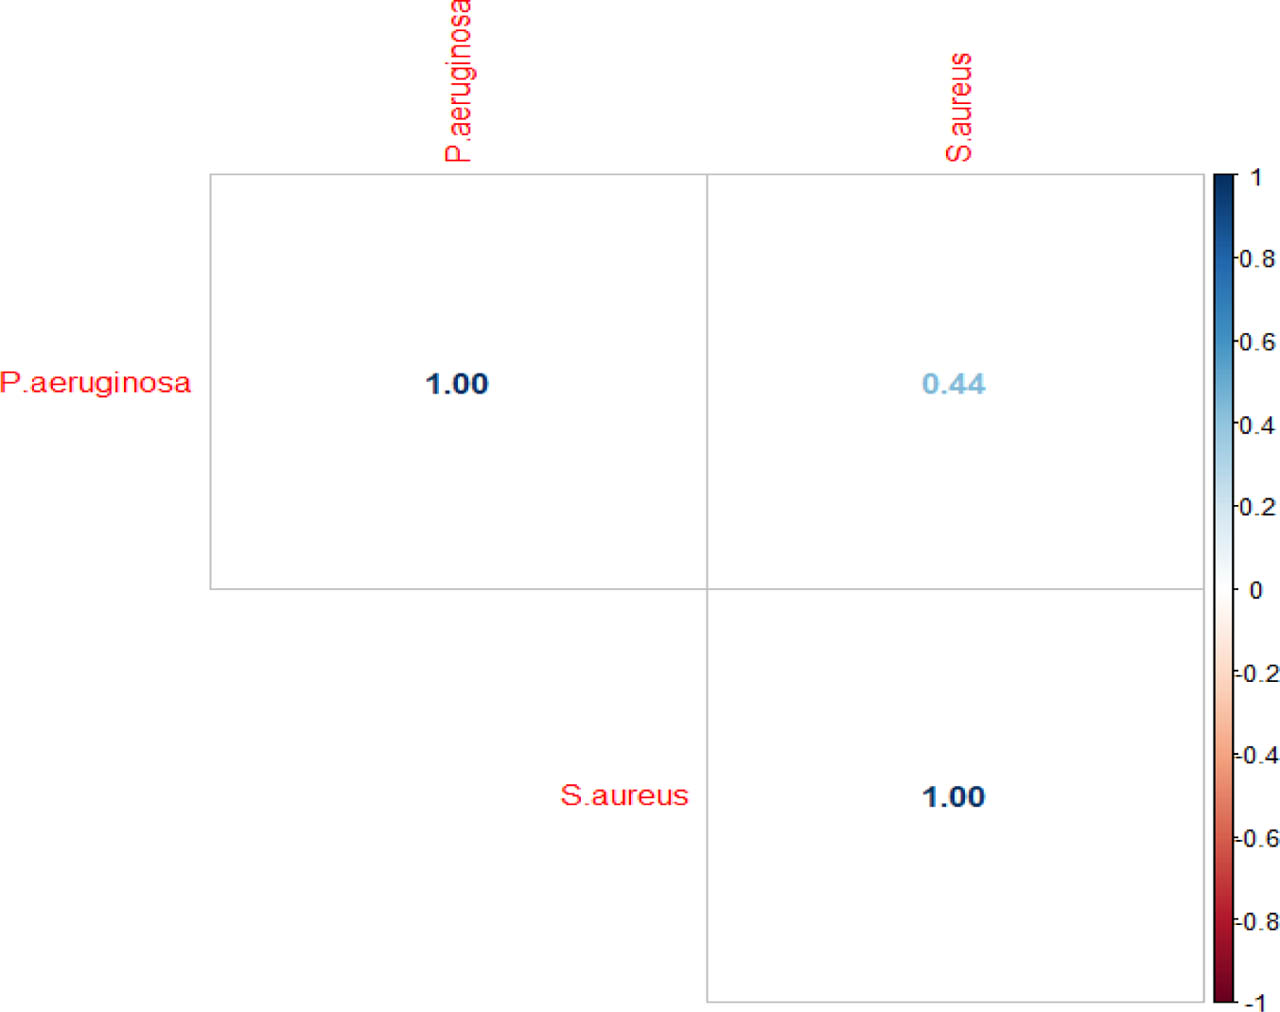
Fig. 7
Relation between pathogen bacteria in all hydroelectric reservoirs
4. Discussion
The primer pairs PA-SS-F/PA-SS-R generated a fragment of approximately 956 bp, specific to P. aeruginosa. Similarly, using the primer pairs 16S rRNA-F/16S rRNA-R, a 228 bp fragment specific to S. aureus was obtained. No non-specific amplification was detected in the negative controls. These results confirm the accuracy of the applied primers for the rapid and specific detection of P. aeruginosa and S. aureus from pure bacterial colonies. The molecular detection of P. aeruginosa and S. aureus from colonies confirmed the results of microbiological tests carried out in the Kossou, Taabo, and Faé reservoirs. These results highlight the usefulness of combining culture methods and PCR for analyzing bacteria, as this increases the reliability of diagnoses and speeds up the identification of pathogens present in the environment. These observations are also consistent with the conclusions of the study conducted by Adingra et al. (2012) on the Grand-Lahou lagoon, which already reported the regular presence of P. aeruginosa and S. aureus. However, the negative results for 16S rRNA gene amplification could be linked to the quantity of bacterial DNA being below the detection limit of PCR or to the potential presence of PCR inhibitors (Akram et al. 2017).
The highest abundances of P. aeruginosa and S. aureus were generally recorded during the last four sampling months, namely June, July, September, and October. The sampling months with the highest levels of pathogenic bacteria abundance in hydroelectric reservoirs are characterized by intense rainy periods. This could explain the high abundance of bacteria. Indeed, during rainy periods, wastewaters, sewage, and faecal matter are rapidly discharged into surface waters, simultaneously releasing multiple bacterial species, particularly those linked to the activities practiced in the watersheds (Coulibaly-Kalpy et al. 2016; Kiran et al. 2018; Saturday et al. 2021). Several researchers showed that these hydroelectric reservoirs are influenced by human activities in the watersheds and upstream (Da costa and Diétoa 2007; Groga et al. 2012; Koné 2012; Kouao et al. 2012).
The highest concentrations of pathogen bacteria were obtained in shore areas in the different reservoirs. This could be due to the fact that shore areas are the primary receptors of anthropogenic discharges. These different sampling points (T1, K1, K5, and F1) were characterized by household activities and livestock farmland. Faecal pollutants, wastewaters, and sewage resulting from these activities contribute to the degradation of water quality and the discharge of many pathogenic bacteria (Coulibaly-Kalpy et al. 2016; Kouamé et al. 2019; Chowdhary et al. 2020; Lin et al. 2022; Gamze et al. 2023). Esiobu et al. (2013) and Adriana et al. (2020) respectively showed the influence of human discharges on the variation in abundance of S. aureus and P. aeruginosa. Despite the river inflows, which cause continuous mixing of the reservoirs, the pathogenic bacteria remain concentrated in the littoral zones. This could also be due to the hydrodynamic processes of the reservoirs. Indeed, hydrodynamic conditions are less effective in these shallow areas, leading to reduced water circulation and the formation of retention zones. The lower dilution capacity, combined with higher organic matter availability and favorable environmental conditions, further supports bacterial persistence. Moreover, sediments in littoral zones can act as reservoirs for bacteria, which may be periodically resuspended into the water column (Brookes et al. 2003; Pachepsky and Shelton, 2011). Pathogen bacteria abundance levels show the utilization risk of the dam waters due to diseases that may be induced by these bacteria (Manizan et al. 2009; Coulibaly-Kalpy et al. 2016).
The results indicated also weak correlations between these pathogenic bacteria. These weak correlations could be due to the diversity of anthropogenic activities in catchment areas (Groga et al. 2012; Kouao et al. 2012). Indeed, each anthropogenic input, whether industrial, domestic or agricultural, could contribute differently to the growth of pathogenic bacteria (Zhang et al. 2021). Goh et al. (2019) also obtained weak correlations between pathogen bacteria present in reservoirs.
5. Conclusion
The aim of this study was to assess the variation in Pseudomonas aeruginosa and Staphylococcus aureus abundance in the Kossou, Taabo, and Faé reservoirs. Culture and PCR methods showed that both approaches can be used to achieve good results. The highest concentrations of pathogen bacteria were obtained in shore areas in the different reservoirs and during the last four sampling months, namely June, July, September, and October, characterized by intense rainy periods. Human activities continue to exert pressure on the microbial quality of these environments. These results highlight the importance of these reservoirs as areas where pathogens proliferate, exposing local populations to health risks linked to the water used for irrigation, fishing, or household chores. A comprehensive surveillance approach for other pathogenic bacteria, including quantitative techniques (qPCR) and the monitoring of antibiotic resistance, is recommended. However, it is important to establish protection zones around reservoirs and treat wastewaters before discharge.
Acknowledgments
We would like to thank Nangui Abrogoua University for facilitating travel for this study.