
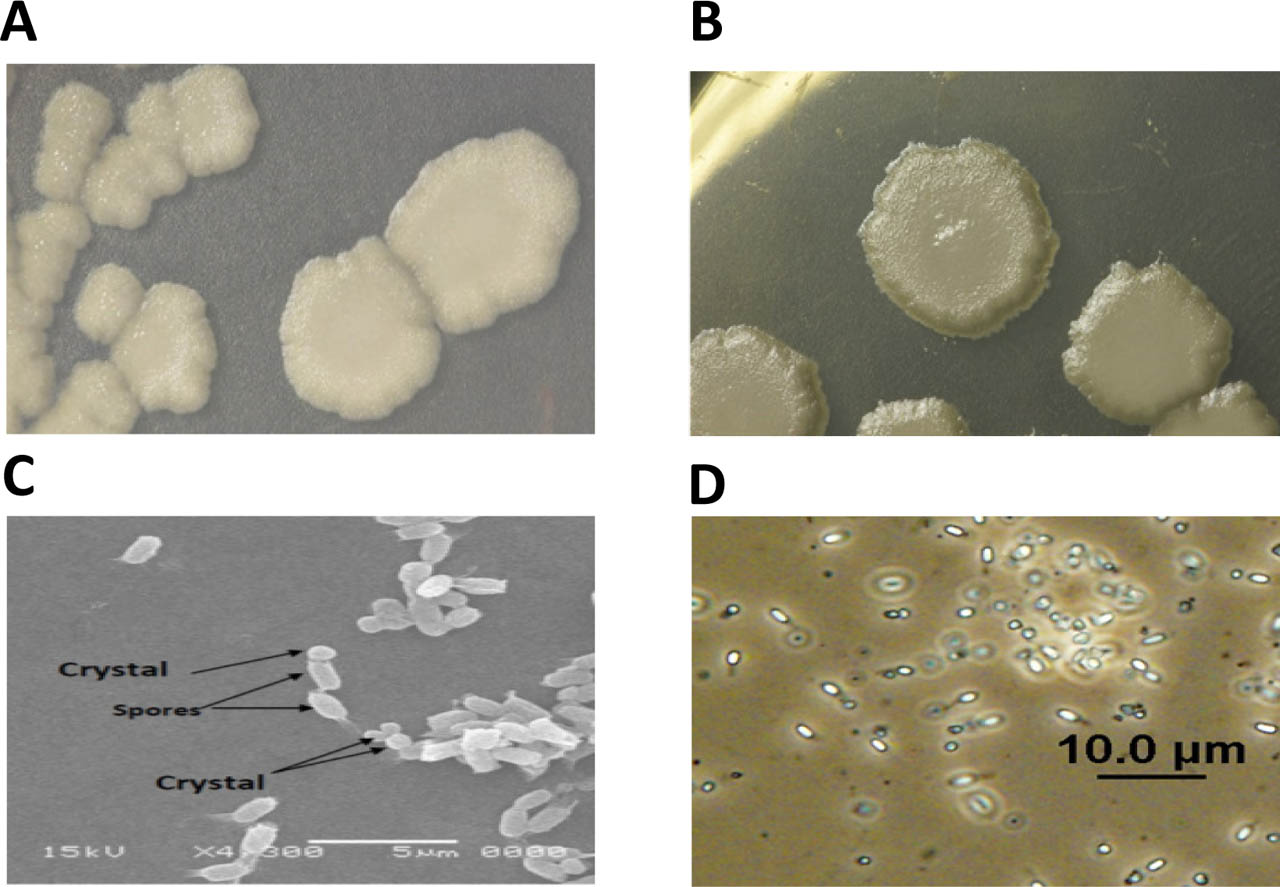
Figure 1:
Microscopic examination of the Bti H14 reference strain and Bt isolate M91. Photomicrographs showing colony morphology of Bti-H14 (A), whereas (B) shows colony morphology of native Bt M91. Colonies were seeded onto Luria Broth (LB) agar medium supplemented with MnCl2, exhibiting large, white, nearly circular colonies with fine, irregular margins and a glistening or non-glistening appearance. Bti H14 scanning electron microscopy (SEM) (C) and phase-contrast (D) at magnifications of X4, 300, and X1000, respectively.
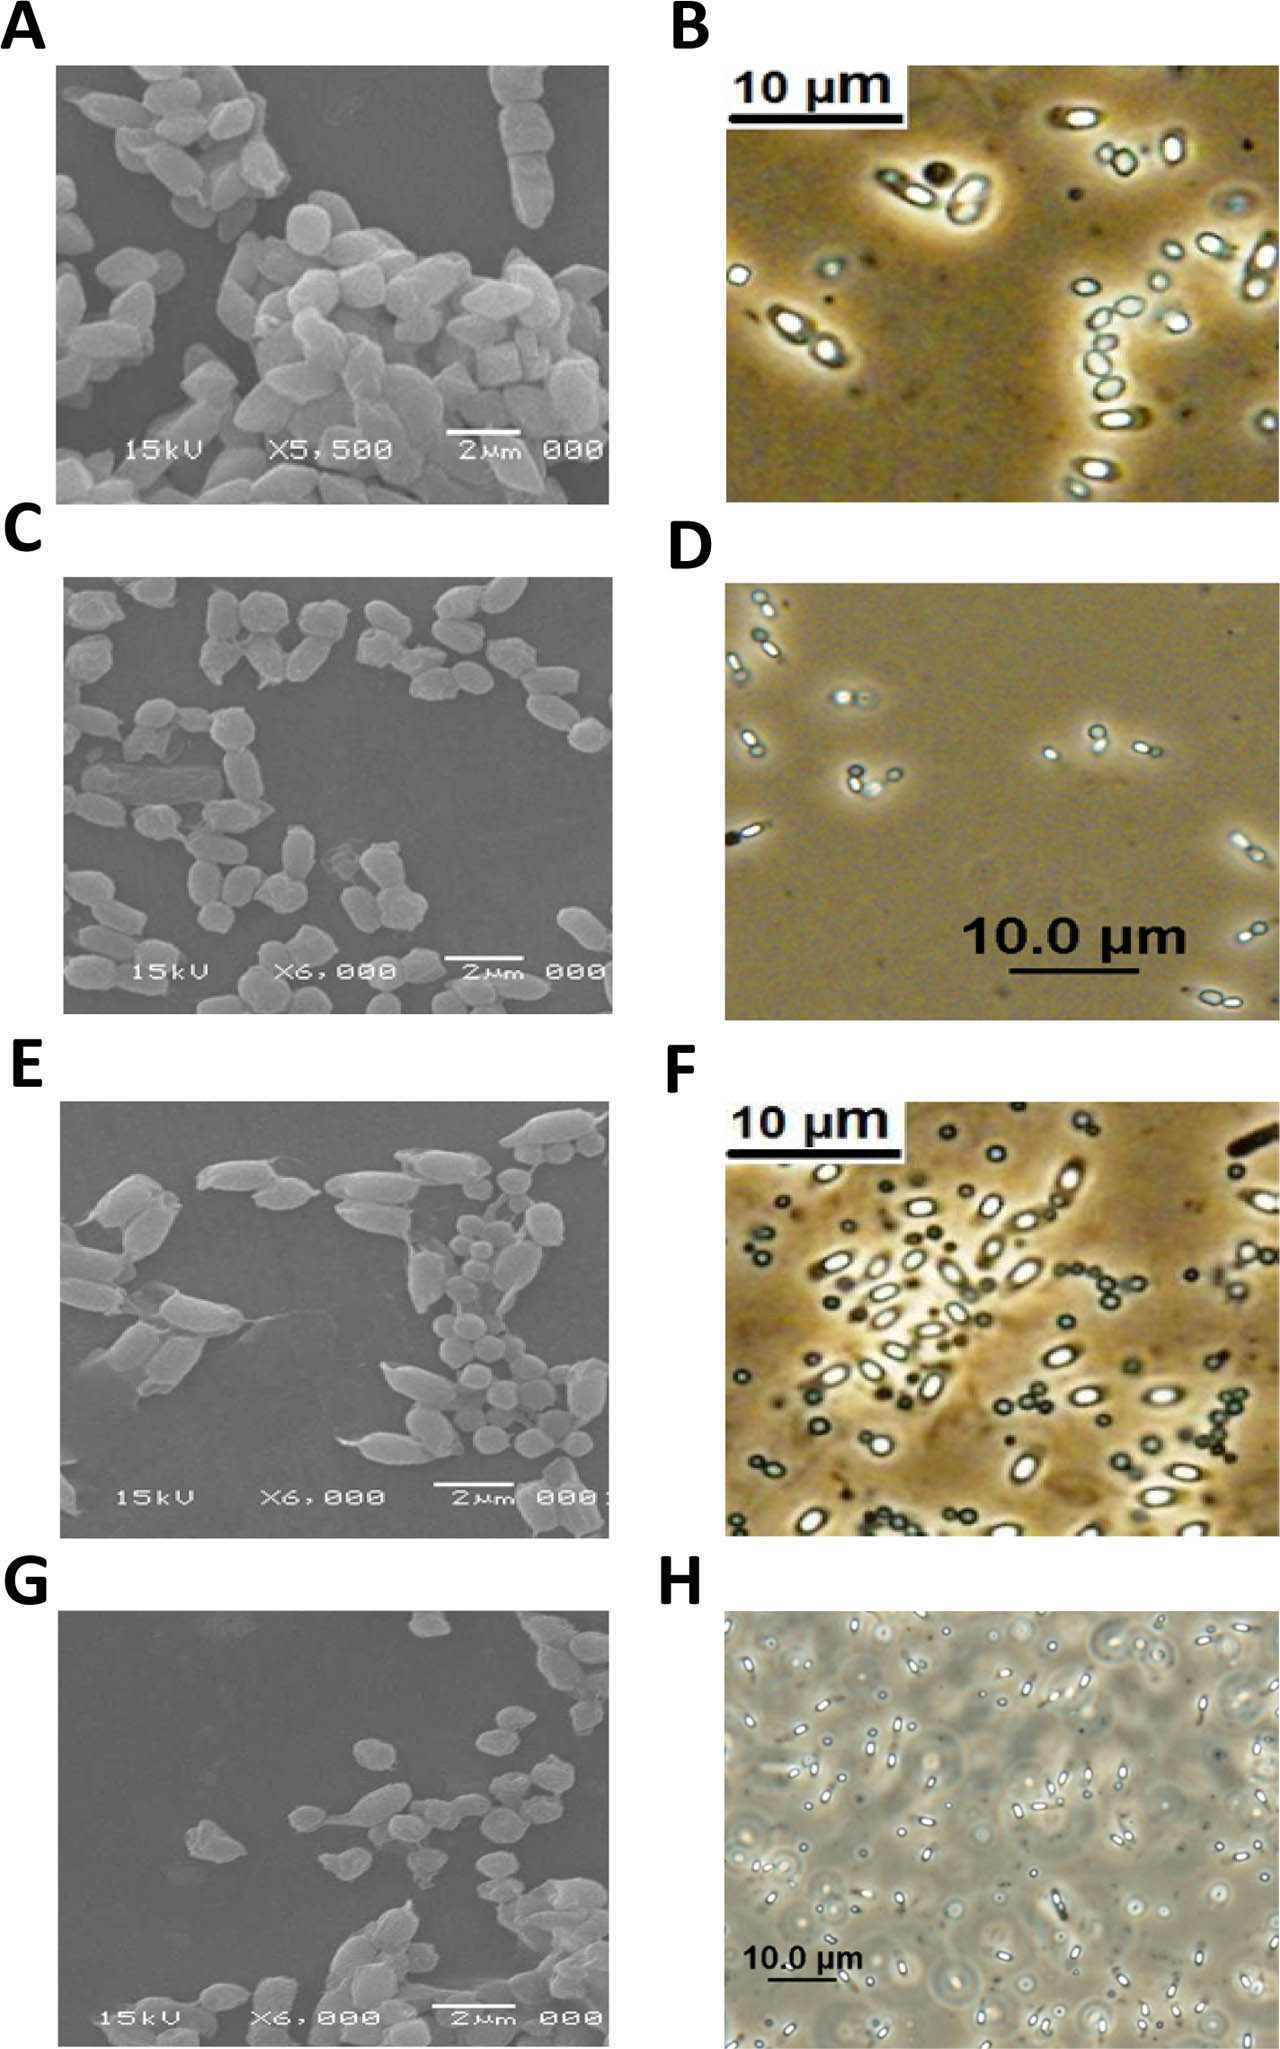
Figure 2.
Scanning electron microscopy and phase-contrast micrographs of native, non-insecticidal Bt isolates illustrating spores and the diversity of crystal shapes. (A and B) Bt-78 (bipyramidal-oval-square, non-spore-attached). (C and D) Bt-M91 (hexagonal, spore-attached). (E and F) Bt-M154t1 (spherical, non-spore-attached). (G and H) Bt-M11 (bipyramidal-square, spore-attached). In all cases, spores appear non-swollen, bright, and cylindrical, resembling those of the reference Bti H14 in Figure 1. 16S rRNA sequences, with reference accession numbers in NCBI GenBank® (https://www.ncbi.nlm.nih.gov/nuccore), when applicable, showed 99% similarity to our native Bt isolates (Li et al. 2013).
Table 1.
Oligonucleotide primers in the RT-qPCR assay (Al-Mebairik et al. 2016).
| Gene | Sequence (5′–3′) |
|---|---|
| spa | F: GCGCAACACGATGAAGCTCAACAA |
| R: ACGTTAGCACTTTGGCTTGGATCA | |
| hla | F: CTGAAGGCCAGGCTAAACCACTTT |
| R: GAACGAAAGGTACCATTGCTGGTCA | |
| 16S rRNA | F: CTGGTAGTCCACGCCGTAAAC |
| R: CAGGCGGAGTGCTTAATGC | |
| RNAIII | F: GCACTGAGTCCAAGGAAACTAACTCT |
| R: AGCCATCCCAACTTAATAACCATGT |
Table 2:
Sampling type of the 14 non-insecticidal B. thuringiensis isolates (lab code), their crystal shapes, and the qualitative and quantitative quenching effects of different AT protein concentrations on the expression of S. aureus spa and hla strains.
| Bt. Isolate (Code) sample | Crystal-Shape | Protein Conc. ug/ml | Spa | hla | ||||
|---|---|---|---|---|---|---|---|---|
| Effect | Bleaching zone (mm) | β-galactosidase Activity (MU) | Effect | Bleaching zone (mm) | β-galactosidase Activity (MU) | |||
| (M11) soil | Oval-spherical Nonattached to spores | 100 | + | 20±0.5 | 90±2.3 | + | 20±1.2 | 92±5.5 |
| 50 | + | 16±1 | 163±7.2 | + | 19±0.7 | 108±4.3 | ||
| 10 | − | 0 | 452±0 | − | 0 | 338±0 | ||
| (M13m) soil | Small spherical, not attached | 100 | + | 18±1 | 126±7.1 | + | 19±1.2 | 108±7.4 |
| 50 | + | 15.3±1.2 | 176.13.9 | + | 15±0.5 | 155±5.2 | ||
| 10 | − | 0 | 452±0 | − | 0 | 388±0 | ||
| (M67t) Soil | Small spherical | 100 | - | 0 | 452±0 | - | 0 | 388±0 |
| 50 | + | 25±1.2 | 0±0 | + | 20±.2 | 92±1.9 | ||
| 10 | − | 0 | 452±0 | − | 0 | 388±0 | ||
| (M 78) soil | Irregular, bi-pyramidal/cubic like crystals | 100 | + | 19.6±.3 | 100±1.4 | + | 21±1.2 | 62±3.6 |
| 50 | + | 16±0.5 | 163±5.1 | + | 14.3±1.2 | 167±14.1 | ||
| 10 | − | 0 | 452±0 | − | 0 | 388±0 | ||
| (M91) soil | Nearly cubic, attached to spore | 100 | + | 20±1.5 | 90±6.8 | + | 19.3±1.3 | 89±6.1 |
| 50 | − | 16.3±0.8 | 158±7.8 | − | 15.6±0.7 | 147±6.6 | ||
| 10 | − | 0 | 452±0 | − | 0 | 388±0 | ||
| (M154t1) Leaves/soil | Small, spherical non-attached to spore | 100 | + | 21.6±0.8 | 63±2.3 | + | 18.6±1.4 | 101±7.6 |
| 50 | + | 17±1.5 | 145±12.8 | + | 16.3±1.8 | 136±15.1 | ||
| 10 | − | 0 | 452±0 | − | 0 | 388±0 | ||
| (M157) Dried leaves | Bipyramidal, attached to spore | 100 | + | 19±1 | 109±5.8 | + | 19.6±0.8 | 85±3.5 |
| 50 | + | 15.3±0.8 | 176±9.2 | + | 17±1.2 | 124±8.7 | ||
| 10 | − | 0 | 452±0 | − | 0 | 388±0 | ||
| (M160) sheep manure | Blunt end bipyramidal attached to spore | 100 | + | 20.6±0.8 | 81±3.2 | + | 21±1 | 62±30 |
| 50 | + | 19±0.5 | 109±2.9 | + | 20±1.2 | 92±5.5 | ||
| 10 | − | 0 | 452±0 | − | 0 | 388±0 | ||
| (M224) soil | Big spherical and hexagonal with inclined spore | 100 | + | 18.3±1.2 | 122±8.0 | + | 20.6±1.5 | 70±5.1 |
| 50 | + | 15±1.2 | 181±14.5 | + | 16.6±1.2 | 132±9,6 | ||
| 10 | − | 0 | 452±0 | − | 0 | 388 | ||
| (M242) soil | bipyramidal, with blunt edges | 100 | + | 21.3±0.8 | 68±2.6 | + | 22.3±0.8 | 43±1.5 |
| 50 | − | 0 | 452±0 | − | 0 | 388±0 | ||
| 10 | − | 0 | 452±0 | − | 0 | 388±0 | ||
| (M268P) Sewage W | Hexagonal attached to spores in long chains) | 100 | − | 0 | 452±0 | − | 0 | 388±0 |
| 50 | − | 0 | 452±0 | − | 0 | 388±0 | ||
| 10 | − | 0 | 452±0 | − | 0 | 388±0 | ||
| (M296) soil | Large and small bipyramidal | 100 | − | 0 | 452±0 | − | 0 | 388±0 |
| 50 | + | 20.3±0.8 | 68±3.4 | + | 18.6±0.8 | 101±4.4 | ||
| 10 | − | 0 | 452±0 | − | 0 | 388±0 | ||
| (M300) Rain W | Dark and bright ovoid (attached to spore) | 100 | + | 24±0.5 | 18±0.4 | + | 23.3±0.8 | 27±0.9 |
| 50 | − | 0 | 452±0 | − | 0 | 388±0 | ||
| 10 | − | 0 | 452±0 | − | 0 | 388±0 | ||
| A11 soil | Spherical non-spore attached | 100 | + | 16.6±1.2 | 154±11.2 | + | 19±0.5 | 93±2.5 |
| 50 | + | 13±1.7 | 217±29.7 | + | 15.6±0.8 | 147±7.6 | ||
| 10 | − | 0 | 452±0 | − | 0 | 388±0 | ||
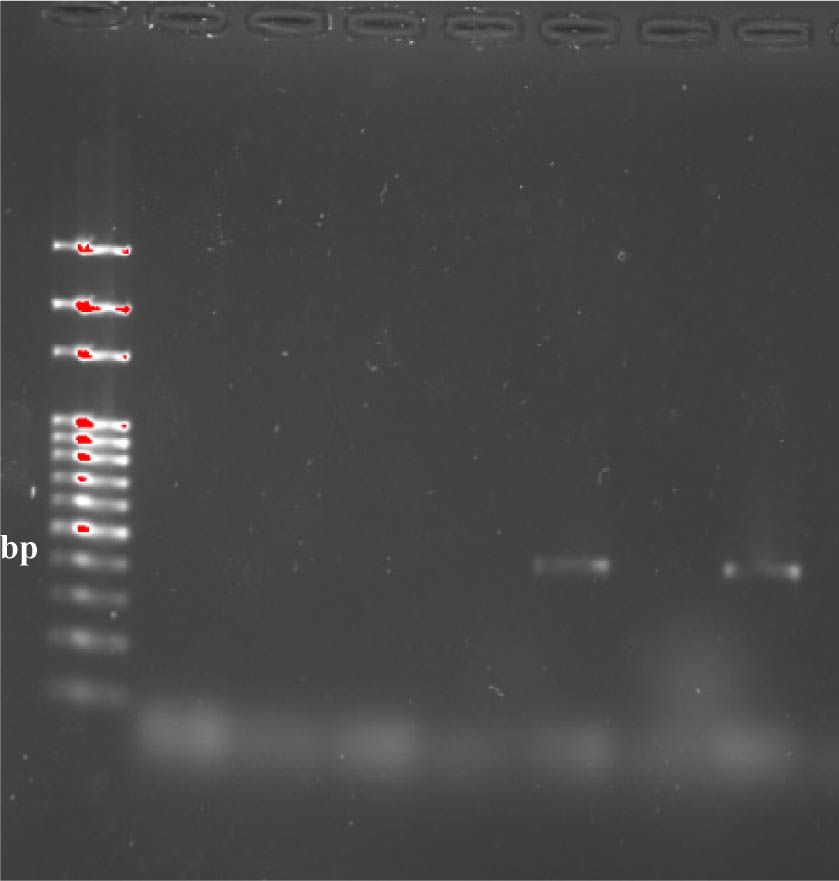
Figure 3.
PCR screening of Bt isolates for Cyt1 genes. Amplicons were resolved on 1.5% agarose gels containing ethidium bromide at 80 V for 40 min. Lane (L) contains the 1500 bp DNA standard marker for band size identification. Four Bt strains were negative for Cyt1 genes, except for isolate M91. The reference strain Bacillus thuringiensis subsp. israelensis (Bti H14) and deionized water were included as positive and negative controls, respectively.
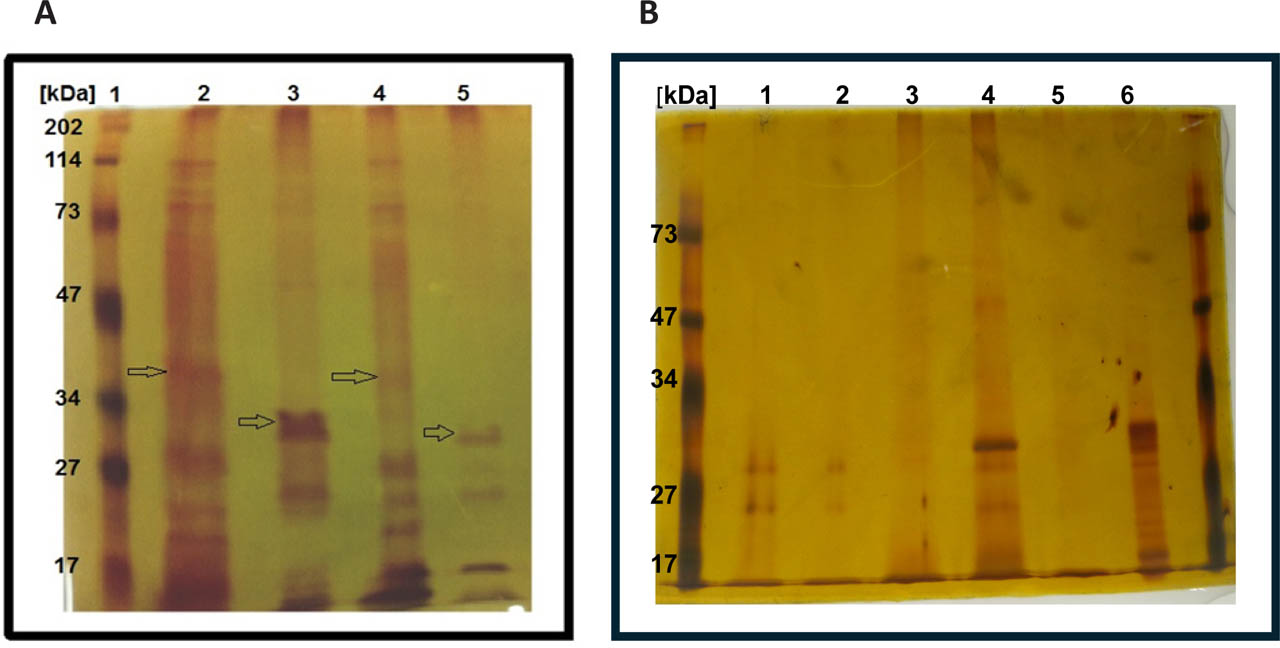
Figure 4.
Protein profiles of unactivated (PT) and activated (AT) parasporal crystal proteins (PCPs). Samples from strains M11, M78, M91, M154t, and A11 were run on a 12% SDS-PAGE gel and silver-stained to visualize protein bands. (A): M11 and M78. Lane 1, molecular marker; Lane 2: M11 strain, unactivated PC proteins loaded 100μl (100μg), bands at 111 kDa, 82 kDa, 58 kDa, 35 kDa, 27 kDa, 24 kDa, and 21 kDa; Lane 3, M11 strain, activated PC proteins (trypsinized) loaded 100μl (60μg/ml), bands at 28 kDa, 24 kDa, and 17 kDa; Lane 4: M78, unactivated PC proteins loaded 100μl (100μg), bands at 111 kDa, 82 kDa, 58 kDa, 35 kDa, 27 kDa, and 21 kDa; Lane 5, M78 strain, activated PC proteins (trypsinized) loaded 100μl (30μg), bands at 28 kDa, 24 kDa, and 17 kDa. (B): M91, M154t, and A11. Lane 1: M91 strain, unactivated PC protein, loaded 100μl (20μg), bands at 28 and 26 kDa; Lane 2: M91 activated PC proteins (trypsinized) loaded 100μl (20μg/ml), very faint bands at 28 and 26 kDa; Lane 3: M154t activated PC proteins (trypsinized) loaded 100μl (50μg/ml), faint bands at 28 and 26 kDa. Lane 4: M154t unactivated PC proteins loaded 100μl (50μg), bands at 30, 28, and 26 kDa; Lane 5: A11 activated PC proteins (trypsinized) loaded 100μl (50μg), faint bands at 28 and 26 kDa. Lane 6: A11 unactivated PC proteins loaded 100μl (50μg), bands at 32, 30, 28, 26, 24, 22, and 17 kDa.
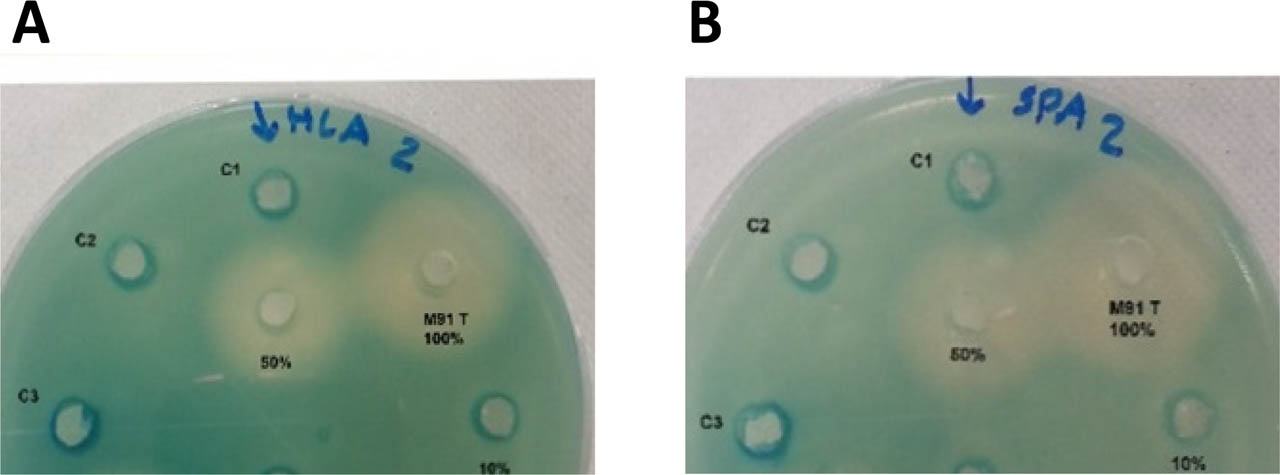
Figure 5.
Representative results showing the transcriptional effects of the Bt (M91) isolate AT (activated toxin, undiluted; M91 T (100%); and 50%-diluted AT) on S. aureus virulence genes (A) hla and (B) spa. To agar plates containing PC322 (hla::lacZ) (A) or PC203 (spa::lacZ) (B), 50 μL of Bt AT at the indicated concentrations [(100% (100 μg); 50% (50 μg); 10% (10 μg)] was added. Plates were incubated for 24 h at 37 °C. Controls: C1: saline; C2: alkaline buffer; C3: trypsin.
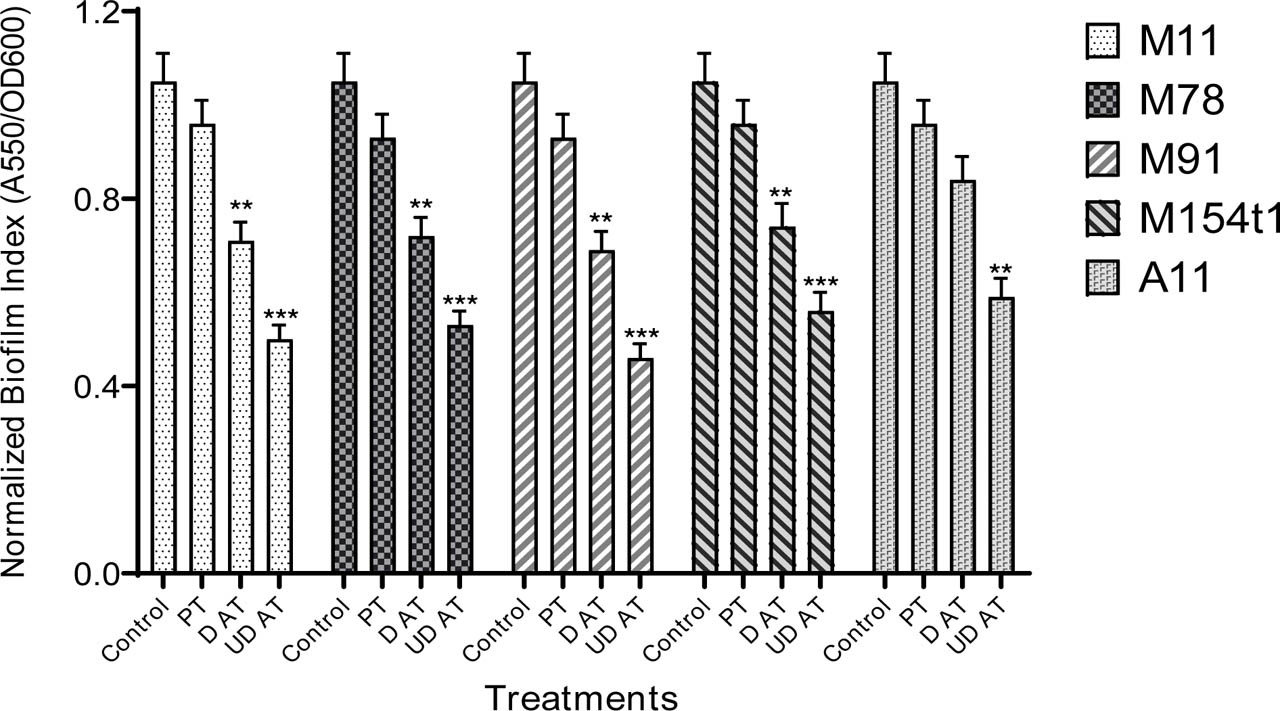
Figure 6.
The effect of Bt-derived PCPs either AT (diluted, D or undiluted, UD) or PT on S. aureus normalized biofilm index (NBI), compared to saline control. Biofilm formation was determined by an OD550 nm reading of crystal violet stain solubilized by ethanol with saline treatment as a control. NBI was calculated by dividing A550 over OD600. NBI for the isolate M11 was tested on PC322 (hla::lacZ). Data are presented as the mean ± standard error of means (SEMs). One-way ANOVA was conducted followed by Tukey's multiple comparison test to compare the mean of each treatment with the control. *p<0.05, **p<0.01, ***p<0.001. NBI for the isolate M78 was tested on PC322 (hla::lacZ). NBI for the isolate M91 was tested on PC203 (spa::lacZ) biofilm formation. NBI for the isolate M154t1 was tested on PC203 (spa::lacZ). NBI for the of Bt A11 isolate was tested on MRSA (ATCC 43300). Data points are the average of two independent growth experiments and three technical replicates.
Table 3.
Hemolytic activity of native Bt isolates on sheep blood agar.
| Bt isolate | Type of hemolysis | Hemolytic activity |
|---|---|---|
| Positive Control (S. aureus ATCC 25923) | β | + |
| M11 | γ | − |
| M78 | γ | − |
| M91 | γ | − |
| M154t1 | γ | − |
| A11 | γ | − |
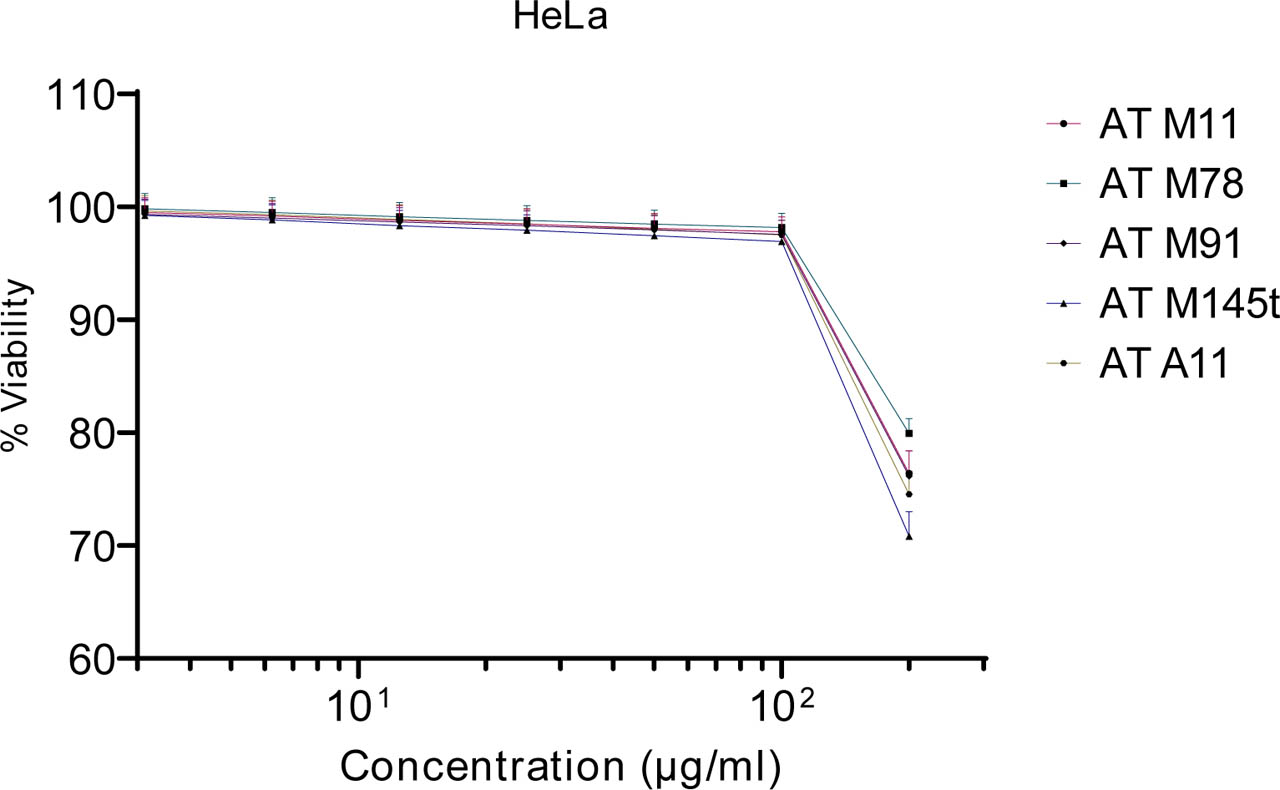
Figure 7.
MTT toxicity evaluation of AT PCPs derived from five Bt isolates against HeLa cervical cancer cells. Cell viability was normalized to the DMSO-treated control, whose final concentration didn't exceed 2%. Yellow MTT is enzymatically reduced by cellular dehydrogenases to form purple formazan crystals. Absorbance was measured at 570 nm, and background was subtracted by deducting the absorbance at 630 nm. Data represent means±SD of two experiments with 8 replicates for each concentration.
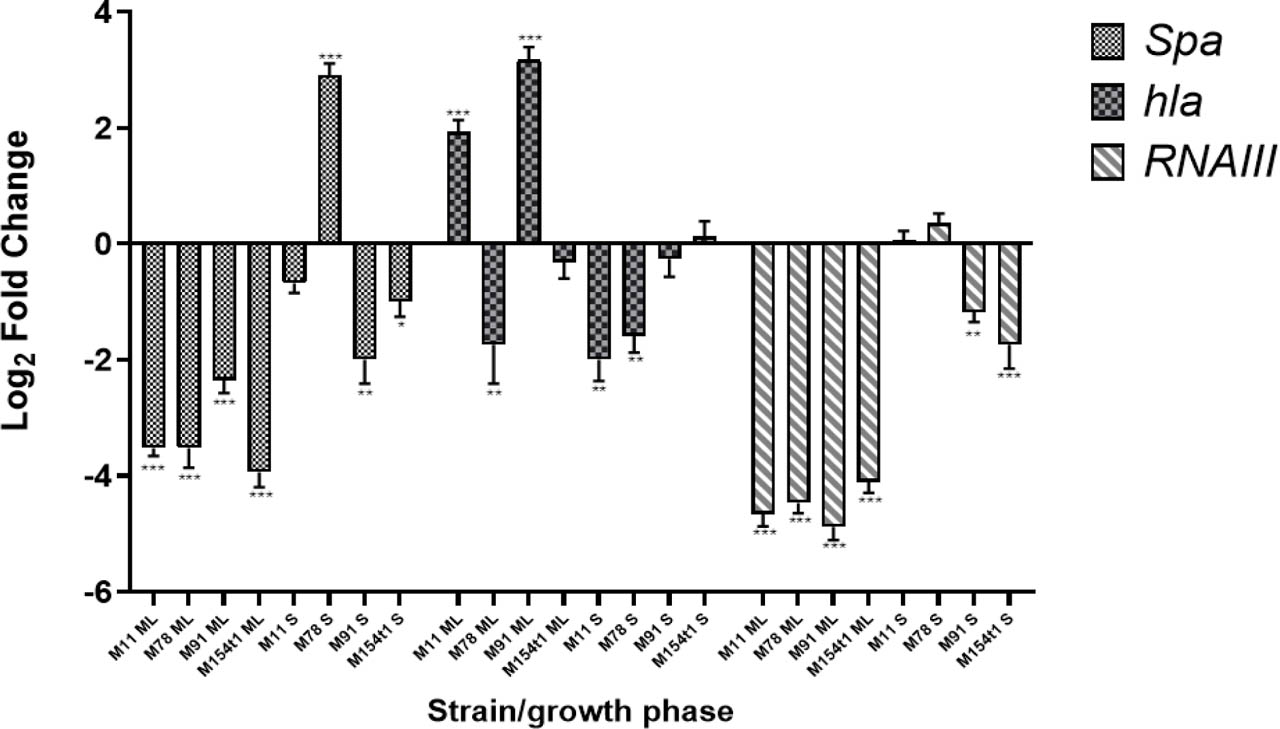
Figure 8.
Quantitative RT-PCR expression profiling of S. aureus MSSA (ATCC 29213) spa, hla, and RNAIII genes. S. aureus was treated with a single concentration of 100 μg/ml of PCPs AT toxins derived from M11, M78, M91, and M154t1Bt isolates during the mid-log phase (ML-) or stationary phase (S). DMSO served as the negative control (basal expression level). Data are presented as log2 fold change, with mean ± SEMs from two independent experiments and three technical replicates, calculated by 2-ΔΔCT. *p<0.05, **p<0.01, and ***p<0.001.