
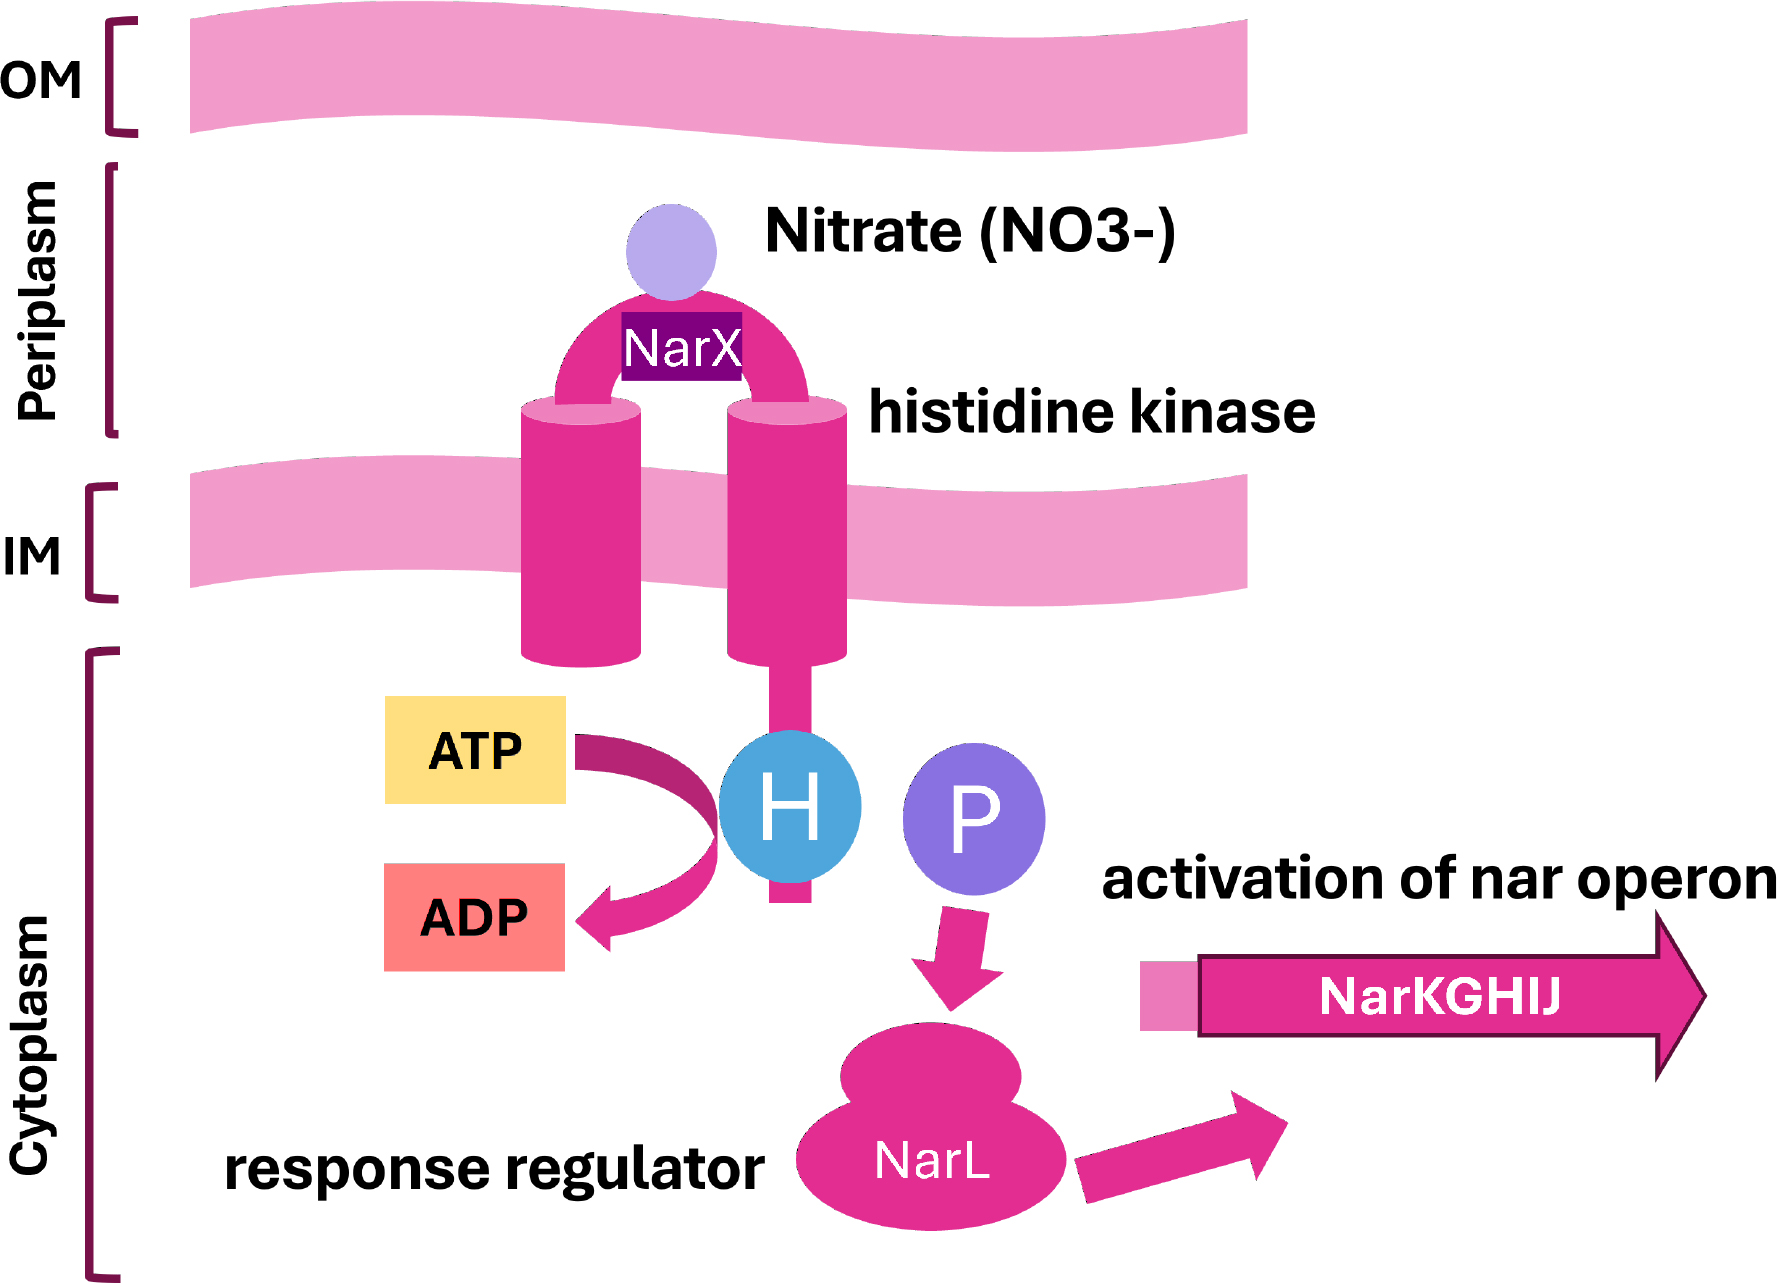
Figure 1.
The general mechanism of action of two-component regulatory systems.
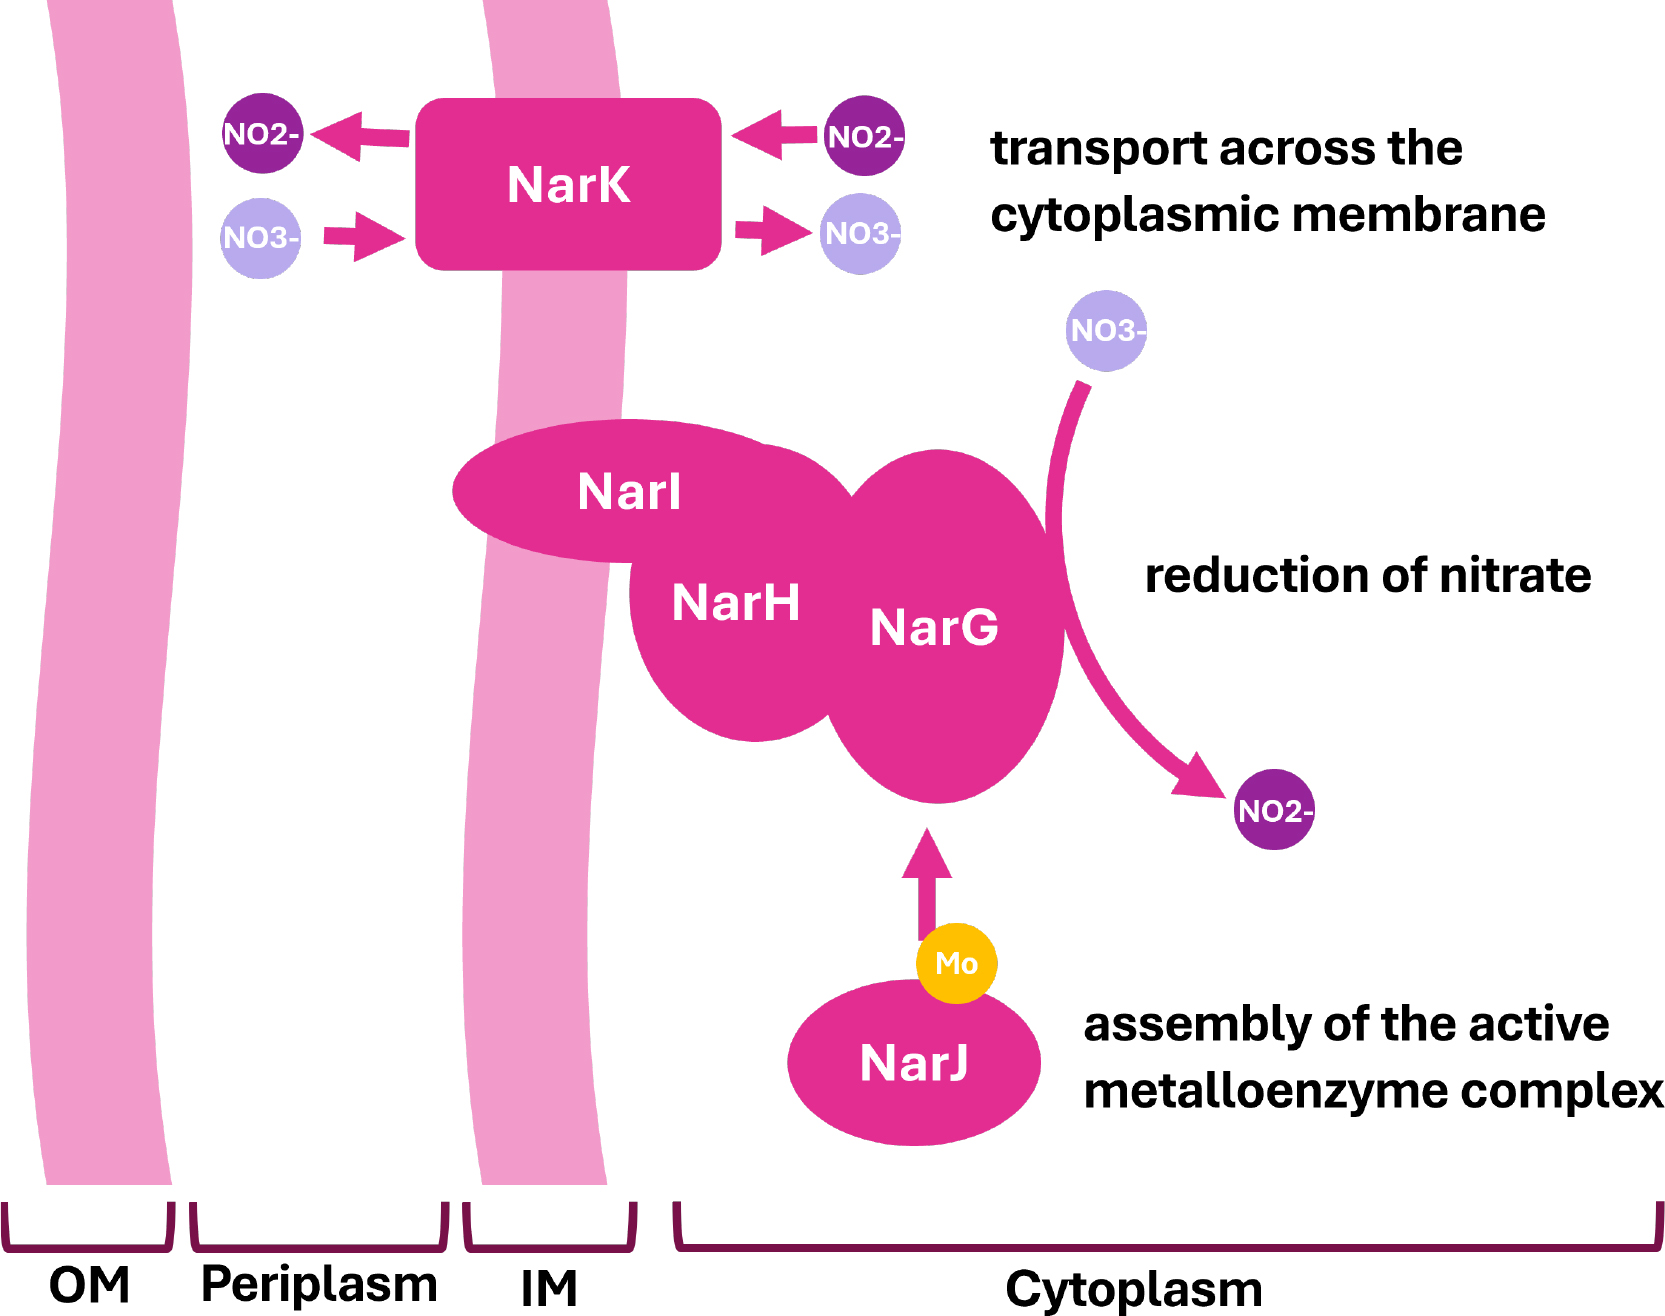
Figure 2.
The general mechanism of action nar nitrate reductase and nitrate/nitrite antiporter NarK.
Table I.
NarXL-regulated operons in E. coli associated with anaerobic metabolism and response to the presence of nitrate.
| Genes | Regulation | Function | Source |
|---|---|---|---|
| adhE | Repression | Bifunctional aldehyde-alcohol dehydrogenase | (Membrillo-Hernández and Lin 1999) |
| aspA | Repression | Aspartate ammonia-lyase | (Goh et al. 2005) |
| caiF | Repression | Transcriptional activatory protein | (Eichler et al. 1996) |
| dcuB-fumB | Repression | Anaerobic C4-dicarboxylate transporter/Fumarate hydratase class I, anaerobic | (Golby et al. 1998) |
| dcuSR | Repression | TCS responding to external C4-dicarboxylates | (Goh et al. 2005) |
| dmsABC | Repression | DMSO/TMAO reductase, anaerobic | (Bearson et al. 2002) |
| fdnGHI | Activation | Formate dehydrogenase-N | (Li et al. 1994) |
| focA-pflBA | Repression | Formate channel/pyruvate-formate lyase | (Kaiser and Sawers 1995) |
| frdABCD | Repression | Fumarate reductase | (Li et al. 1994) |
| hyaABCDEF | Repression | Hydrogenase 1 | (Richard et al. 1999) |
| hybOABCDEFG | Repression | Hydrogenase-2 | (Richard et al. 1999) |
| napFDAGHBC | Repression | Periplasmic nitrate reductase | (Stewart et al. 2003) |
| nirB | Activation | Nitrite reductase (NADH) large subunit | (Tyson et al. 1994) |
| nrfABCDEFG | Activation | Formate-dependent nitrate reductase | (Tyson et al. 1994) |
| nuoABCEFGH-IJKLMN | Activation | Respiratory complex I | (Bongaerts et al. 1995) |
| yeaR-yoaG | Activation | Unknown | (Lin et al. 2007) |
| ynfEFGHI | Repression | Putative dimethyl sulfoxide reductase chain | (Xu et al. 2009) |
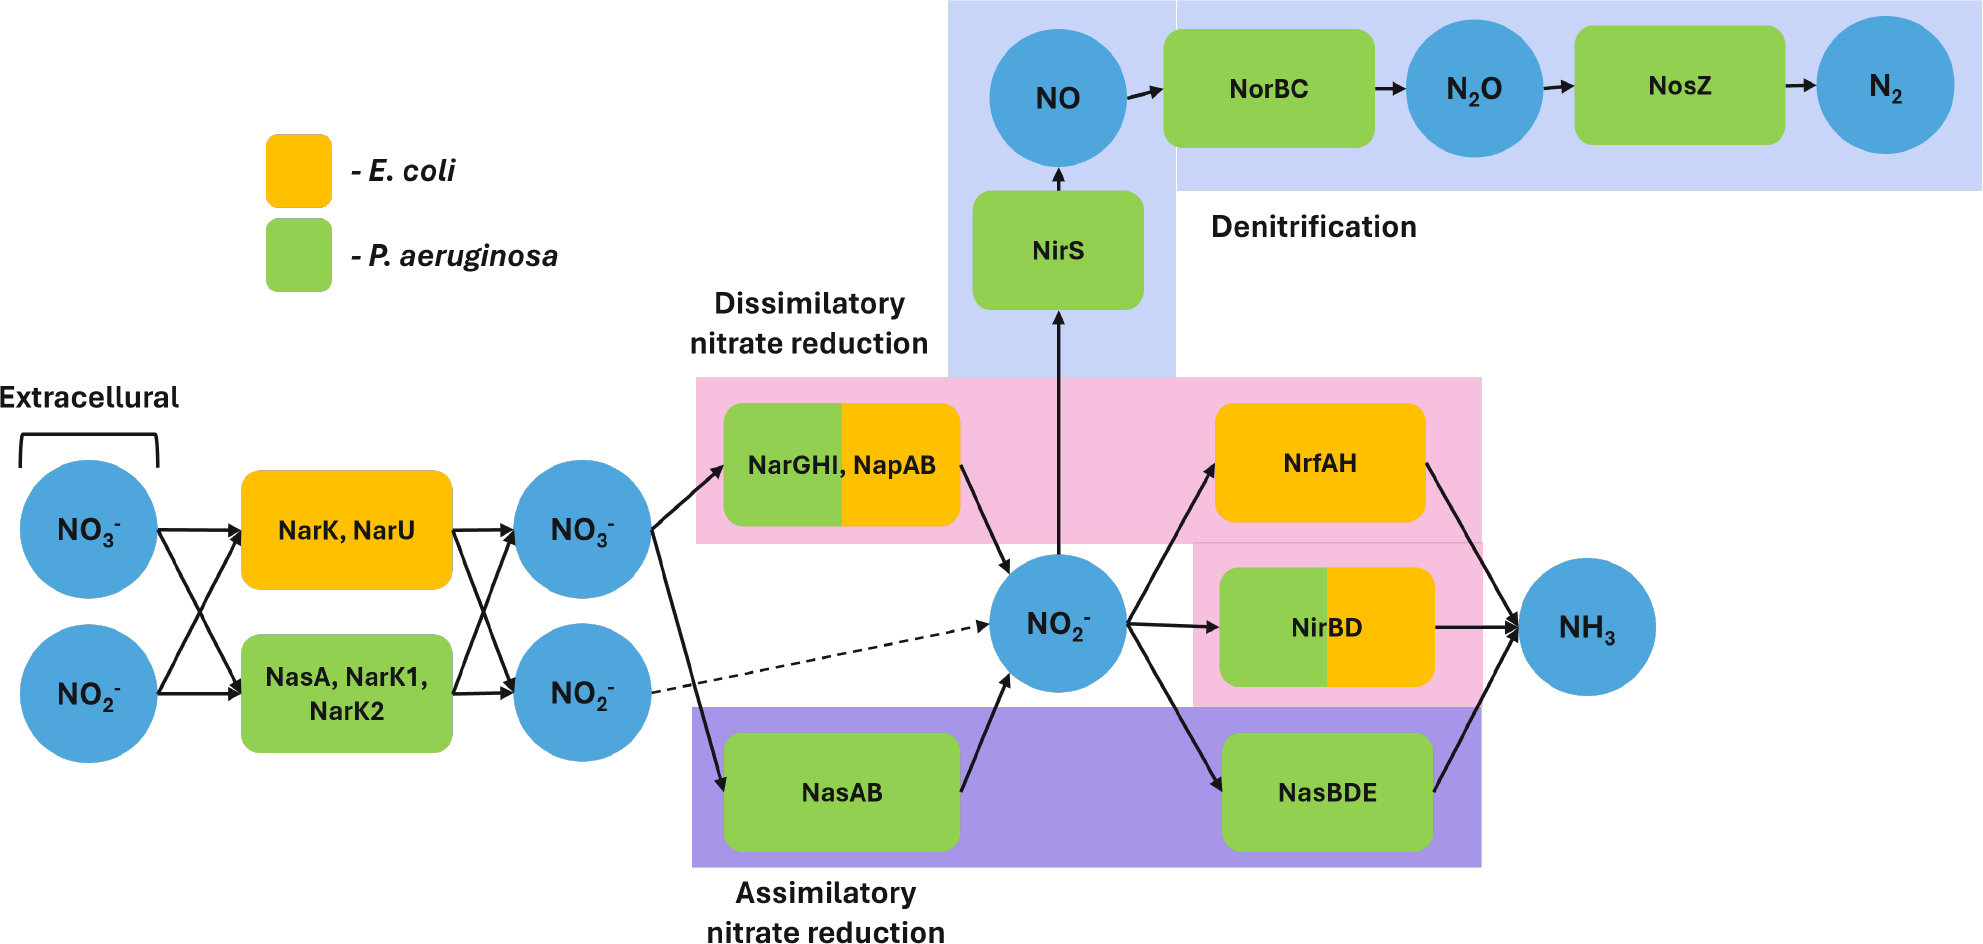
Figure 3.
Comparative nitrogen metabolism pathways in E. coli and P. aeruginosa.
This schematic illustrates the assimilation and dissimilation of nitrogen pathways in E. coli and P. aeruginosa. The rectangles colour-coded according to the bacteria indicate the enzymes involved in the processes. Orange represents those present in E. coli, while green indicates enzymes found in P. aeruginosa. Those shared by both organisms are shown as split-coloured boxes.