
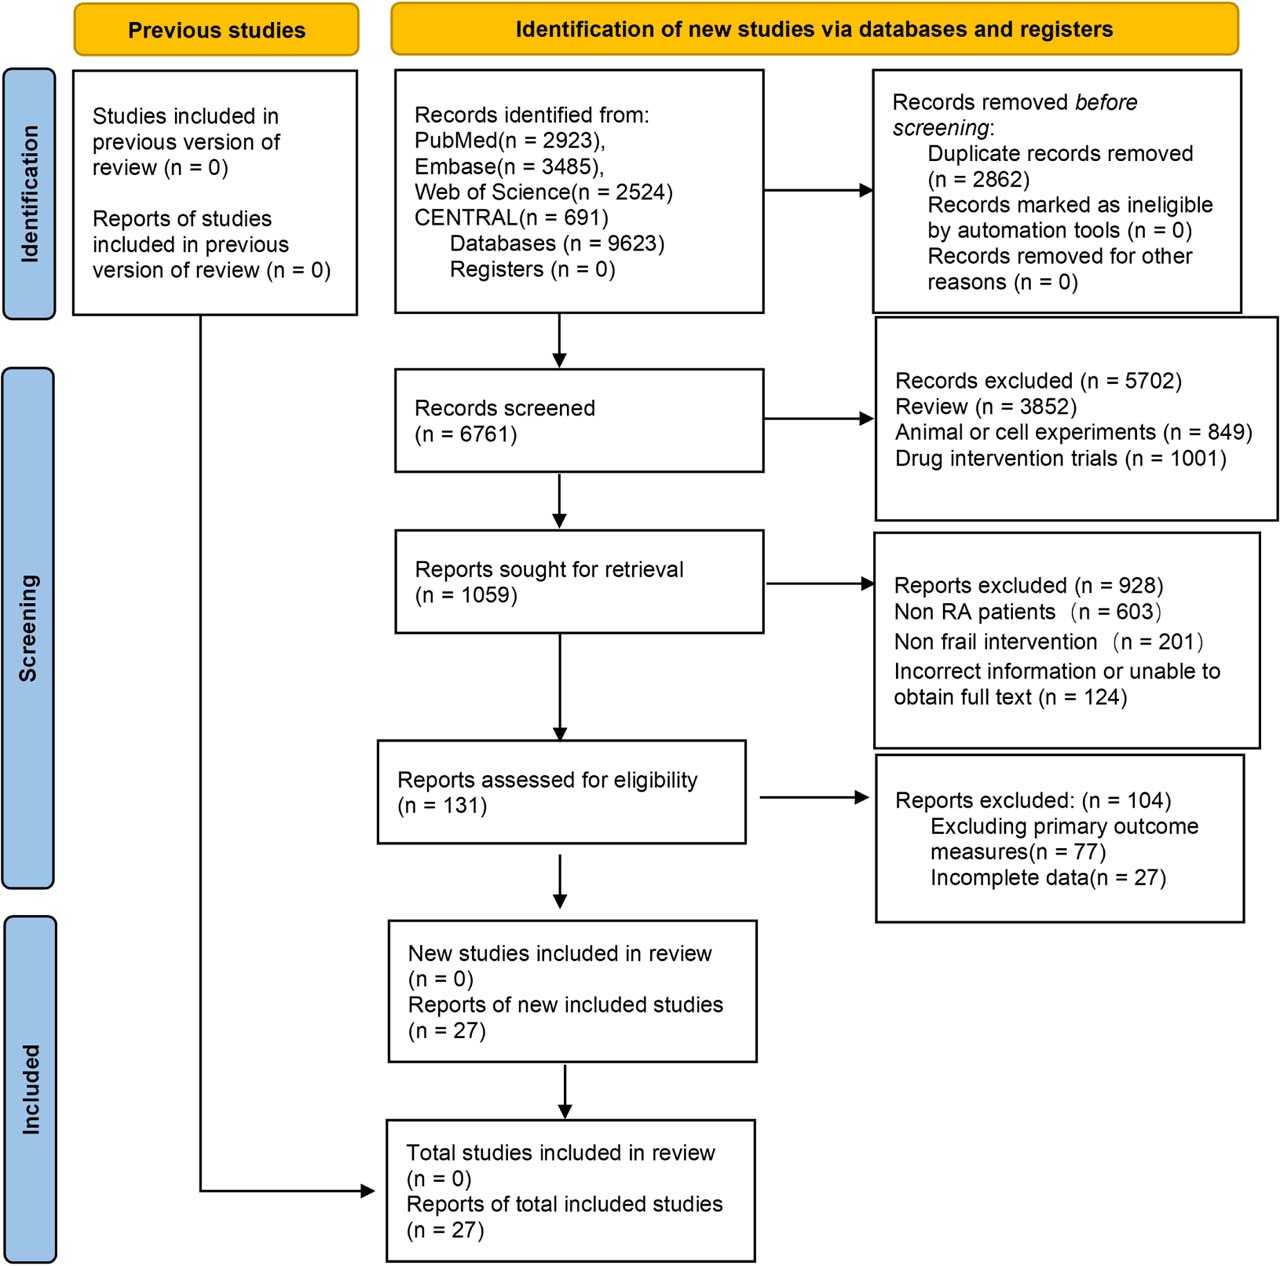
Fig 1.
Flowchart of the inclusion and exclusion criteria for the literature review.
Table 1.
Basic characteristics of the included studies
| References | Number of examples (OG/CG) | Age (OG/CG) | Proportion of women (OG/CG) | Biological inhibitor | Observation group intervention (OG) | Control group intervention (CG) | Study area |
|---|---|---|---|---|---|---|---|
| Asano et al. (2024) | 56/28 | –/– | –/– | TNF | GLM | MTX | Japan |
| Blanco et al. (2017) | 137/138 | 55.9 ± 12.3/55.5 ± 12.1 | 79.6%/83.3% | IL17 | Secukinumab | PBO | USA |
| Blanco et al. (2017) | 138/138 | 51.6 ± 12.4/55.5 ± 12.1 | 77.5%/83.3% | Tcell | Abatacept | PBO | USA |
| Breedveld et al. (2004) | 87/88 | 54 | 78.0% | TNF | Infliximab | MTX | Netherlands |
| Breedveld et al. (2018) | 9/12 | 55.6 ± 12.8/53.0 ± 15.3 | 78.0%/92.0% | TNF | Etanercept | PBO | Netherlands |
| Breedveld et al. (2006) | 268/257 | 51.9 ± 14.0/52.0 ± 13.1 | 72.0%/73.9% | TNF | Adalimumab | MTX | Netherlands |
| Buttgereit et al. (2023) | 31/96 | 52.0 (23–73) /54.5 (25–81) | 77.4%/76.0% | TNF | ABBV-3373 | PBO | Germany |
| Cohen et al. (2006) | 308/209 | 52.2 ± 12.2/52.8 ± 12.6 | 81.0%/81.0% | Bcell | Rituximab | MTX | USA |
| Cope et al. (2024) | 110/103 | 48.3 ± 11.6/48.8 ± 10.9 | 76.0%/79.0% | Tcell | Abatacept | PBO | Great Britain |
| Deakin et al. (2023) | 464/235 | 56 (47–66) /59 (51–68) | 68.0%/73.6% | TNF | Adalimumab | PBO | USA |
| Dokoupilová et al. (2018) | 81/81 | 55.1 ± 12.7/54.2 ± 11.0 | 82.7%/80.2% | IL17 | Secukinumab | PBO | Great Britain |
| Emery et al. (2014) | 159/160 | 50.2 ± 11.9/48.6 ± 12.9 | 78.6%/83.8% | TNF | GLM | MTX | Great Britain |
| Fleischmann et al. (2017) | 384/386 | 49.7 ± 12.2/50.7 ± 13.4 | 83.0%/83.0% | TNF | Adalimumab and MTX | PBO | USA |
| Genovese et al. (2014) | 37/54 | –/– | –/– | IL17 | Ixekizumab | PBO | Great Britain |
| Genovese et al. (2008) | 41/40 | 52.5/57.5 | 72.0%/85.0% | Bcell | Ocrelizumab | PBO | Great Britain |
| Giles et al. (2020) | 1538/1542 | 61 ± 7/61 ± 8 | 88.0%/88.0% | IL6 | Tocilizumab | Etanercept | Germany |
| Hetland et al. (2020) | 203/200 | 55.3 ± 15.3/54.6 ± 14.5 | 68.5%/69.5% | TNF | Certolizumab | MTX | Denmark |
| Hetland et al. (2020) | 204/200 | 54.7 ± 14.4/54.6 ± 14.5 | 68.6%/69.5% | Tcell | Abatacept | MTX | Denmark |
| Hetland et al. (2020) | 188/200 | 52.4 ± 14.5/54.6 ± 14.5 | 68.6%/69.5% | IL6 | Tocilizumab | MTX | Denmark |
| Humby et al. (2021) | 79/82 | 55.5 (47.3–65.1) /55.7 (47.7–65.5) | 84.0%/76.0% | IL6 | Tocilizumab | Rituximab | USA |
| Liu et al. (2025) | 136/68 | 47.0 ± 11.2/47.8 ± 12.1 | 86.8%/77.9% | IL6 | Tocilizumab | MTX | USA |
| Rech et al. (2024) | 49/49 | 51 ± 11/49 ± 13 | 63.0%/80.0% | Tcell | Abatacept | PBO | Germany |
| Rigby et al. (2012) | 343/320 | 50.5 ± 11.5/51.8 ± 12.0 | 82.5%/77.5% | Bcell | Ocrelizumab | PBO | Germany |
| Rivellese et al. (2023) | 34/66 | 55.2 ± 12.8/52.9 ± 14.7 | 76.0%/73.0% | Bcell | Rituximab | Tocilizumab | Great Britain |
| Rubbert-Roth et al. (2020) | 303/309 | 55.3 ± 11.4/55.8 ± 11.9 | 82.2%/81.9% | Tcell | Upadacitinib | Abatacept | Switzerland |
| Smolen et al. (2017) | 54/55 | 54.6 ± 11.3/51.1 ± 10.6 | 77.8%/87.3% | IL23 | Guselkumab | MTX | USA |
| Tak et al. (2012) | 282/277 | 53.8 ± 11.6/54.2 ± 11.3 | 83.7%/77.6% | Bcell | Ocrelizumab | PBO | Switzerland |
| Taylor et al. (2023) | 156/79 | 57.5 ± 10.69/55.5 ± 10.64 | 85.0%/82.0% | IL6 | Sarilumab | PBO | USA |
| Weinblatt et al. (2003) | 67/62 | 57.2 ± 11.4/56.0 ± 10.8 | 74.6%/82.3% | TNF | Adalimumab | PBO | Canada |
| Weinblatt et al. (2025) | 147/561 | 58.0 ± 10.7/55.1 ± 11.3 | 86.0%/81.0% | IL6 | Sarilumab | PBO | Canada |
[i] Note: Among the biological inhibitors, “TNF,” “IL17,” “Tcell,” “Bcell,” “IL6,” and “L23” represent TNF-i, IL-17 inhibitors, T cell costimulatory modulators, B cell scavengers, IL-6 receptor antagonists, and IL-23 inhibitors, respectively. “Pbo” and “MTX” represent placebo and placebo combined with MTX, respectively. GLM, golimumab; MTX, methotrexate; OG / CG, observation group / control group; PBO, placebo; TNF, tumor necrosis factor.
Table 2.
Results of the literature quality assessment
| References | Bias in randomized processes | Bias due to deviation from the planned intervention | Bias in measurement of the outcome | Bias due to missing outcome data | Bias in selection of the reported result | Overall risk of bias |
|---|---|---|---|---|---|---|
| Asano et al. (2024) | 1 | 1 | 1 | 1 | 1 | Low risk |
| Blanco et al. (2017) | 1 | 1 | 1 | 1 | 1 | Low risk |
| Blanco et al. (2017) | 1 | 1 | 1 | 1 | 1 | Low risk |
| Breedveld et al. (2004) | 2 | 2 | 1 | 2 | 1 | Moderate risk |
| Breedveld et al. (2018) | 1 | 1 | 1 | 1 | 1 | Low risk |
| Breedveld et al. (2006) | 1 | 1 | 1 | 1 | 1 | Low risk |
| Buttgereit et al. (2023) | 1 | 1 | 1 | 1 | 1 | Low risk |
| Cohen et al. (2006) | 2 | 2 | 1 | 2 | 1 | Moderate risk |
| Cope et al. (2024) | 1 | 1 | 1 | 1 | 1 | Low risk |
| Deakin et al. (2023) | 1 | 1 | 1 | 1 | 1 | Low risk |
| Dokoupilová et al. (2018) | 1 | 1 | 1 | 1 | 1 | Low risk |
| Emery et al. (2014) | 1 | 1 | 1 | 1 | 1 | Low risk |
| Fleischmann et al. (2017) | 1 | 1 | 1 | 1 | 1 | Low risk |
| Genovese et al. (2014) | 2 | 2 | 2 | 2 | 1 | Moderate risk |
| Genovese et al. (2008) | 2 | 2 | 2 | 2 | 1 | Moderate risk |
| Giles et al. (2020) | 1 | 1 | 1 | 1 | 1 | Low risk |
| Hetland et al. (2020) | 1 | 1 | 1 | 1 | 1 | Low risk |
| Hetland et al. (2020) | 1 | 1 | 1 | 1 | 1 | Low risk |
| Hetland et al. (2020) | 1 | 1 | 1 | 1 | 1 | Low risk |
| Humby et al. (2021) | 2 | 2 | 1 | 2 | 1 | Moderate risk |
| Liu et al. (2025) | 1 | 1 | 1 | 1 | 1 | Low risk |
| Rech et al. (2024) | 1 | 1 | 1 | 1 | 1 | Low risk |
| Rigby et al. (2012) | 2 | 2 | 1 | 2 | 1 | Moderate risk |
| Rivellese et al. (2023) | 2 | 2 | 1 | 2 | 1 | Moderate risk |
| Rubbert-Roth et al. (2020) | 1 | 1 | 1 | 1 | 1 | Low risk |
| Smolen et al. (2017) | 1 | 1 | 1 | 1 | 1 | Low risk |
| Tak et al. (2012) | 2 | 2 | 1 | 2 | 1 | Moderate risk |
| Taylor et al. (2023) | 1 | 1 | 1 | 1 | 1 | Low risk |
| Weinblatt et al. (2003) | 2 | 2 | 1 | 2 | 1 | Moderate risk |
| Weinblatt et al. (2025) | 1 | 1 | 1 | 1 | 1 | Low risk |
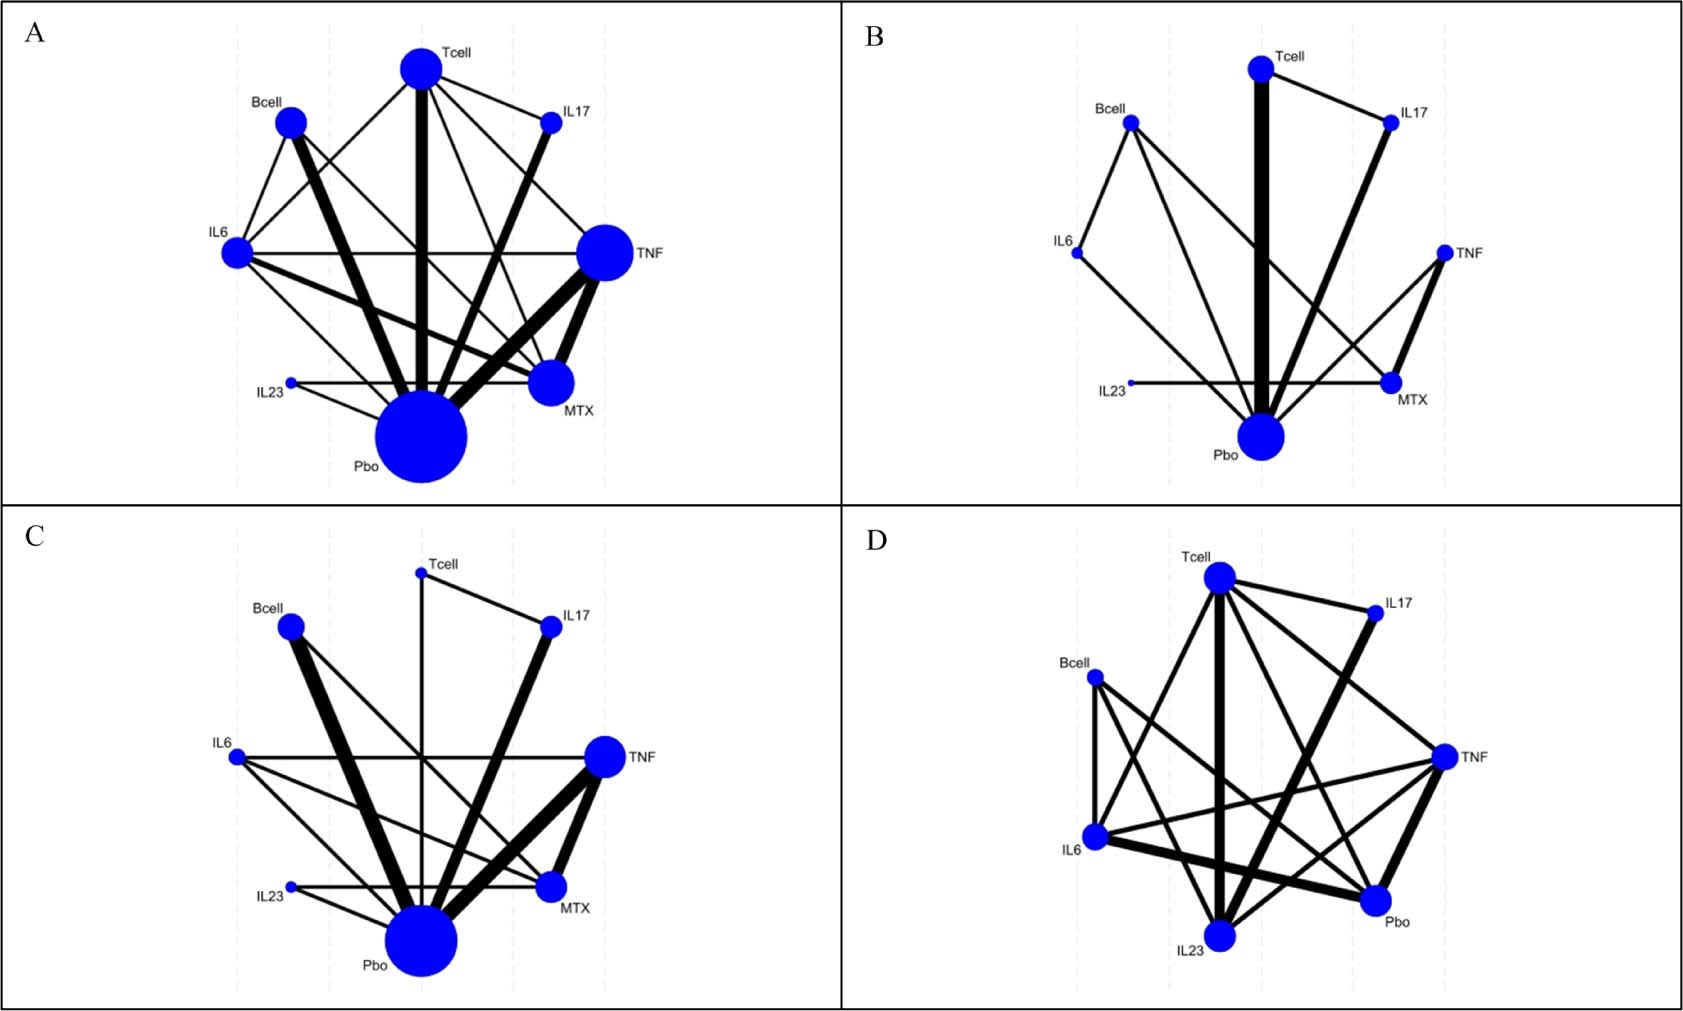
Fig 2.
Network evidence diagrams for the four outcomes. (A) mTSS; (B) bone erosion score; (C) ACR20; (D) serious adverse reactions. Node size is proportional to the number of participants randomized to that class and line width to the number of direct comparisons. mTSS, modified Total Sharp Score.
Table 3.
Results of a network meta-analysis on the impact of different treatment modalities for RA patients on the mTSS
| TNF | −15.67 (−17.81, −13.52) | −14.99 (−18.11, −11.87) | −18.46 (−20.86, −16.06) | −13.73 (−16.17, −11.28) | −18.14 (−21.11, −15.16) |
|---|---|---|---|---|---|
| 15.67 (13.52, 17.81) | IL17 | 0.68 (−3.07, 4.42) | −2.79 (−5.75, 0.16) | 1.94 (−1.06, 4.94) | −2.47 (−5.63, 0.68) |
| 14.99 (11.87, 18.11) | −0.68 (−4.42, 3.07) | Tcell | −3.47 (−7.12, 0.17) | 1.26 (−2.68, 5.20) | −3.15 (−7.41, 1.11) |
| 18.46 (16.06, 20.86) | 2.79 (−0.16, 5.75) | 3.47 (−0.17, 7.12) | Bcell | 4.73 (1.42, 8.04) | 0.32 (−3.17, 3.82) |
| 13.73 (11.28, 16.17) | −1.94 (−4.94, 1.06) | −1.26 (−5.20, 2.68) | −4.73 (−8.04, −1.42) | IL6 | −4.41 (−7.71, −1.11) |
| 18.14 (15.16, 21.11) | 2.47 (−0.68, 5.63) | 3.15 (−1.11, 7.41) | –0.32 (−3.82, 3.17) | 4.41 (1.11, 7.71) | IL23 |
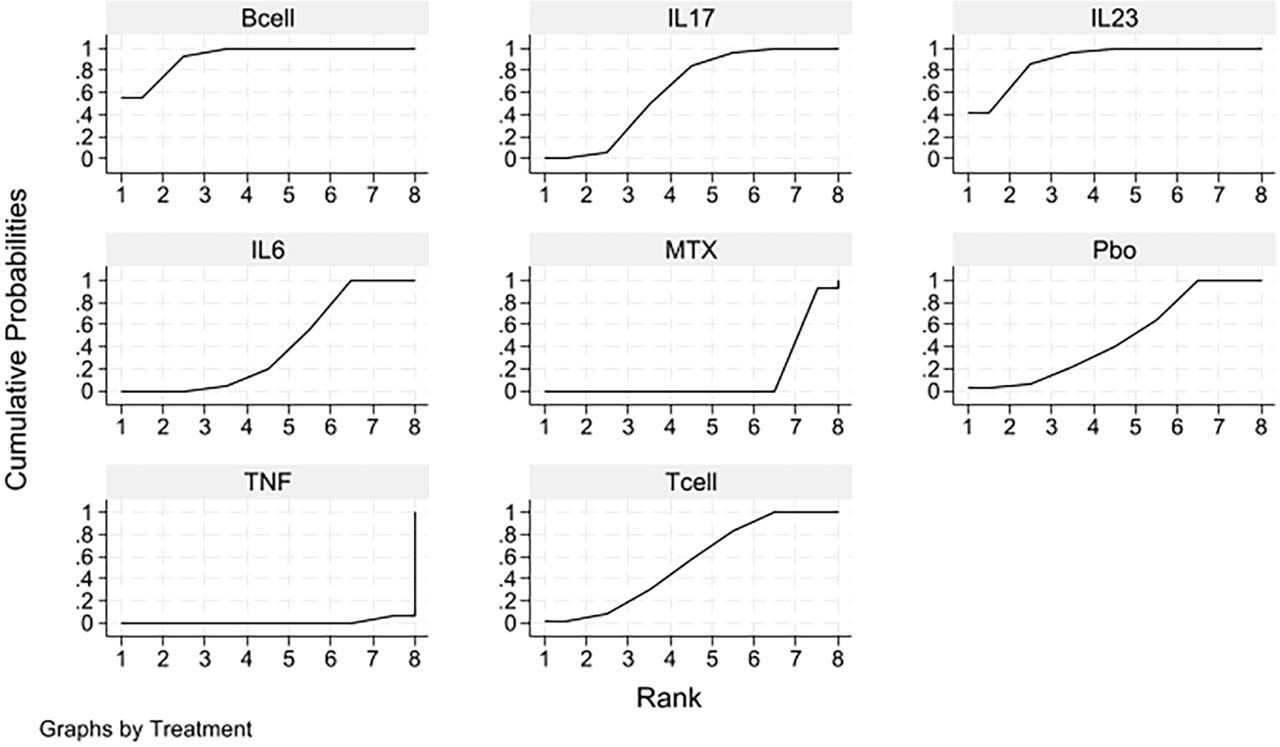
Fig 3.
Cumulative probability plot showing the effect of different treatment approaches on mTSS in patients with RA. mTSS, modified Total Sharp Score; MTX, methotrexate; PBO, placebo; RA, rheumatoid arthritis; TNF, tumor necrosis factor.
Table 4.
Results of a network meta-analysis on the effects of different treatment modalities on bone erosion scores in patients with RA
| TNF | IL17 | Tcell | Bcell | IL6 | IL23 |
|---|---|---|---|---|---|
| TNF | −0.29 (−0.49, −0.09) | −0.17 (−0.33, −0.01) | −0.26 (−0.38, −0.14) | −0.22 (−0.40, −0.05) | −0.18 (−0.37, 0.02) |
| 0.29 (0.09, 0.49) | IL17 | 0.12 (−0.14, 0.38) | 0.03 (−0.20, 0.27) | 0.07 (−0.15, 0.29) | 0.11 (−0.14, 0.37) |
| 0.17 (0.01, 0.33) | −0.12 (−0.38, 0.14) | Tcell | −0.09 (−0.27, 0.09) | −0.05 (−0.29, 0.19) | −0.01 (−0.26, 0.25) |
| 0.26 (0.14, 0.38) | −0.03 (−0.27, 0.20) | 0.09 (−0.09, 0.27) | Bcell | 0.03 (−0.18, 0.25) | 0.08 (−0.15, 0.31) |
| 0.22 (0.05, 0.40) | −0.07 (−0.29, 0.15) | 0.05 (−0.19, 0.29) | −0.03 (−0.25, 0.18) | IL6 | 0.05 (−0.15, 0.24) |
| 0.18 (–0.02, 0.37) | −0.11 (−0.37, 0.14) | 0.01 (−0.25, 0.26) | −0.08 (−0.31, 0.15) | −0.05 (−0.24, 0.15) | IL23 |
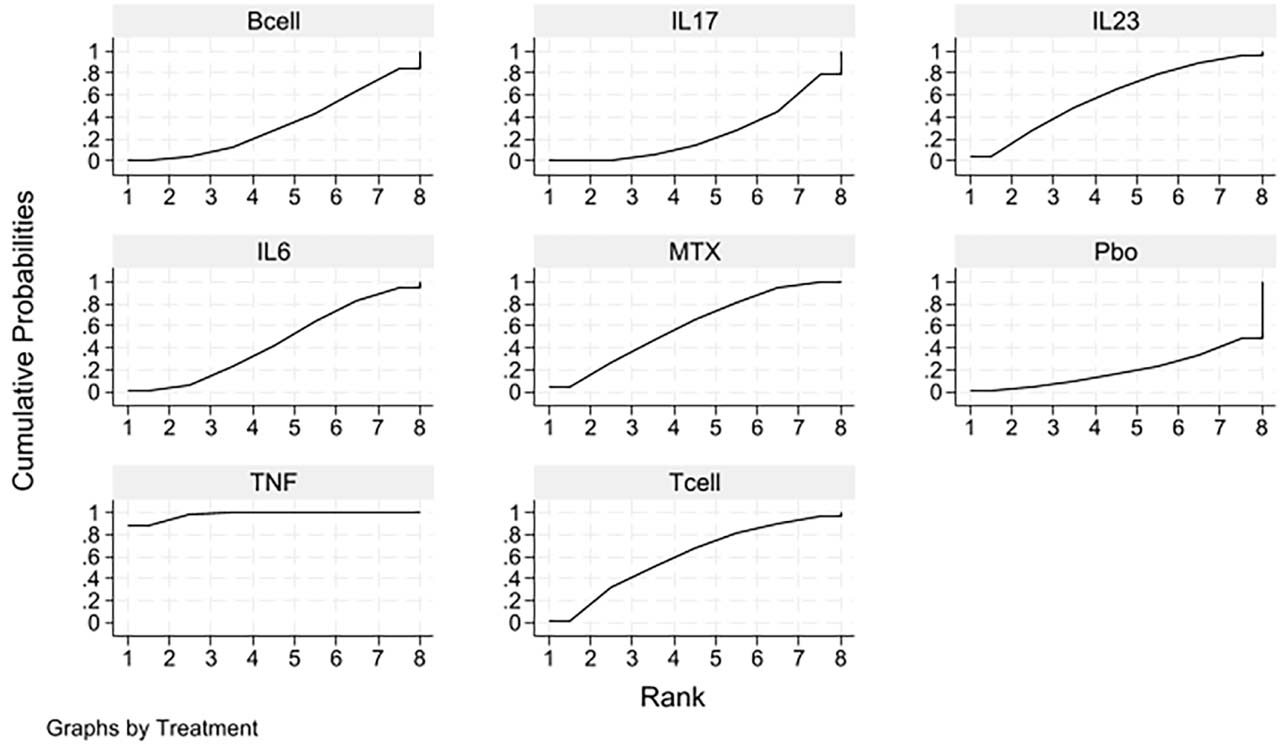
Fig 4.
Cumulative probability plot showing the effect of different treatment modalities on bone erosion scores in patients with RA. MTX, methotrexate; RA, rheumatoid arthritis; TNF, tumor necrosis factor.
Table 5.
Results of a network meta-analysis on the impact of different treatment modalities on ACR20 in patients with RA
| TNF | 1.86 (1.08, 3.20) | 1.30 (0.65, 2.61) | 1.12 (0.41, 3.08) | 2.12 (1.20, 3.72) | 2.75 (1.31, 5.76) |
|---|---|---|---|---|---|
| 0.54 (0.31, 0.93) | IL17 | 0.70 (0.29, 1.69) | 0.61 (0.19, 1.90) | 1.14 (0.55, 2.35) | 1.48 (0.73, 3.00) |
| 0.77 (0.38, 1.54) | 1.42 (0.59, 3.44) | Tcell | 0.86 (0.31, 2.43) | 1.63 (0.66, 3.98) | 2.11 (0.76, 5.82) |
| 0.89 (0.32, 2.44) | 1.65 (0.53, 5.18) | 1.16 (0.41, 3.27) | Bcell | 1.88 (0.59, 5.98) | 2.44 (0.70, 8.53) |
| 0.47 (0.27, 0.83) | 0.88 (0.43, 1.81) | 0.62 (0.25, 1.51) | 0.53 (0.17, 1.68) | IL6 | 1.30 (0.54, 3.12) |
| 0.36 (0.17, 0.76) | 0.68 (0.33, 1.37) | 0.47 (0.17, 1.31) | 0.41 (0.12, 1.43) | 0.77 (0.32, 1.85) | IL23 |
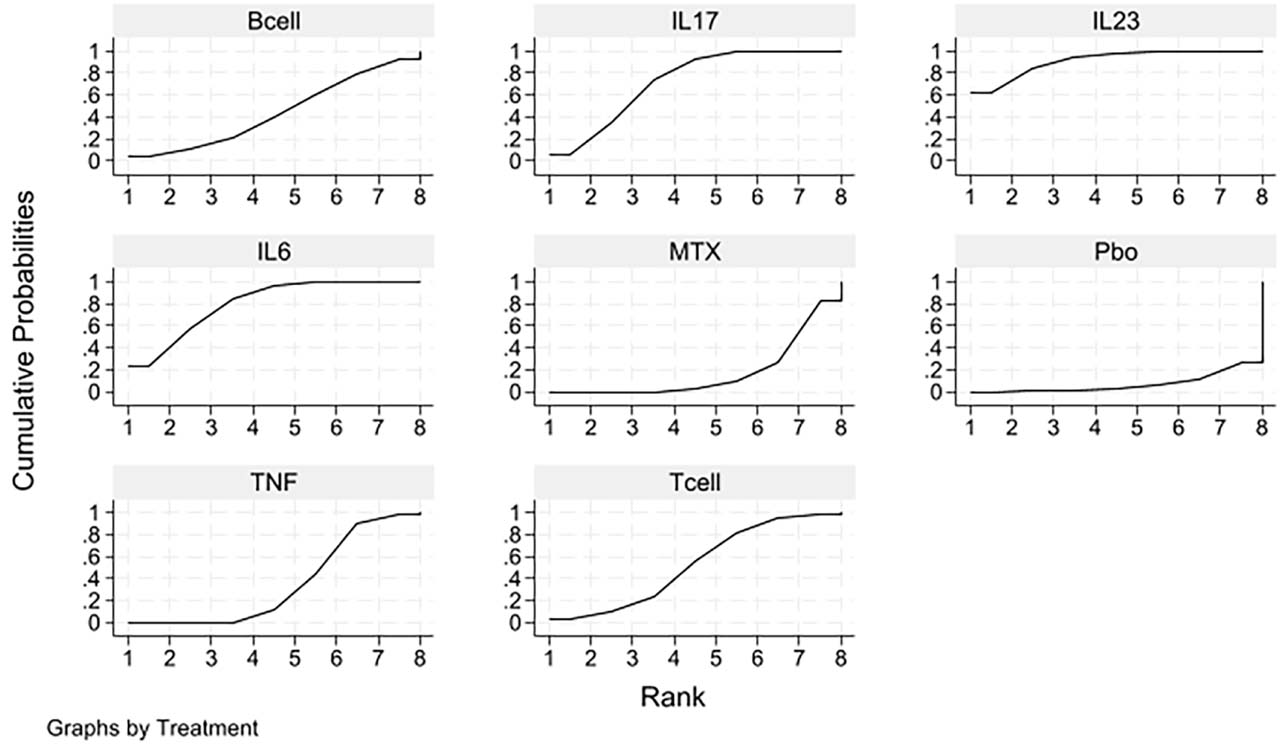
Fig 5.
Cumulative probability plot showing the effect of different treatment approaches on ACR20 in patients with RA. MTX, methotrexate; RA, rheumatoid arthritis; TNF, tumor necrosis factor.
Table 6.
Results of a network meta-analysis on the impact of different treatment modalities for RA patients on serious adverse reactions
| T cell | 1.10 (0.43, 2.78) | 0.75 (0.28, 2.02) | 1.36 (0.47, 3.98) | 1.17 (0.42, 3.31) | 0.87 (0.34, 2.21) |
|---|---|---|---|---|---|
| 0.91 (0.36, 2.32) | TNF | 0.68 (0.43, 1.08) | 1.24 (0.64, 2.41) | 1.07 (0.59, 1.94) | 0.79 (0.45, 1.39) |
| 1.34 (0.50, 3.63) | 1.47 (0.93, 2.33) | IL6 | 1.83 (1.05, 3.20) | 1.57 (0.96, 2.58) | 1.17 (0.65, 2.11) |
| 0.73 (0.25, 2.14) | 0.80 (0.42, 1.55) | 0.55 (0.31, 0.96) | IL23 | 0.86 (0.49, 1.51) | 0.64 (0.33, 1.24) |
| 0.85 (0.30, 2.41) | 0.94 (0.52, 1.70) | 0.64 (0.39, 1.05) | 1.16 (0.66, 2.05) | IL17 | 0.74 (0.40, 1.38) |
| 1.15 (0.45, 2.91) | 1.26 (0.72, 2.21) | 0.86 (0.47, 1.55) | 1.57 (0.81, 3.03) | 1.34 (0.73, 2.49) | Bcell |
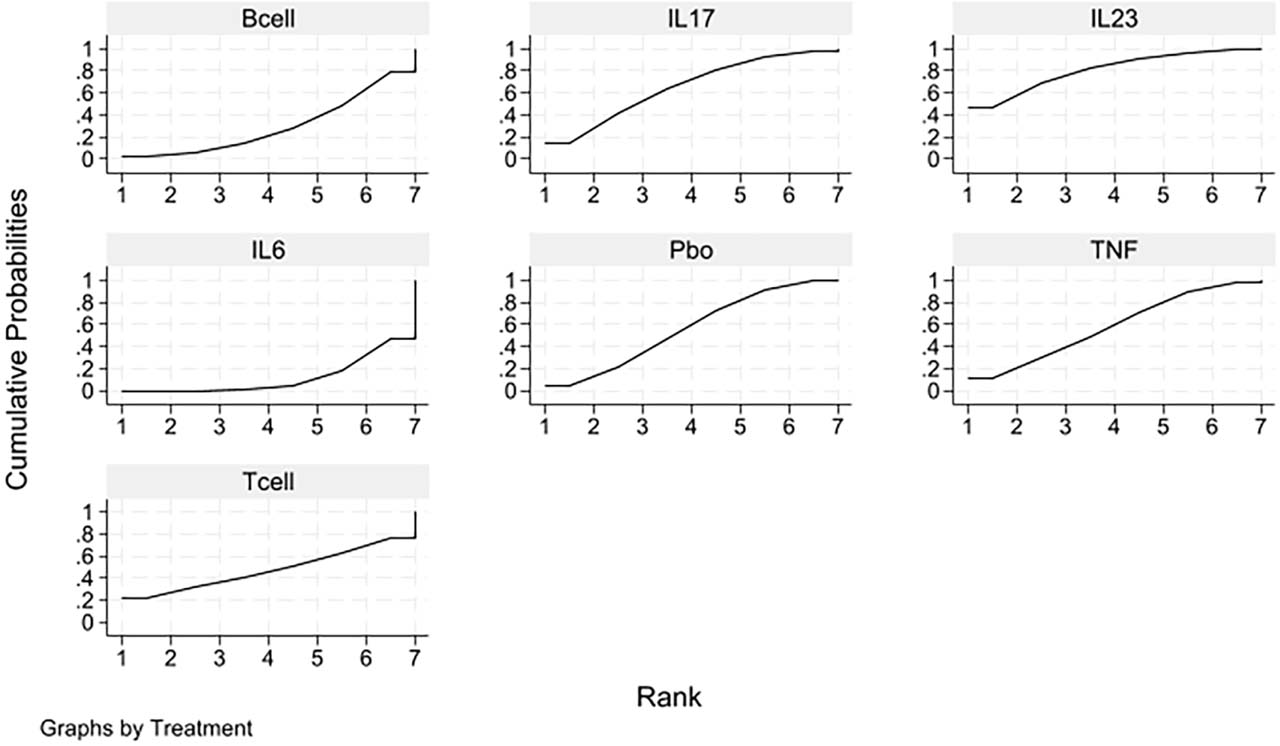
Fig 6.
Cumulative probability plot showing the impact of different treatment approaches on serious adverse reactions in patients with RA. RA, rheumatoid arthritis; TNF, tumor necrosis factor.
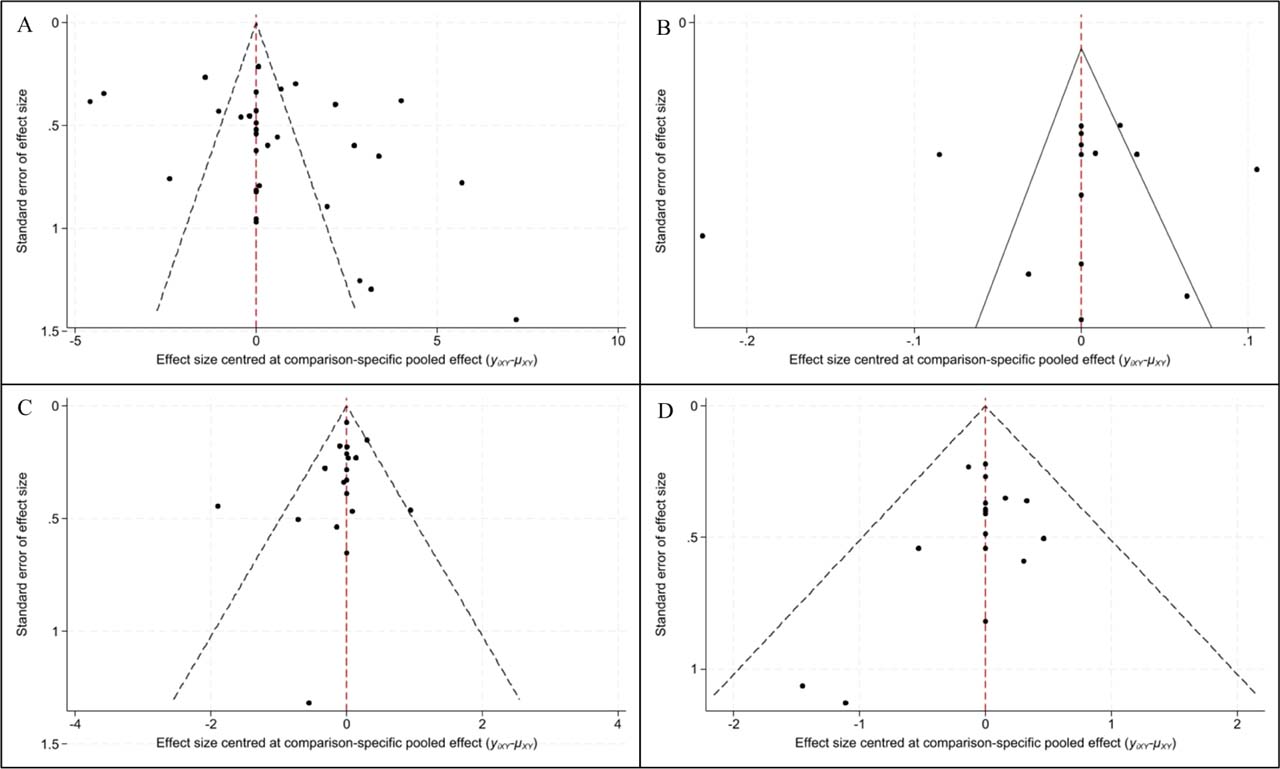
Fig 7.
Publication bias funnel plots. (A) mTSS; (B) bone erosion score; (C) ACR20; (D) serious adverse reactions. mTSS, modified Total Sharp Score.
Supplementary Table S1.
Full electronic search strategies
| Platform/interface | Date searched | Coverage (from – to) | Limits or filters applied | Search strategy |
|---|---|---|---|---|
| PubMed/MEDLINE | March 20, 2026 | inception – 31 Dec 2025 | None | #1 “Arthritis, Rheumatoid”[MeSH] OR “rheumatoid arthritis”[tiab] OR “RA”[tiab] #2 “Biological Products”[MeSH] OR “Antirheumatic Agents”[MeSH] OR biologic*[tiab] OR bDMARD*[tiab] OR “tumor necrosis factor inhibitor*”[tiab] OR adalimumab[tiab] OR etanercept[tiab] OR infliximab[tiab] OR certolizumab[tiab] OR golimumab[tiab] OR tocilizumab[tiab] OR sarilumab[tiab] OR abatacept[tiab] OR rituximab[tiab] OR ocrelizumab[tiab] OR secukinumab[tiab] OR ixekizumab[tiab] OR guselkumab[tiab] #3 “randomized controlled trial”[pt] OR randomi*[tiab] OR “Radiography”[MeSH] OR “Sharp score”[tiab] OR “van der Heijde”[tiab] OR “joint space narrowing”[tiab] OR “bone erosion”[tiab] #1 AND #2 AND #3 |
| Embase | March 20, 2026 | inception – 31 Dec 2025 | None | #1 ‘rheumatoid arthritis’/exp OR ‘rheumatoid arthritis’:ti,ab OR ‘ra’:ti,ab #2 ‘biological product’/exp OR ‘antirheumatic agent’/exp OR biologic*:ti,ab OR bdmard*:ti,ab OR ‘tumor necrosis factor inhibitor*’:ti,ab OR adalimumab:ti,ab OR etanercept:ti,ab OR infliximab:ti,ab OR certolizumab:ti,ab OR golimumab:ti,ab OR tocilizumab:ti,ab OR sarilumab:ti,ab OR abatacept:ti,ab OR rituximab:ti,ab OR ocrelizumab:ti,ab OR secukinumab:ti,ab OR ixekizumab:ti,ab OR guselkumab:ti,ab #3 ‘randomized controlled trial’/exp OR randomi*:ti,ab OR ‘radiography’/exp OR ‘sharp score’:ti,ab OR ‘van der heijde’:ti,ab OR ‘joint space narrowing’:ti,ab OR ‘bone erosion’:ti,ab #1 AND #2 AND #3 |
| Web of Science Core Collection | March 20, 2026 | inception – 31 Dec 2025 | None | #1 TS = (“rheumatoid arthritis” OR “RA”) #2 TS = (biologic* OR bDMARD* OR “tumor necrosis factor inhibitor*” OR adalimumab OR etanercept OR infliximab OR certolizumab OR golimumab OR tocilizumab OR sarilumab OR abatacept OR rituximab OR ocrelizumab OR secukinumab OR ixekizumab OR guselkumab) #3 TS = (randomi* OR “randomized controlled trial”) OR TS = (“Sharp score” OR “van der Heijde” OR “joint space narrowing” OR “bone erosion”) #1 AND #2 AND #3 |
| CENTRAL | March 20, 2026 | inception – 31 Dec 2025 | None | #1 MeSH descriptor: [Arthritis, Rheumatoid] explode all trees OR (“rheumatoid arthritis” OR “RA”):ti,ab #2 MeSH descriptor: [Biological Products] explode all trees OR MeSH descriptor: [Antirheumatic Agents] explode all trees OR (biologic* OR bDMARD* OR “tumor necrosis factor inhibitor*” OR adalimumab OR etanercept OR infliximab OR certolizumab OR golimumab OR tocilizumab OR sarilumab OR abatacept OR rituximab OR ocrelizumab OR secukinumab OR ixekizumab OR guselkumab):ti,ab #3 (“randomized controlled trial”):pt OR randomi*:ti,ab OR MeSH descriptor: [Radiography] explode all trees OR (“Sharp score” OR “van der Heijde” OR “joint space narrowing” OR “bone erosion”):ti,ab #1 AND #2 AND #3 |