
1. Introduction
Rheumatoid arthritis (RA) is a systemic autoimmune disease characterized by chronic symmetric synovitis as its core pathological feature. The main harm caused by RA lies in the destruction of joint cartilage and bone structures driven by persistent inflammation, ultimately leading to joint deformity, loss of function, and even disability (Jang et al. 2022; Wu et al. 2022). The prevalence of RA is about 0.42%, the total number of patients exceeds 5 million; the peak age of incidence is 35–50 years old, and the incidence rate in women is 2–3 times that of men (Venetsanopoulou et al. 2022). RA patients without standard treatment, 50%–75% of patients may develop radiographically detectable joint erosion within 2 years of onset, the 5-year disability rate is as high as 43%, and the risk of extra-articular complications such as cardiovascular disease and interstitial lung disease is 2–3 times higher than that of the general population, bringing a heavy burden of disease to families and society (Cush 2022; Uke et al. 2025). The current treatment paradigm for RA has shifted from simply controlling symptoms to a treat-to-target approach. The 2025 European League Against Rheumatism (EULAR) recommendations for the management of RA (Smolen et al. 2026) explicitly define the absence of radiographic progression as one of the three core criteria for achieving treat-to-target goals, holding equal importance with clinical remission and functional preservation. The advent of biologics, disease-modifying antirheumatic drugs (bDMARDs), is a milestone in the treatment of RA (Bernabela and Bermas 2024). The bDMARDs currently in common clinical use primarily include tumor necrosis factor (TNF)-α inhibitors (such as adalimumab and etanercept), interleukin (IL)-6 receptor antagonists (such as tocilizumab and sarilumab), T-cell co-stimulatory modulators (such as abatacept), and B-cell depleting agents (such as rituximab), amongst others (Kerschbaumer et al. 2023). A large number of randomized controlled trials (RCTs) have confirmed that bDMARDs are more effective than conventional synthetic DMARDs (csDMARDs) in delaying structural joint damage in RA patients (Yoshimura et al. 2024). However, there is still significant controversy over whether there are differences in the efficacy of bDMARDs with different mechanisms of action in inhibiting radiological progression. The six classes examined here were selected against three explicit criteria: (i) the class is licensed for RA or has completed randomised phase II/III evaluation in RA; (ii) at least one randomised trial has reported a structural outcome scored by the Sharp/van der Heijde method, which is a prerequisite for entry into a radiographic network; and (iii) the class acts on a distinct, non-redundant node of the pathogenic cascade — cytokine-driven synovial inflammation (TNF-α, IL-6 receptor), T-cell co-stimulation, B-cell-mediated autoimmunity and the IL-23/IL-17 axis — so that between-class comparison carries mechanistic as well as statistical meaning. Targeted synthetic DMARDs (Janus kinase [JAK] inhibitors) were not included as interventions because they are not biologic agents, and IL-1 antagonists were not included because the available radiographic data are too sparse to connect them to the network. Consequently, this study aims to use a network meta-analysis to systematically compare the efficacy of different biologics in inhibiting radiographic progression in patients with RA, with the ultimate goal of establishing a ranking of their relative efficacy and providing evidence-based guidance for clinicians in selecting treatment regimens for RA.
2. Method
The present meta-analysis was conducted in accordance with the guidelines of the Preferred Reporting Items for Systematic Reviews and Meta-Analyses (PRISMA). Our meta-analysis protocol was registered in INPLASY (registration number: INPLASY202650027) and can be found at https://inplasy.com/inplasy-2026-5-0027/.
2.1. Inclusion and exclusion criteria
2.1.1. Study type
All published RCTs, regardless of whether they were blinded. Abstracts, reviews, case reports, cohort studies, real-world studies, post hoc analyzes and conference papers were excluded.
2.1.2. Research subjects
Studies were eligible only if they satisfied all of the following criteria: (a) Population: adults aged ≥18 years with RA diagnosed by any of the internationally recognized criteria — the 1987 American College of Rheumatology (ACR) classification criteria, the 2010 ACR/EULAR classification criteria, or the 2022 EULAR/ACR early RA classification criteria — with no restriction on sex, ethnicity, disease duration or baseline disease activity; (b) Design: RCT, with or without blinding; (c) Intervention: at least one arm receiving a licensed bDMARD belonging to one of the six classes specified below, at an approved dose, alone or combined with methotrexate (MTX); (d) Comparator: placebo, a csDMARD or another bDMARD; (e) Outcomes: at least one radiographic outcome (change from baseline in modified Total Sharp Score (mTSS) or in bone erosion score) reported at 12 months, together with data sufficient to derive an effect estimate and its variance; (f) Duration: randomized intervention and follow-up of at least 6 months.
2.1.3. Interventions
Trial group: licensed bDMARDs, grouped into six classes: (a) TNF-i: adalimumab, etanercept, infliximab, certolizumab pegol, golimumab (GLM); (b) IL-6 receptor antagonists (IL-6Ri): tocilizumab, sarilumab; (c) T-cell co-stimulation modulators: abatacept; (d) B-cell depleting agents: rituximab, ocrelizumab; (e) IL-17 inhibitors: secukinumab, ixekizumab; (f) IL-23 inhibitors: guselkumab.
Control group: placebo, csDMARDs (such as MTX, leflunomide) or other bDMARDs.
2.1.4. Outcome indicators
Primary outcome measure: Change in the mTSS at 12 months of treatment compared with baseline. The mTSS comprises two components: the bone erosion score (0–128 points) and the joint space narrowing score (0–64 points), with a total score ranging from 0 points to 192 points; a higher score indicates more severe joint structural damage.
Secondary outcome measures: change in bone erosion score and American College of Rheumatology 20% improvement criteria (ACR20) at 12 months of treatment. Incidence of serious adverse reactions during overall treatment.
2.1.5. Exclusion criteria
(a) Repeatedly published studies (only the studies with the largest sample size and the longest follow-up were retained); (b) studies from which valid outcome data could not be extracted and where the corresponding author did not respond to requests for data; (c) Intervention Duration <6 months study; (d) Studies involving specific patient groups (such as those with co-existing hepatitis B or pregnant women); (e) excluded studies that did not report any radiology-related outcome measures.
2.2. Literature search
The English database is searched by computer, and the search time limit is until December 31, 2025. At the same time, we manually searched the reference lists of included studies, relevant reviews, and abstracts from the 2023–2025 ACR and EULAR annual meetings to identify studies not included in the databases. The retrieval databases include PubMed/MEDLINE, Embase, Web of Science, and Cochrane Central Register of Controlled Trials (CENTRAL). Each database was searched from inception to 31 December 2025; no language or publication-status restriction was applied at the search stage. The strategy combined controlled vocabulary (MeSH in PubMed/MEDLINE and CENTRAL, Emtree in Embase) with free-text terms in the title/abstract field, using the Boolean operator OR within concept blocks and AND between blocks, together with proximity (adjacency) operators in Embase and Web of Science. Three blocks were combined as #1 AND #2 AND #3: #1 population — “Arthritis, Rheumatoid”[Mesh] OR (rheumatoid arthritis OR RA)[tiab]; #2 intervention — “Biological Products”[Mesh] OR “Antirheumatic Agents”[Mesh] OR (biologic* OR bDMARD* OR “tumor necrosis factor inhibitor*” OR adalimumab OR etanercept OR infliximab OR certolizumab OR golimumab OR tocilizumab OR sarilumab OR abatacept OR rituximab OR ocrelizumab OR secukinumab OR ixekizumab OR guselkumab)[tiab]; #3 design and outcome — randomized controlled trial[pt] OR randomi*[tiab] OR “Radiography”[Mesh] OR (radiograph* ADJ3 progress*) OR (“Sharp score” OR “van der Heijde” OR “joint space narrowing” OR “bone erosion”)[tiab]. The verbatim search string for each database, the date on which each search was run and the number of records retrieved are reported in Supplementary Table S1. At the title and abstract stage, a record was retained if the population was RA, the design appeared randomized and at least one bDMARD arm was present; radiographic reporting, treatment duration and data adequacy were verified at full-text stage. The complete screening process with reasons for exclusion at each step is presented in Figure 1.
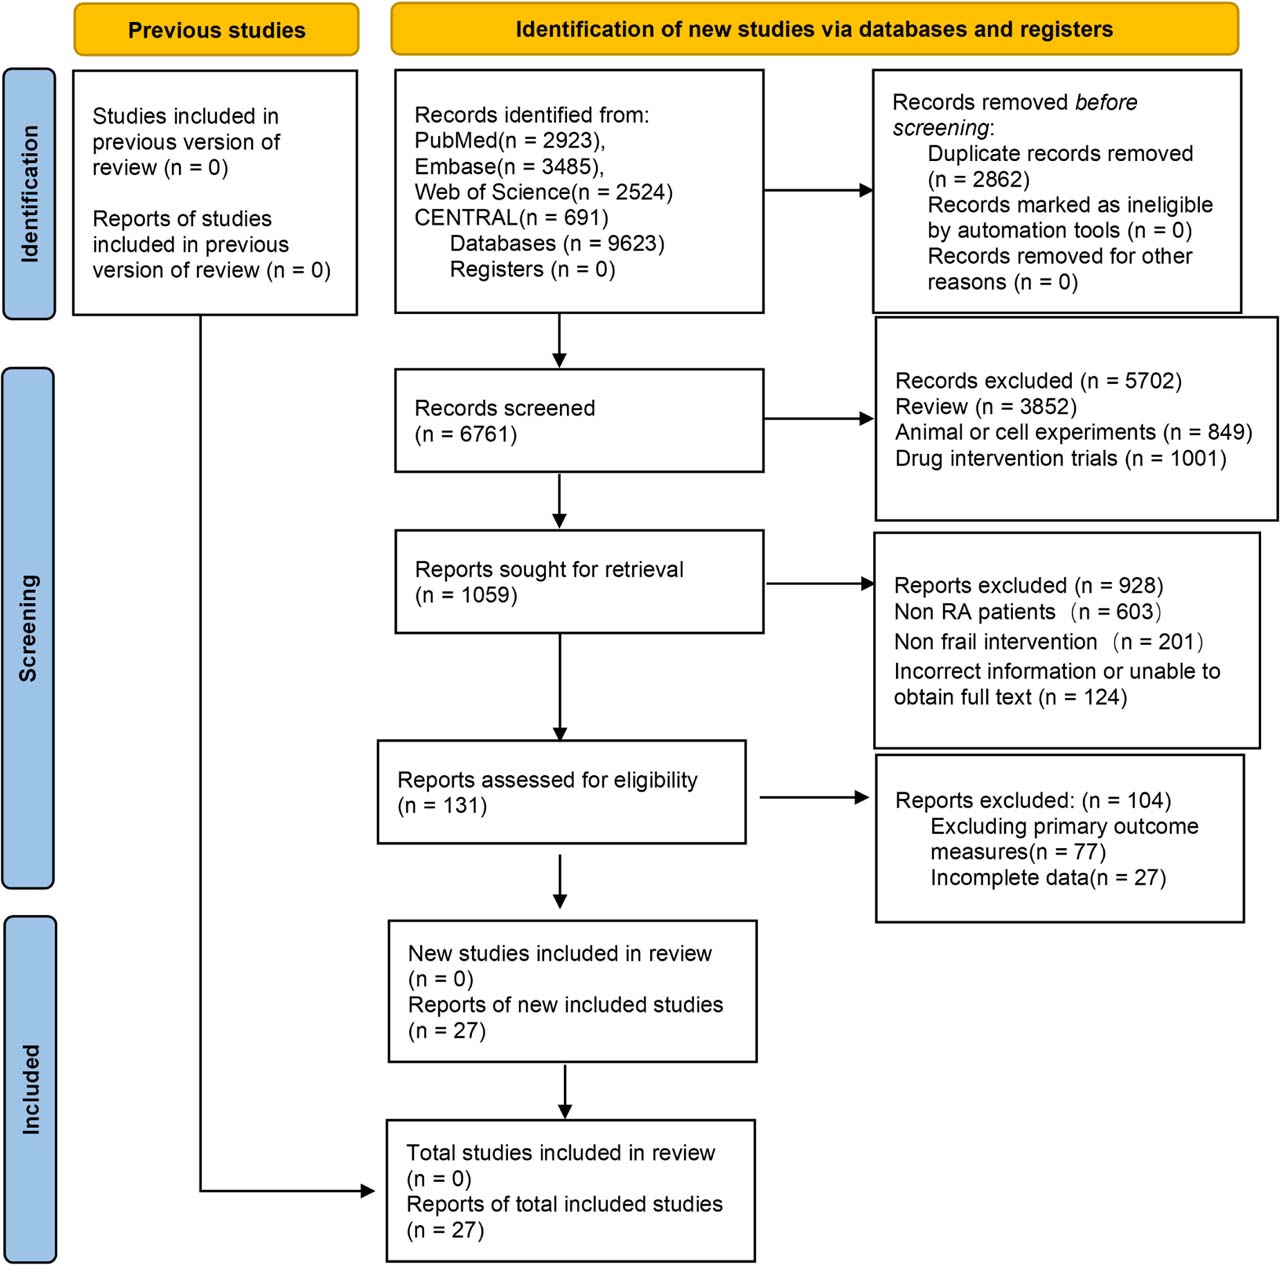
Fig 1.
Flowchart of the inclusion and exclusion criteria for the literature review.
2.3. Literature screening and data extraction
2.3.1. Literature screening
Two researchers, both trained in systematic review methodology, independently screened the literature: (a) Read the literature titles and abstracts to exclude studies that clearly do not meet the inclusion criteria; (b) Obtain the full texts of the remaining articles after the initial screening and assess each one individually to determine whether it meets the inclusion criteria; (c) The screening results of the two researchers were cross-checked, and differences were resolved through discussion or consultation with a third senior researcher. The document screening process is managed using EndNote 21 software (Clarivate, Philadelphia, PA, USA), and the number and reasons for excluded documents at each stage are finally recorded, and the PRISMA flow chart is drawn.
2.3.2. Data extraction
A pre-designed and pre-trial validated standardized data extraction table was used to independently extract data by two investigators, including: (a) Basic study information: first author, year of publication, study title, registration number, sample size, and groupings; (b) Characteristics of subjects: average age, female proportion; (c) Information on interventions: the name and dose of the drugs in each group, and whether they were used in combination with MTX; (d) Outcome index data: mean and standard deviation of mTSS changes at each time point, changes in bone erosion score, ACR20 and incidence of serious adverse reactions. If the study only reported the median and interquartile range, it was converted to mean and standard deviation through the formula recommended by Cochrane manual; if the study only reports data in graphical form, the values are extracted using the GetData Graph Digitizer 2.26 software, (GetData, http://getdata-graph-digitizer.com (S. Fedorov, Russia)). (e) Information relating to the assessment of bias risk: methods used to generate random sequences, allocation concealment procedures, implementation of blinding, completeness of outcome data, and whether there was selective reporting. After the data extraction is completed, cross check shall be conducted, and the inconsistency shall be solved through discussion. For the research of missing data, contact the corresponding author by email to ask for it. If you do not reply 2 weeks after sending the email, it is deemed that you cannot obtain the data.
2.4. Assessment of study quality
The bias risk assessment tool rob 2.0 recommended by Cochrane Collaboration Network was used to evaluate the bias risk of the included RCTs. The assessment dimensions included: randomization process bias, bias from scheduled interventions, outcome measurement bias, missing data bias, and selective reporting bias. The risk of bias for each dimension was classified into three categories: “low risk,” “moderate risk” and “high risk.” The overall risk of bias in the study was then determined based on the assessment results for each dimension. Two researchers conducted the assessments independently, and any discrepancies were resolved through discussion.
2.5. Statistical analysis
2.5.1. Traditional meta-analysis
For intervention pairs with at least three direct comparisons, traditional meta-analyzes were used to pool effect sizes. For binary outcomes, the odds ratio (OR) and its 95% confidence interval (CI) were used as measures of effect; for continuous outcomes, the mean difference (MD) and its 95% CI were used as measures of effect. The I2 test was used to evaluate the heterogeneity between studies. If I2 < 50% and P > 0.1, the heterogeneity was low, and the fixed effect model was used to merge; If I2 ≥ 50% and P ≤ 0.1, it indicates that there is significant heterogeneity. The random effect model was used to merge. The subgroup and sensitivity analyzes planned at the protocol stage could not be completed; the reasons are set out in the Limitations, and no such analyzes are reported here. Traditional meta-analysis was performed using Revman 5.4 software (The Cochrane Collaboration, London, UK).
2.5.2. Network meta-analysis
A network meta-analysis approach within a Bayesian framework was employed, with a consistency model fitted using the Markov chain Monte Carlo (MCMC) algorithm. Four independent Markov chains are set up, the initial number of iterations is 20,000 times as the annealing period, and then 100,000 iterations are used for parameter estimation, and the Gelman–Rubin statistic is used to evaluate the convergence of the model, which indicates good convergence when the statistic <1.05. For continuous outcomes (change in mTSS), a normal distribution model was fitted; for binary outcomes (ACR20 response and the incidence of serious adverse events), a binomial likelihood with a logit link function was used. A random-effects term was incorporated into the model to account for inter-study heterogeneity, and non-informative priors were applied.
2.5.3. Hypothesis testing
Consistency check: The node-splitting method is used to compare the differences between the results of direct and indirect comparisons; if P > 0.05, this indicates that the results of the direct and indirect comparisons are consistent, and a consistency model is then used for analysis; A P-value ≤0.05 indicated the presence of inconsistency, prompting exploration of the sources of inconsistency and the use of an inconsistency model. Additionally, comparison-adjusted funnel plots were generated to assess small-study effects and publication bias.
2.5.4. Ranking of efficacy
The area under the cumulative ranking probability curve (SUCRA) was used to rank the efficacy of different biologics, and the SUCRA value range was 0–1, and the closer the value was 1, the better the efficacy of the intervention, and the probability of each intervention becoming the best efficacy was reported (ProbBest). Frequentist network meta-analysis, network geometry plotting, and funnel plot generation were performed using the “network” package in Stata 17.0 (StataCorp LLC, College Station, TX, USA), with the significance level set at α = 0.05.
3. Results
3.1. Results of the literature review
3.1.1. Literature inclusion process
A total of 9623 articles were identified in this study. After removing 2862 duplicates using EndNote software, the remaining 6761 articles proceeded to the initial screening stage. By reading the titles and abstracts, 5702 articles that obviously did not meet the inclusion criteria were excluded, the remaining 1059 documents were re-screened, and 603 studies did not meet the research objects, 201 studies that did not meet the requirements of interventions, and 124 studies that could not obtain the full text. After reviewing the full texts of the remaining 131 studies, 77 studies were excluded due to mismatched outcome measures and 27 due to incomplete data, leaving a total of 27 RCTs that met the inclusion criteria. The study selection process is shown in Figure 1.
3.1.2. Key characteristics of the study
Of the 27 (Weinblatt et al. 2003, 2025; Breedveld et al. 2004, 2006, 2018; Cohen et al. 2006; Genovese et al. 2008, 2014; Rigby et al. 2012; Tak et al. 2012; Emery et al. 2014; Blanco et al. 2017; Fleischmann et al. 2017; Smolen et al. 2017; Dokoupilová et al. 2018; Giles et al. 2020; Hetland et al. 2020; Rubbert-Roth et al. 2020; Humby et al. 2021; Buttgereit et al. 2023; Deakin et al. 2023; Rivellese et al. 2023; Taylor et al. 2023; Asano et al. 2024; Cope et al. 2024; Rech et al. 2024; Liu et al. 2025) studies included, the publication time span was from 2003 to 2025, and a total of 11,650 patients were included, with an average age range of 47–61 years. The included studies comprised six biologic agent interventions and two control group interventions. The basic characteristics of the included studies are detailed in Table 1.
Table 1.
Basic characteristics of the included studies
| References | Number of examples (OG/CG) | Age (OG/CG) | Proportion of women (OG/CG) | Biological inhibitor | Observation group intervention (OG) | Control group intervention (CG) | Study area |
|---|---|---|---|---|---|---|---|
| Asano et al. (2024) | 56/28 | –/– | –/– | TNF | GLM | MTX | Japan |
| Blanco et al. (2017) | 137/138 | 55.9 ± 12.3/55.5 ± 12.1 | 79.6%/83.3% | IL17 | Secukinumab | PBO | USA |
| Blanco et al. (2017) | 138/138 | 51.6 ± 12.4/55.5 ± 12.1 | 77.5%/83.3% | Tcell | Abatacept | PBO | USA |
| Breedveld et al. (2004) | 87/88 | 54 | 78.0% | TNF | Infliximab | MTX | Netherlands |
| Breedveld et al. (2018) | 9/12 | 55.6 ± 12.8/53.0 ± 15.3 | 78.0%/92.0% | TNF | Etanercept | PBO | Netherlands |
| Breedveld et al. (2006) | 268/257 | 51.9 ± 14.0/52.0 ± 13.1 | 72.0%/73.9% | TNF | Adalimumab | MTX | Netherlands |
| Buttgereit et al. (2023) | 31/96 | 52.0 (23–73) /54.5 (25–81) | 77.4%/76.0% | TNF | ABBV-3373 | PBO | Germany |
| Cohen et al. (2006) | 308/209 | 52.2 ± 12.2/52.8 ± 12.6 | 81.0%/81.0% | Bcell | Rituximab | MTX | USA |
| Cope et al. (2024) | 110/103 | 48.3 ± 11.6/48.8 ± 10.9 | 76.0%/79.0% | Tcell | Abatacept | PBO | Great Britain |
| Deakin et al. (2023) | 464/235 | 56 (47–66) /59 (51–68) | 68.0%/73.6% | TNF | Adalimumab | PBO | USA |
| Dokoupilová et al. (2018) | 81/81 | 55.1 ± 12.7/54.2 ± 11.0 | 82.7%/80.2% | IL17 | Secukinumab | PBO | Great Britain |
| Emery et al. (2014) | 159/160 | 50.2 ± 11.9/48.6 ± 12.9 | 78.6%/83.8% | TNF | GLM | MTX | Great Britain |
| Fleischmann et al. (2017) | 384/386 | 49.7 ± 12.2/50.7 ± 13.4 | 83.0%/83.0% | TNF | Adalimumab and MTX | PBO | USA |
| Genovese et al. (2014) | 37/54 | –/– | –/– | IL17 | Ixekizumab | PBO | Great Britain |
| Genovese et al. (2008) | 41/40 | 52.5/57.5 | 72.0%/85.0% | Bcell | Ocrelizumab | PBO | Great Britain |
| Giles et al. (2020) | 1538/1542 | 61 ± 7/61 ± 8 | 88.0%/88.0% | IL6 | Tocilizumab | Etanercept | Germany |
| Hetland et al. (2020) | 203/200 | 55.3 ± 15.3/54.6 ± 14.5 | 68.5%/69.5% | TNF | Certolizumab | MTX | Denmark |
| Hetland et al. (2020) | 204/200 | 54.7 ± 14.4/54.6 ± 14.5 | 68.6%/69.5% | Tcell | Abatacept | MTX | Denmark |
| Hetland et al. (2020) | 188/200 | 52.4 ± 14.5/54.6 ± 14.5 | 68.6%/69.5% | IL6 | Tocilizumab | MTX | Denmark |
| Humby et al. (2021) | 79/82 | 55.5 (47.3–65.1) /55.7 (47.7–65.5) | 84.0%/76.0% | IL6 | Tocilizumab | Rituximab | USA |
| Liu et al. (2025) | 136/68 | 47.0 ± 11.2/47.8 ± 12.1 | 86.8%/77.9% | IL6 | Tocilizumab | MTX | USA |
| Rech et al. (2024) | 49/49 | 51 ± 11/49 ± 13 | 63.0%/80.0% | Tcell | Abatacept | PBO | Germany |
| Rigby et al. (2012) | 343/320 | 50.5 ± 11.5/51.8 ± 12.0 | 82.5%/77.5% | Bcell | Ocrelizumab | PBO | Germany |
| Rivellese et al. (2023) | 34/66 | 55.2 ± 12.8/52.9 ± 14.7 | 76.0%/73.0% | Bcell | Rituximab | Tocilizumab | Great Britain |
| Rubbert-Roth et al. (2020) | 303/309 | 55.3 ± 11.4/55.8 ± 11.9 | 82.2%/81.9% | Tcell | Upadacitinib | Abatacept | Switzerland |
| Smolen et al. (2017) | 54/55 | 54.6 ± 11.3/51.1 ± 10.6 | 77.8%/87.3% | IL23 | Guselkumab | MTX | USA |
| Tak et al. (2012) | 282/277 | 53.8 ± 11.6/54.2 ± 11.3 | 83.7%/77.6% | Bcell | Ocrelizumab | PBO | Switzerland |
| Taylor et al. (2023) | 156/79 | 57.5 ± 10.69/55.5 ± 10.64 | 85.0%/82.0% | IL6 | Sarilumab | PBO | USA |
| Weinblatt et al. (2003) | 67/62 | 57.2 ± 11.4/56.0 ± 10.8 | 74.6%/82.3% | TNF | Adalimumab | PBO | Canada |
| Weinblatt et al. (2025) | 147/561 | 58.0 ± 10.7/55.1 ± 11.3 | 86.0%/81.0% | IL6 | Sarilumab | PBO | Canada |
[i] Note: Among the biological inhibitors, “TNF,” “IL17,” “Tcell,” “Bcell,” “IL6,” and “L23” represent TNF-i, IL-17 inhibitors, T cell costimulatory modulators, B cell scavengers, IL-6 receptor antagonists, and IL-23 inhibitors, respectively. “Pbo” and “MTX” represent placebo and placebo combined with MTX, respectively. GLM, golimumab; MTX, methotrexate; OG / CG, observation group / control group; PBO, placebo; TNF, tumor necrosis factor.
3.1.3. Literature quality evaluation results
The Cochrane Collaboration's Risk of Bias 2.0 tool was used to assess the risk of bias of the 27 included RCTs to determine the quality of the literature. On the initial assessment, 18 studies (66.7%) were at low overall risk of bias, and 9 (33.3%) raised some concerns. The assessment was repeated after peer review, with particular attention to trials in which participants and investigators were aware of the allocated treatment. The two biopsy-driven open-label trials (Humby et al. 2021; Rivellese et al. 2023) were re-rated as at high risk of bias in the domains “deviations from intended interventions” and “measurement of the outcome,” and the registry-based comparative analysis (Deakin et al. 2023) was re-rated as at high risk in the randomization domain. After re-assessment, 17 studies (63.0%) were judged to be at low overall risk of bias, 7 (25.9%) to raise some concerns, and 3 (11.1%) to be at high overall risk of bias. The specific results are shown in Table 2.
Table 2.
Results of the literature quality assessment
| References | Bias in randomized processes | Bias due to deviation from the planned intervention | Bias in measurement of the outcome | Bias due to missing outcome data | Bias in selection of the reported result | Overall risk of bias |
|---|---|---|---|---|---|---|
| Asano et al. (2024) | 1 | 1 | 1 | 1 | 1 | Low risk |
| Blanco et al. (2017) | 1 | 1 | 1 | 1 | 1 | Low risk |
| Blanco et al. (2017) | 1 | 1 | 1 | 1 | 1 | Low risk |
| Breedveld et al. (2004) | 2 | 2 | 1 | 2 | 1 | Moderate risk |
| Breedveld et al. (2018) | 1 | 1 | 1 | 1 | 1 | Low risk |
| Breedveld et al. (2006) | 1 | 1 | 1 | 1 | 1 | Low risk |
| Buttgereit et al. (2023) | 1 | 1 | 1 | 1 | 1 | Low risk |
| Cohen et al. (2006) | 2 | 2 | 1 | 2 | 1 | Moderate risk |
| Cope et al. (2024) | 1 | 1 | 1 | 1 | 1 | Low risk |
| Deakin et al. (2023) | 1 | 1 | 1 | 1 | 1 | Low risk |
| Dokoupilová et al. (2018) | 1 | 1 | 1 | 1 | 1 | Low risk |
| Emery et al. (2014) | 1 | 1 | 1 | 1 | 1 | Low risk |
| Fleischmann et al. (2017) | 1 | 1 | 1 | 1 | 1 | Low risk |
| Genovese et al. (2014) | 2 | 2 | 2 | 2 | 1 | Moderate risk |
| Genovese et al. (2008) | 2 | 2 | 2 | 2 | 1 | Moderate risk |
| Giles et al. (2020) | 1 | 1 | 1 | 1 | 1 | Low risk |
| Hetland et al. (2020) | 1 | 1 | 1 | 1 | 1 | Low risk |
| Hetland et al. (2020) | 1 | 1 | 1 | 1 | 1 | Low risk |
| Hetland et al. (2020) | 1 | 1 | 1 | 1 | 1 | Low risk |
| Humby et al. (2021) | 2 | 2 | 1 | 2 | 1 | Moderate risk |
| Liu et al. (2025) | 1 | 1 | 1 | 1 | 1 | Low risk |
| Rech et al. (2024) | 1 | 1 | 1 | 1 | 1 | Low risk |
| Rigby et al. (2012) | 2 | 2 | 1 | 2 | 1 | Moderate risk |
| Rivellese et al. (2023) | 2 | 2 | 1 | 2 | 1 | Moderate risk |
| Rubbert-Roth et al. (2020) | 1 | 1 | 1 | 1 | 1 | Low risk |
| Smolen et al. (2017) | 1 | 1 | 1 | 1 | 1 | Low risk |
| Tak et al. (2012) | 2 | 2 | 1 | 2 | 1 | Moderate risk |
| Taylor et al. (2023) | 1 | 1 | 1 | 1 | 1 | Low risk |
| Weinblatt et al. (2003) | 2 | 2 | 1 | 2 | 1 | Moderate risk |
| Weinblatt et al. (2025) | 1 | 1 | 1 | 1 | 1 | Low risk |
3.2. Results of the meta-analysis
3.2.1. mTSS
A total of 25 studies included the mTSS outcome measure; the evidence network is shown in Figure 2a. The P-values for both the global consistency test and the local consistency test using the node segmentation method were >0.05, indicating good consistency; therefore, a consistency model was employed for the analysis.
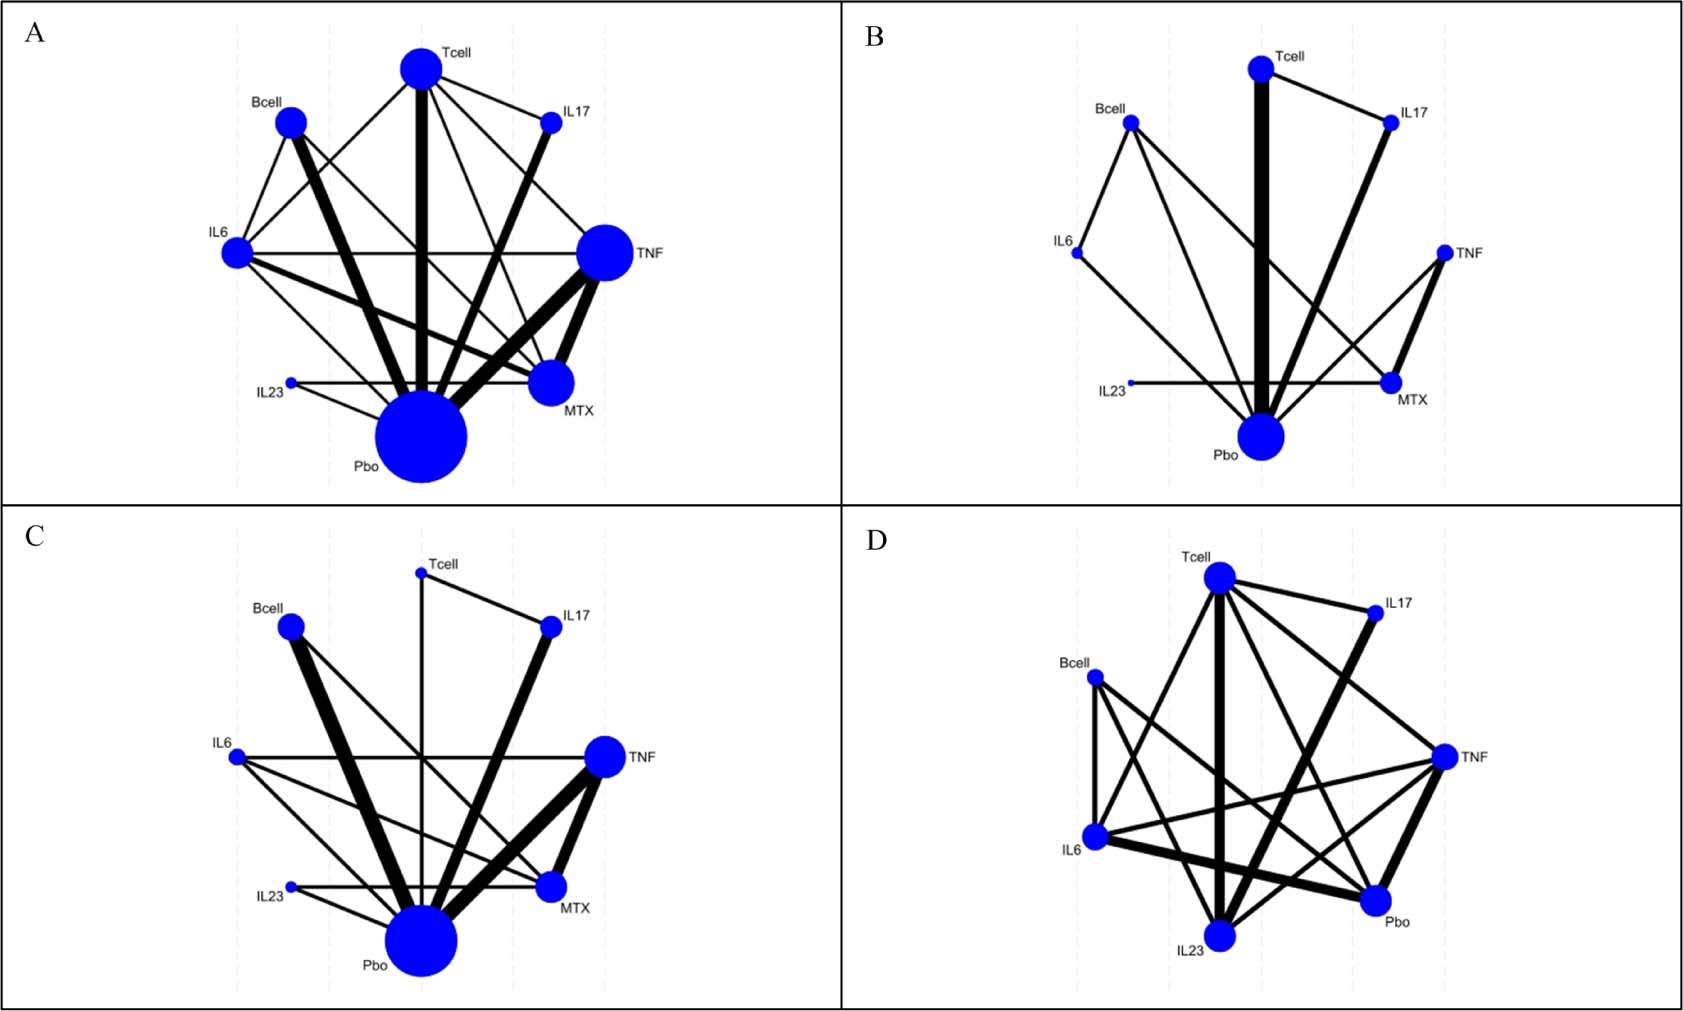
Fig 2.
Network evidence diagrams for the four outcomes. (A) mTSS; (B) bone erosion score; (C) ACR20; (D) serious adverse reactions. Node size is proportional to the number of participants randomized to that class and line width to the number of direct comparisons. mTSS, modified Total Sharp Score.
The results of network meta-analysis showed that TNF-i, IL-17 inhibitors, T cell co-stimulation modulators, B-cell depleting agents, IL-6 receptor antagonists and IL-23 inhibitors were all associated with a significantly smaller increase in mTSS from baseline than placebo, a lower change in mTSS denoting less radiographic progression. Among the six biologic agents, B-cell depleting agent, IL-23 inhibitor, IL-17 inhibitor, IL-6 receptor antagonist, and T-cell co-stimulation modulator were significantly better than TNF-i in improving mTSS, B-cell depleting agent was significantly better than IL-6 receptor antagonist, IL-23 inhibitor was significantly better than IL-6 (P < 0.05), and there was no significant difference in improving mTSS among other biologic agents (P > 0.05) (Table 3).
Table 3.
Results of a network meta-analysis on the impact of different treatment modalities for RA patients on the mTSS
| TNF | −15.67 (−17.81, −13.52) | −14.99 (−18.11, −11.87) | −18.46 (−20.86, −16.06) | −13.73 (−16.17, −11.28) | −18.14 (−21.11, −15.16) |
|---|---|---|---|---|---|
| 15.67 (13.52, 17.81) | IL17 | 0.68 (−3.07, 4.42) | −2.79 (−5.75, 0.16) | 1.94 (−1.06, 4.94) | −2.47 (−5.63, 0.68) |
| 14.99 (11.87, 18.11) | −0.68 (−4.42, 3.07) | Tcell | −3.47 (−7.12, 0.17) | 1.26 (−2.68, 5.20) | −3.15 (−7.41, 1.11) |
| 18.46 (16.06, 20.86) | 2.79 (−0.16, 5.75) | 3.47 (−0.17, 7.12) | Bcell | 4.73 (1.42, 8.04) | 0.32 (−3.17, 3.82) |
| 13.73 (11.28, 16.17) | −1.94 (−4.94, 1.06) | −1.26 (−5.20, 2.68) | −4.73 (−8.04, −1.42) | IL6 | −4.41 (−7.71, −1.11) |
| 18.14 (15.16, 21.11) | 2.47 (−0.68, 5.63) | 3.15 (−1.11, 7.41) | –0.32 (−3.82, 3.17) | 4.41 (1.11, 7.71) | IL23 |
Using SUCRA to rank the efficacy of the six intervention strategies, the results were as follows: B-cell depleting agents >IL-23 inhibitors >IL-17 inhibitors >IL-6 receptor antagonists >T-cell co-stimulatory modulators >TNF-i (Figure 3).
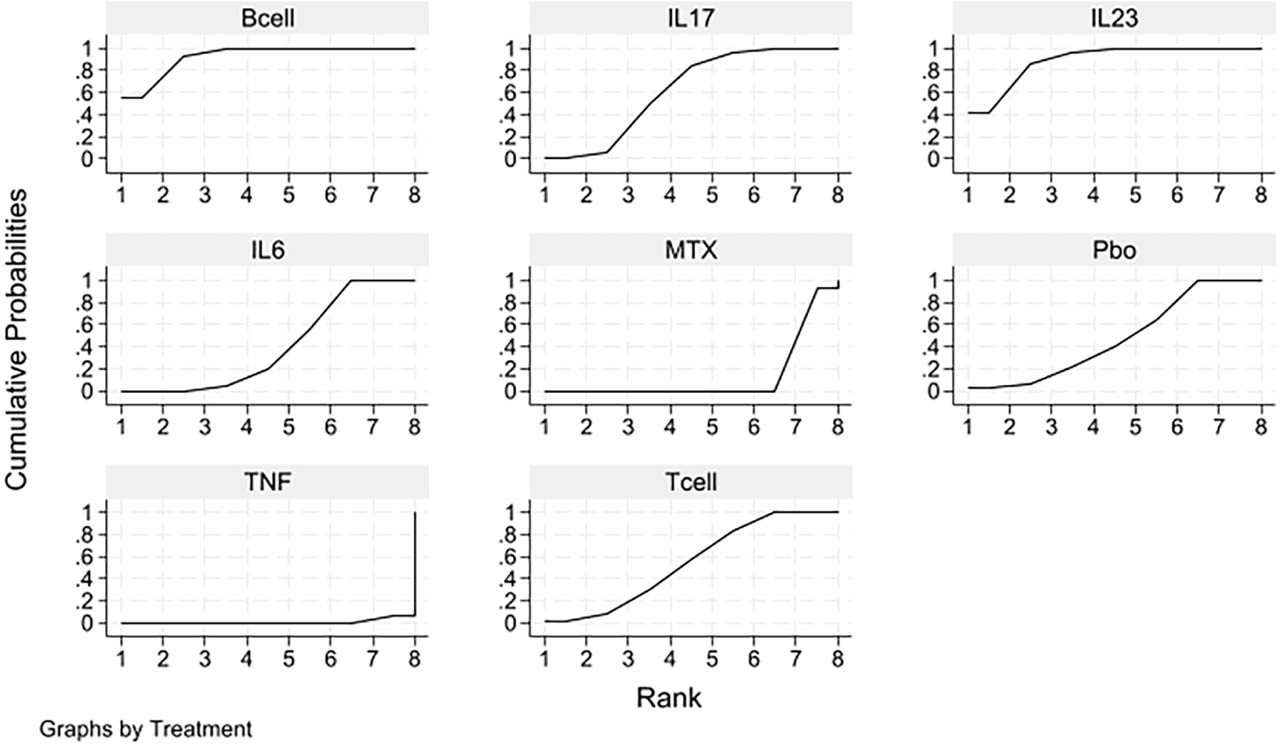
Fig 3.
Cumulative probability plot showing the effect of different treatment approaches on mTSS in patients with RA. mTSS, modified Total Sharp Score; MTX, methotrexate; PBO, placebo; RA, rheumatoid arthritis; TNF, tumor necrosis factor.
3.2.2. Bone erosion score
A total of 13 articles involved bone erosion score indicators. The network evidence chart is shown in Figure 2b. The global inconsistency test and local consistency test of node segmentation method (P > 0.05) showed good consistency, and the consistency model was used for analysis.
The results of network meta-analysis showed that compared with placebo, TNF-i, IL-17 inhibitor, T-cell co-stimulation modulator, B-cell depleting agent, IL-6 receptor antagonist and IL-23 inhibitor could significantly improve the score of bone erosion (P < 0.05). IL-17 inhibitors, T-cell co-stimulation modulators, B-cell depleting agents and IL-6 receptor antagonists were more effective than TNF-i in improving bone erosion scores (P < 0.05), whereas IL-23 inhibitors were not (MD = −0.18, 95% CI −0.37 to 0.02), and no statistically significant difference was detected in any of the remaining pairwise comparisons between biologics (P > 0.05), as shown in Table 4.
Table 4.
Results of a network meta-analysis on the effects of different treatment modalities on bone erosion scores in patients with RA
| TNF | IL17 | Tcell | Bcell | IL6 | IL23 |
|---|---|---|---|---|---|
| TNF | −0.29 (−0.49, −0.09) | −0.17 (−0.33, −0.01) | −0.26 (−0.38, −0.14) | −0.22 (−0.40, −0.05) | −0.18 (−0.37, 0.02) |
| 0.29 (0.09, 0.49) | IL17 | 0.12 (−0.14, 0.38) | 0.03 (−0.20, 0.27) | 0.07 (−0.15, 0.29) | 0.11 (−0.14, 0.37) |
| 0.17 (0.01, 0.33) | −0.12 (−0.38, 0.14) | Tcell | −0.09 (−0.27, 0.09) | −0.05 (−0.29, 0.19) | −0.01 (−0.26, 0.25) |
| 0.26 (0.14, 0.38) | −0.03 (−0.27, 0.20) | 0.09 (−0.09, 0.27) | Bcell | 0.03 (−0.18, 0.25) | 0.08 (−0.15, 0.31) |
| 0.22 (0.05, 0.40) | −0.07 (−0.29, 0.15) | 0.05 (−0.19, 0.29) | −0.03 (−0.25, 0.18) | IL6 | 0.05 (−0.15, 0.24) |
| 0.18 (–0.02, 0.37) | −0.11 (−0.37, 0.14) | 0.01 (−0.25, 0.26) | −0.08 (−0.31, 0.15) | −0.05 (−0.24, 0.15) | IL23 |
The advantages and disadvantages of the six intervention methods were ranked by SUCRA, and the results were B-cell depleting agents >IL-23 inhibitors >IL-17 inhibitors>IL-6 receptor antagonists >T-cell costimulatory modulators >and TNF-i (Figure 4).
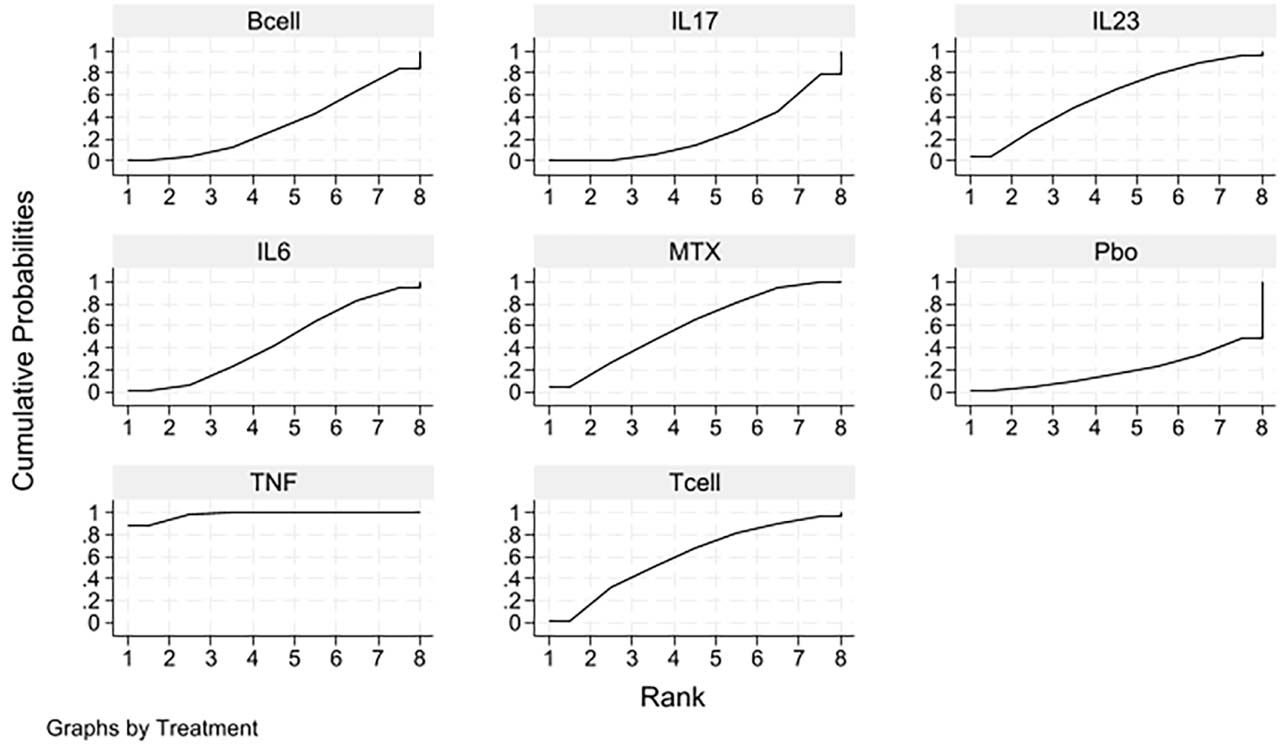
Fig 4.
Cumulative probability plot showing the effect of different treatment modalities on bone erosion scores in patients with RA. MTX, methotrexate; RA, rheumatoid arthritis; TNF, tumor necrosis factor.
3.2.3. ACR20
A total of 20 studies included the ACR20 outcome measure; the network evidence map is shown in Figure 2c. The P-values for both the global consistency test and the local consistency test using the node partitioning method were >0.05, indicating good consistency; therefore, the consistency model was adopted for analysis.
The results of network meta-analysis showed that TNF-i, IL-17 inhibitors, T-cell co-stimulation modulators, B-cell depleting agents, IL-6 receptor antagonists, IL-23 inhibitors and MTX were significantly better than placebo (P < 0.05) in terms of improving the ACR20 compliance rate. Compared with TNF-i, significantly higher odds of an ACR20 response were observed with IL-23 inhibitors (OR = 2.75, 95% CI 1.31–5.76), IL-6 receptor antagonists (OR = 2.12, 95% CI 1.20–3.72) and IL-17 inhibitors (OR = 1.86, 95% CI 1.08–3.20); no other between-class comparison reached statistical significance (as detailed in Table 5).
Table 5.
Results of a network meta-analysis on the impact of different treatment modalities on ACR20 in patients with RA
| TNF | 1.86 (1.08, 3.20) | 1.30 (0.65, 2.61) | 1.12 (0.41, 3.08) | 2.12 (1.20, 3.72) | 2.75 (1.31, 5.76) |
|---|---|---|---|---|---|
| 0.54 (0.31, 0.93) | IL17 | 0.70 (0.29, 1.69) | 0.61 (0.19, 1.90) | 1.14 (0.55, 2.35) | 1.48 (0.73, 3.00) |
| 0.77 (0.38, 1.54) | 1.42 (0.59, 3.44) | Tcell | 0.86 (0.31, 2.43) | 1.63 (0.66, 3.98) | 2.11 (0.76, 5.82) |
| 0.89 (0.32, 2.44) | 1.65 (0.53, 5.18) | 1.16 (0.41, 3.27) | Bcell | 1.88 (0.59, 5.98) | 2.44 (0.70, 8.53) |
| 0.47 (0.27, 0.83) | 0.88 (0.43, 1.81) | 0.62 (0.25, 1.51) | 0.53 (0.17, 1.68) | IL6 | 1.30 (0.54, 3.12) |
| 0.36 (0.17, 0.76) | 0.68 (0.33, 1.37) | 0.47 (0.17, 1.31) | 0.41 (0.12, 1.43) | 0.77 (0.32, 1.85) | IL23 |
The results showed that IL-23 inhibitor was the most likely to be the best intervention measure, followed by IL-6 receptor antagonist, IL-17 inhibitor, B-cell depleting agent, T-cell co-stimulation modulator, TNF-i, MTX, and placebo (Figure 5).
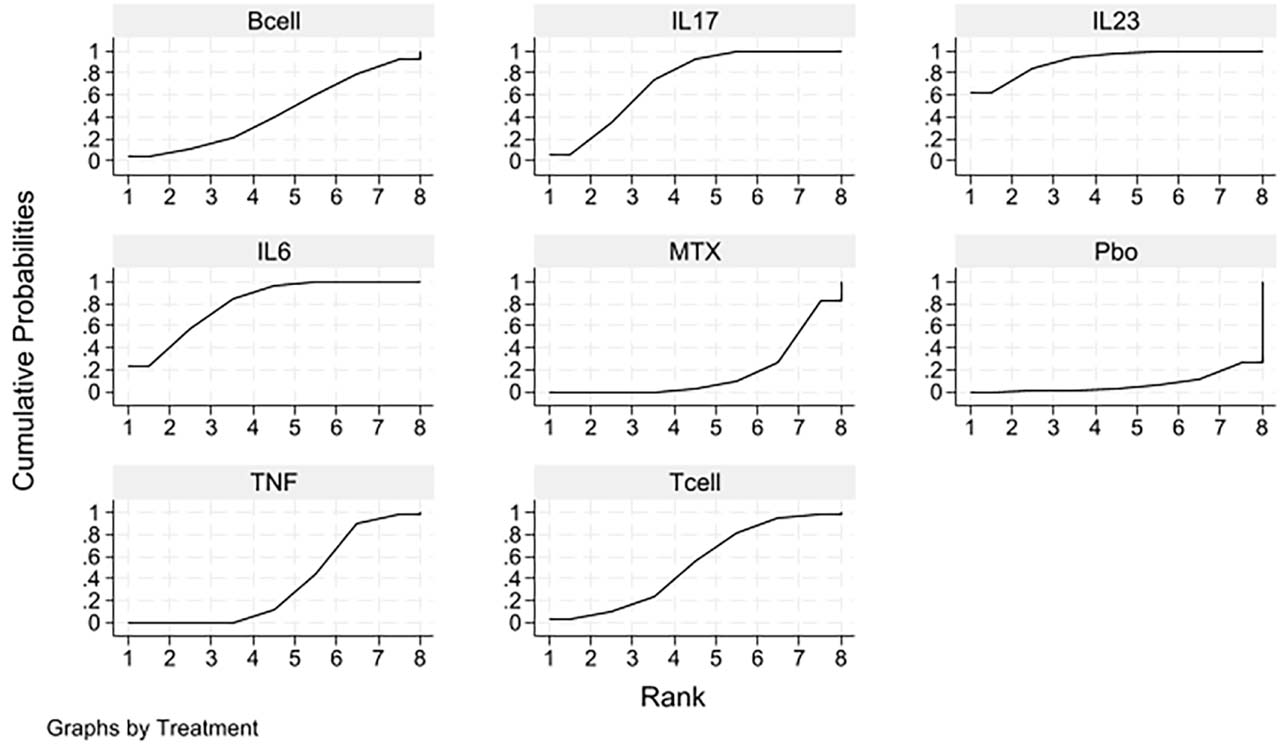
Fig 5.
Cumulative probability plot showing the effect of different treatment approaches on ACR20 in patients with RA. MTX, methotrexate; RA, rheumatoid arthritis; TNF, tumor necrosis factor.
3.2.4. Serious adverse reactions
A total of 10 studies included outcome measures relating to serious adverse events; the network evidence map is shown in Figure 2d. The global inconsistency test and the local consistency test of node segmentation were both >0.05, indicating good consistency, and the consistency model was used for analysis.
The results of network meta-analysis showed that there was no significant difference between biologics (T-cell co-stimulation modulators, TNF-i, IL-6 receptor antagonists, IL-23 inhibitors, IL-17 inhibitors, and B-cell depleting agents) compared with placebo in terms of the incidence of serious adverse reactions (P > 0.05). Among the biologic classes, the only comparison reaching statistical significance was that between IL-23 inhibitors and IL-6 receptor antagonists (OR = 0.55, 95% CI 0.31–0.96); no other pairwise comparison differed significantly (P > 0.05). These estimates derive from only 10 of the 27 included trials and were not disaggregated by adverse-event subtype, so they support only the statement that, on the limited data currently available, no consistent difference in the overall incidence of serious adverse events was detected between the drug classes; they do not establish that the safety of these classes is comparable (see Table 6 for details).
Table 6.
Results of a network meta-analysis on the impact of different treatment modalities for RA patients on serious adverse reactions
| T cell | 1.10 (0.43, 2.78) | 0.75 (0.28, 2.02) | 1.36 (0.47, 3.98) | 1.17 (0.42, 3.31) | 0.87 (0.34, 2.21) |
|---|---|---|---|---|---|
| 0.91 (0.36, 2.32) | TNF | 0.68 (0.43, 1.08) | 1.24 (0.64, 2.41) | 1.07 (0.59, 1.94) | 0.79 (0.45, 1.39) |
| 1.34 (0.50, 3.63) | 1.47 (0.93, 2.33) | IL6 | 1.83 (1.05, 3.20) | 1.57 (0.96, 2.58) | 1.17 (0.65, 2.11) |
| 0.73 (0.25, 2.14) | 0.80 (0.42, 1.55) | 0.55 (0.31, 0.96) | IL23 | 0.86 (0.49, 1.51) | 0.64 (0.33, 1.24) |
| 0.85 (0.30, 2.41) | 0.94 (0.52, 1.70) | 0.64 (0.39, 1.05) | 1.16 (0.66, 2.05) | IL17 | 0.74 (0.40, 1.38) |
| 1.15 (0.45, 2.91) | 1.26 (0.72, 2.21) | 0.86 (0.47, 1.55) | 1.57 (0.81, 3.03) | 1.34 (0.73, 2.49) | Bcell |
Using SUCRA to rank the safety of 6 types of intervention (the lower the SUCRA value, the higher the safety), the results are: IL-23 inhibitors >T-cell costimulatory modulators >TNF-i >IL-6 receptor antagonists >IL-17 inhibitors >B-cell depleting agents (Figure 6).
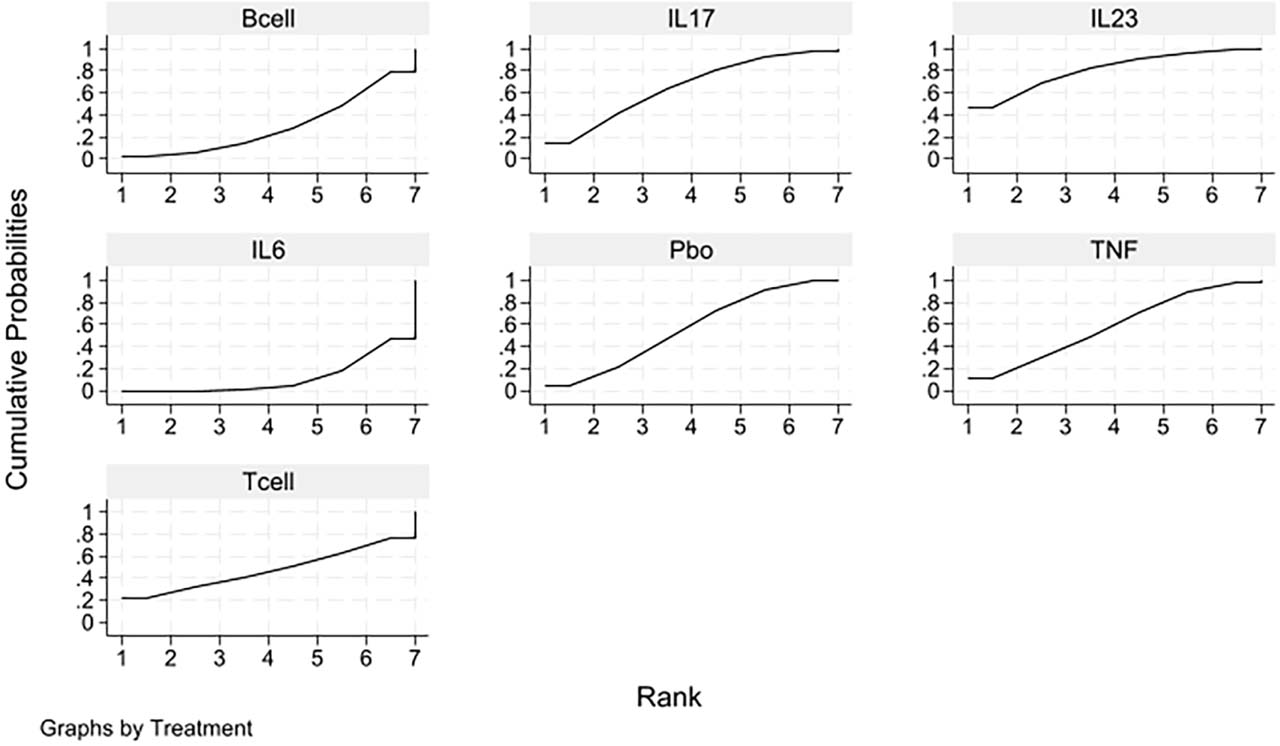
Fig 6.
Cumulative probability plot showing the impact of different treatment approaches on serious adverse reactions in patients with RA. RA, rheumatoid arthritis; TNF, tumor necrosis factor.
3.3. Results of the publication bias test
The publication bias test was conducted on the four outcome indicators. The results showed that some scattered points of mTSS and bone erosion scores fell outside the funnel diagram, as shown in Figures 7a and 7b, suggesting that there may be a small sample effect and publication bias; the scatterplots for ACR20 and serious adverse events in the funnel plots are largely concentrated in the upper part of the plots and show good symmetry on both sides (Figures 7c and 7d), suggesting that the likelihood of publication bias in this study is low. Egger test was further performed, and the results showed that mTSS P = 0.225, bone erosion score P = 0.137, ACR20 P = 0.485, and serious adverse reactions P = 0.507, suggesting that there was no small sample study effect in the included studies.
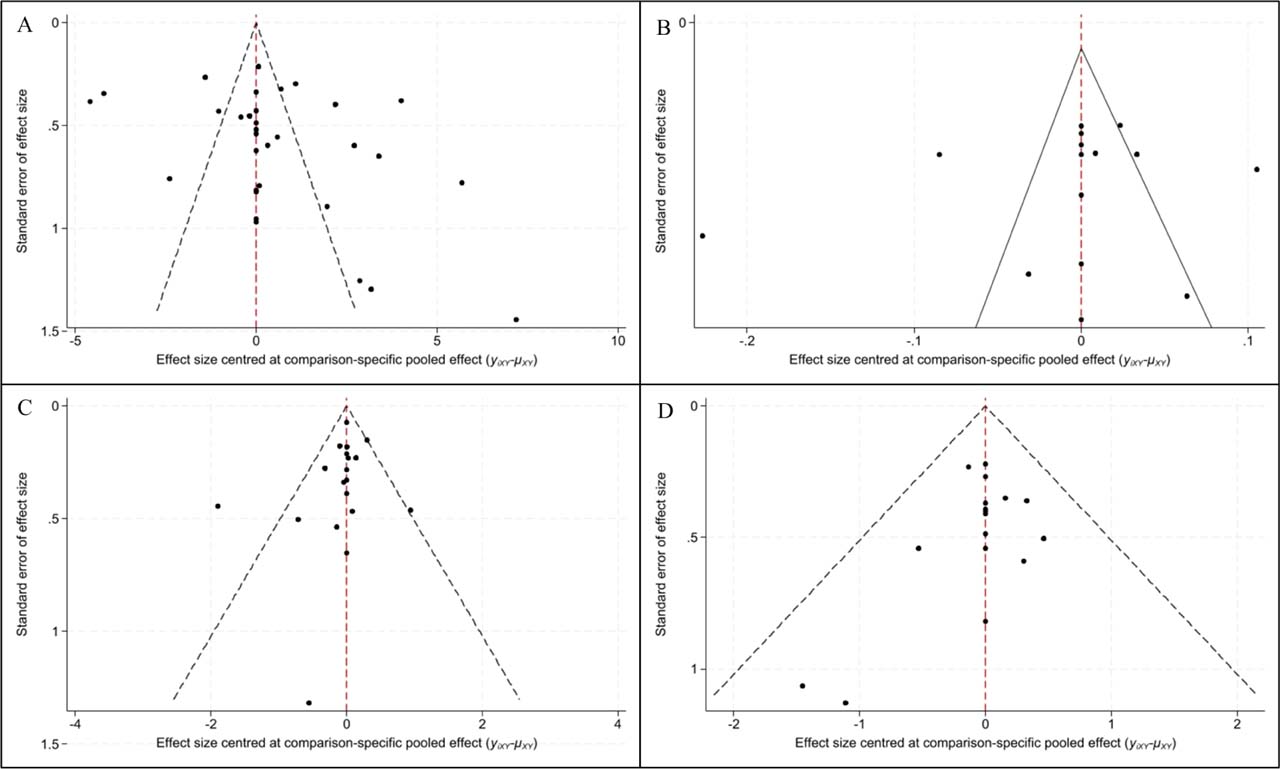
Fig 7.
Publication bias funnel plots. (A) mTSS; (B) bone erosion score; (C) ACR20; (D) serious adverse reactions. mTSS, modified Total Sharp Score.
In Figures 7a–7d are the publication bias funnels of the index mTSS, bone erosion score, ACR20 and severe adverse reactions, respectively.
4. Discussion
In this study, the inhibitory effects of six types of biologics (TNF-i, IL-17 inhibitors, T-cell co-stimulation modulators, B-cell depleting agents, IL-6 receptor antagonists, and IL-23 inhibitors) on radiological progression in patients with RA were systematically compared by network meta-analysis. The study included 27 high-quality RCTs involving a total of 11,650 patients, and conducted a comprehensive analysis focusing on four primary outcome measures: mTSS, bone erosion scores, ACR20 response rates, and serious adverse events. The results not only verified the universal effectiveness of bDMARDs compared with placebo in inhibiting the radiological progress of RA, but also revealed the significant differences in the efficacy of drugs with different mechanisms in delaying the destruction of joint structure.
4.1. Differences in the inhibitory effects of biologics with different mechanisms of action on radiological progression and their clinical significance
The most important finding of this study is that, in terms of inhibiting mTSS progression, B-cell depleting agents, IL-23 inhibitors, IL-17 inhibitors, IL-6 receptor antagonists, and T-cell co-stimulation modulators were all significantly superior to TNF-i, with B-cell depleting agents and IL-23 inhibitors ranking the top two in efficacy ordering. This ordering should be read with caution: the B-cell depleting and IL-23 inhibitor nodes are informed by few trials and, for several comparisons, exclusively by indirect evidence, so SUCRA expresses the probability of superiority under the fitted model rather than an established clinical hierarchy. For a long time, TNF-i, as the earliest widely used bDMARDs, have held the position of first-line biologic agents in RA treatment (Nair et al. 2022). However, the results of this study suggest that drugs with other mechanisms of action, especially B-cell depleting agents and IL-23 inhibitors, may provide better joint structure protection in patients in the context of imaging progression-free treatment as the core goal of achieving the standard treatment.
B-cell depleting agents (such as rituximab) are significantly more effective than TNF-i in suppressing mTSS, ranking first in the SUCRA score; previous real-world studies have also demonstrated that rituximab is highly effective (Li et al. 2024). In the pathogenesis of RA, B cells not only differentiate into plasma cells to produce autoantibodies such as rheumatoid factor and anti-citrullinated protein antibodies but also act as antigen-presenting cells to activate T cells and participate in the regulation of inflammatory responses and bone destruction by secreting various cytokines (Takanashi et al. 2023). B cells infiltrate in large numbers into the lymphoid follicle-like structures within the joints and are directly involved in the activation of osteoclasts (Scherer et al. 2022). Therefore, clearing B cells can block multiple inflammatory and osteogenic pathways from upstream, resulting in a stronger joint protective effect (Scherer et al. 2022). The superior performance of B-cell depleting agents in terms of bone erosion scores in this study further supports this mechanism.
Previous studies have shown that IL-23 inhibitors have good therapeutic efficacy in chronic inflammatory diseases (Jairath et al. 2024). This study confirmed that IL-23 inhibitors also performed well in RA treatment, significantly outperforming TNF-i and IL-6 receptor antagonists in mTSS inhibition, and SUCRA ranked second only to B-cell depleting agents, which expanded the understanding of the role of IL-23/IL-17 axis in RA bone destruction. Although the central role of the IL-23/IL-17 pathway in the pathogenesis of spondyloarthritis, including ankylosing spondylitis and psoriatic arthritis, has been well established (Mohanakrishnan et al. 2022). However, in the field of RA, the conventional view holds that both Th1 and Th17 cells are involved in the pathogenesis; as a key factor in the differentiation and maintenance of Th17 cells, the role of IL-23 cannot be overlooked (Toghi et al. 2023). The results of this study suggest that blocking IL-23 may effectively delay radiographic progression in RA by inhibiting Th17 cell-mediated osteoclast activation. The performance of IL-17 inhibitors in this study was also superior to that of TNF-i. IL-17 is a potent inducer of osteoclast production and activation, which can promote the expression of receptor activator of nuclear factor kappa-B ligand (RANKL) and directly drive the occurrence of bone erosion (Toghi et al. 2023). Consequently, blocking IL-17 may more directly interfere with the final stages of bone destruction, which may explain why it is more effective than TNF-i in inhibiting radiographic progression.
4.2. Comparison with previous network meta-analyzes
Earlier network meta-analyzes of bDMARDs in RA have been directed mainly at clinical response (ACR20/50/70) and disease-activity remission; those that examined structural outcomes were largely confined to TNF-i, abatacept, tocilizumab and rituximab, and did not include agents directed at the IL-23/IL-17 axis. The present analysis differs from them in three respects. First, the search was extended to 31 December 2025, which brings in trials published after the search dates of those reviews. Second, IL-17 and IL-23 inhibitors were entered as separate nodes, so that the IL-23/IL-17 axis could be compared directly with cytokine-directed and cell-directed strategies within a single radiographic network. Third, the evidence base was enlarged to 27 RCTs and 11,650 patients, which afforded the precision needed to detect the between-class differences in mTSS reported here. The finding that IL-23 inhibition ranks immediately behind B-cell depletion for structural protection is, to our knowledge, new; because it rests on a small number of trials, we present it as a hypothesis for confirmation rather than as an established result.
4.3. The balance between efficacy and safety
The secondary outcome analysis of this study showed that all types of biologics were significantly better than placebo in terms of ACR20 compliance rate, but there were some differences in the ranking of efficacy and radiological outcomes. IL-23 inhibitors also ranked first in terms of ACR20 response rates; however, the differences between the various drug classes in terms of clinical symptom improvement were not as pronounced as those observed in radiological outcomes. This phenomenon suggests that the improvement of clinical symptoms is not completely parallel to the benefit of joint structure protection. Some drugs performed well in rapidly controlling inflammation and improving patients’ subjective symptoms but may be relatively less effective in inhibiting bone destruction. Consequently, when implementing standard-of-care treatment strategies, clinicians should recognize that clinical remission and radiological progression-free status are two interrelated but distinct treatment objectives. Patients who achieve clinical remission have a significantly reduced risk of radiological progression, but not completely eliminated. For patients pursuing strict treat-to-target goals, especially those who are young, have a short disease duration, or have multiple poor prognostic factors, radiographic non-progression should be regarded as a treatment endpoint equally important as clinical remission. In terms of safety, this study found no significant difference in the incidence of serious adverse reactions between various biologics compared with placebo, and no statistical difference was shown between the various drugs, which was consistent with the results of the network META-analysis of TNF-i by He et al. (2022). This result supports a favorable safety profile for bDMARDs in the treatment of RA. It should be noted, however, that the overall incidence of serious adverse reactions is low, and the sample size of the RCTs included in this study has limited power to detect rare adverse events. In the real world, safety concerns such as infection risk, infusion reactions, and latent tuberculosis reactivation may still vary among different biologic agents, and clinical selection should involve individualized consideration based on the patient’s specific circumstances (Suto et al. 2023).
4.4. Limitations of the study and directions for future research
This study has the following limitations: First, the included RCTs exhibited some heterogeneity in terms of baseline disease activity, prior treatment history, and concomitant medications. Although a random-effects model was employed to accommodate this, the heterogeneity may still have influenced the results. Secondly, there are few studies providing direct comparisons between certain interventions, and some efficacy estimates rely primarily on indirect evidence. Although consistency tests have confirmed that there is no significant difference between the results of direct and indirect comparisons, more head-to-head RCTs are still needed to provide direct comparative evidence. Third, this study mainly focuses on radiological progression after 12 months of treatment, but RA is a chronic progressive disease, and longer-term radiological outcomes (such as 2 years and 5 years) are more critical to clinical decision-making and follow-up studies need to include data with longer follow-up time. Fourth, three of the included studies were judged to be at high overall risk of bias, and a further seven raised some concerns, which may affect the overall quality of evidence. Fifth, the efficacy ranking of network meta-analysis only reflects the statistical probability and cannot be equivalent to the absolute order of merit and inferiority in clinical practice, and needs to be comprehensively considered in combination with drug accessibility, patient preference, safety characteristics, economic cost and other factors.
Sixth, several analyses planned at the protocol stage could not be completed, and have been removed from the Methods rather than reported: prior bDMARD exposure, baseline disease activity and concomitant MTX dose were reported too inconsistently across trials to define defensible subgroups, and restricting the analysis to trials at low risk of bias disconnected the sparsely informed IL-23 and B-cell depleting nodes from the network. This deviation from the registered protocol is declared here. Seventh, the evidence base is uneven between classes. The IL-23 node rests on very few trials and largely on indirect evidence, and no included trial contributed serious adverse event data for this class, so its position in the safety ranking reflects the structure of the network rather than observed events. Serious adverse events were reported by only 10 trials and were not disaggregated by event type, so the safety findings support only the statement that no difference was detected on the data available.
Based on the results of this study, the following suggestions are put forward for future RA clinical research: Firstly, more head-to-head RCTs comparing different classes of bDMARDs should be conducted, particularly studies that use radiological progression as the primary outcome, in order to provide a higher level of direct comparative evidence to inform clinical decision-making; Second, follow-up studies should extend the follow-up time to evaluate the long-term impact of different biological agents on radiology progress; Third, exploratory research on biomarkers should be strengthened to identify biomarkers that can predict the radiological inhibition effect of different drugs to help precision medicine; Fourth, subsequent research should focus on the associations between radiographic outcomes, functional outcomes, and quality of life outcomes, clarifying the actual impact of inhibiting radiographic progression on patients’ long-term functional prognosis.
5. Conclusion
The results showed that B-cell depleting agents and IL-23 inhibitors performed the best in inhibiting mTSS progression, significantly better than TNF-i. IL-17 inhibitors and IL-6 receptor antagonists also showed radiographic protection over TNF-i. With regard to safety, there was no significant difference in the incidence of serious adverse reactions between the various biologics and the placebo. This study provides evidence-based medicine basis for clinicians to choose biological agents under the background of no progress in imaging as the goal of treatment. In clinical practice, B-cell depleting agents, IL-23 inhibitors or IL-17 inhibitors may be considered as first-line treatments for patients at high risk of radiographic progression; for patients who have failed to achieve radiographic remission despite treatment with TNF-i, switching to one of the aforementioned agents may be beneficial. In the future, more head-to-head studies and long-term follow-up data are needed to further validate the conclusions of this study and explore individualized treatment strategies.
Acknowledgments
Not applicable.
Notes
[9] Contributed by Authors contributions
Di Liu, Daqing Nie—designed the study and carried them out; Di Liu, Na Yuan, Guimei Yu—supervised the data collection, Di Liu, Na Yuan, Guimei Yu—analyzed the data, Di Liu, Na Yuan, Guimei Yu—interpreted the data, Di Liu, Daqing Nie—prepared the manuscript for publication and reviewed the draft of the manuscript. All authors have read and approved the manuscript.
Notes
Supplementary Table S1.
Full electronic search strategies
| Platform/interface | Date searched | Coverage (from – to) | Limits or filters applied | Search strategy |
|---|---|---|---|---|
| PubMed/MEDLINE | March 20, 2026 | inception – 31 Dec 2025 | None | #1 “Arthritis, Rheumatoid”[MeSH] OR “rheumatoid arthritis”[tiab] OR “RA”[tiab] #2 “Biological Products”[MeSH] OR “Antirheumatic Agents”[MeSH] OR biologic*[tiab] OR bDMARD*[tiab] OR “tumor necrosis factor inhibitor*”[tiab] OR adalimumab[tiab] OR etanercept[tiab] OR infliximab[tiab] OR certolizumab[tiab] OR golimumab[tiab] OR tocilizumab[tiab] OR sarilumab[tiab] OR abatacept[tiab] OR rituximab[tiab] OR ocrelizumab[tiab] OR secukinumab[tiab] OR ixekizumab[tiab] OR guselkumab[tiab] #3 “randomized controlled trial”[pt] OR randomi*[tiab] OR “Radiography”[MeSH] OR “Sharp score”[tiab] OR “van der Heijde”[tiab] OR “joint space narrowing”[tiab] OR “bone erosion”[tiab] #1 AND #2 AND #3 |
| Embase | March 20, 2026 | inception – 31 Dec 2025 | None | #1 ‘rheumatoid arthritis’/exp OR ‘rheumatoid arthritis’:ti,ab OR ‘ra’:ti,ab #2 ‘biological product’/exp OR ‘antirheumatic agent’/exp OR biologic*:ti,ab OR bdmard*:ti,ab OR ‘tumor necrosis factor inhibitor*’:ti,ab OR adalimumab:ti,ab OR etanercept:ti,ab OR infliximab:ti,ab OR certolizumab:ti,ab OR golimumab:ti,ab OR tocilizumab:ti,ab OR sarilumab:ti,ab OR abatacept:ti,ab OR rituximab:ti,ab OR ocrelizumab:ti,ab OR secukinumab:ti,ab OR ixekizumab:ti,ab OR guselkumab:ti,ab #3 ‘randomized controlled trial’/exp OR randomi*:ti,ab OR ‘radiography’/exp OR ‘sharp score’:ti,ab OR ‘van der heijde’:ti,ab OR ‘joint space narrowing’:ti,ab OR ‘bone erosion’:ti,ab #1 AND #2 AND #3 |
| Web of Science Core Collection | March 20, 2026 | inception – 31 Dec 2025 | None | #1 TS = (“rheumatoid arthritis” OR “RA”) #2 TS = (biologic* OR bDMARD* OR “tumor necrosis factor inhibitor*” OR adalimumab OR etanercept OR infliximab OR certolizumab OR golimumab OR tocilizumab OR sarilumab OR abatacept OR rituximab OR ocrelizumab OR secukinumab OR ixekizumab OR guselkumab) #3 TS = (randomi* OR “randomized controlled trial”) OR TS = (“Sharp score” OR “van der Heijde” OR “joint space narrowing” OR “bone erosion”) #1 AND #2 AND #3 |
| CENTRAL | March 20, 2026 | inception – 31 Dec 2025 | None | #1 MeSH descriptor: [Arthritis, Rheumatoid] explode all trees OR (“rheumatoid arthritis” OR “RA”):ti,ab #2 MeSH descriptor: [Biological Products] explode all trees OR MeSH descriptor: [Antirheumatic Agents] explode all trees OR (biologic* OR bDMARD* OR “tumor necrosis factor inhibitor*” OR adalimumab OR etanercept OR infliximab OR certolizumab OR golimumab OR tocilizumab OR sarilumab OR abatacept OR rituximab OR ocrelizumab OR secukinumab OR ixekizumab OR guselkumab):ti,ab #3 (“randomized controlled trial”):pt OR randomi*:ti,ab OR MeSH descriptor: [Radiography] explode all trees OR (“Sharp score” OR “van der Heijde” OR “joint space narrowing” OR “bone erosion”):ti,ab #1 AND #2 AND #3 |