
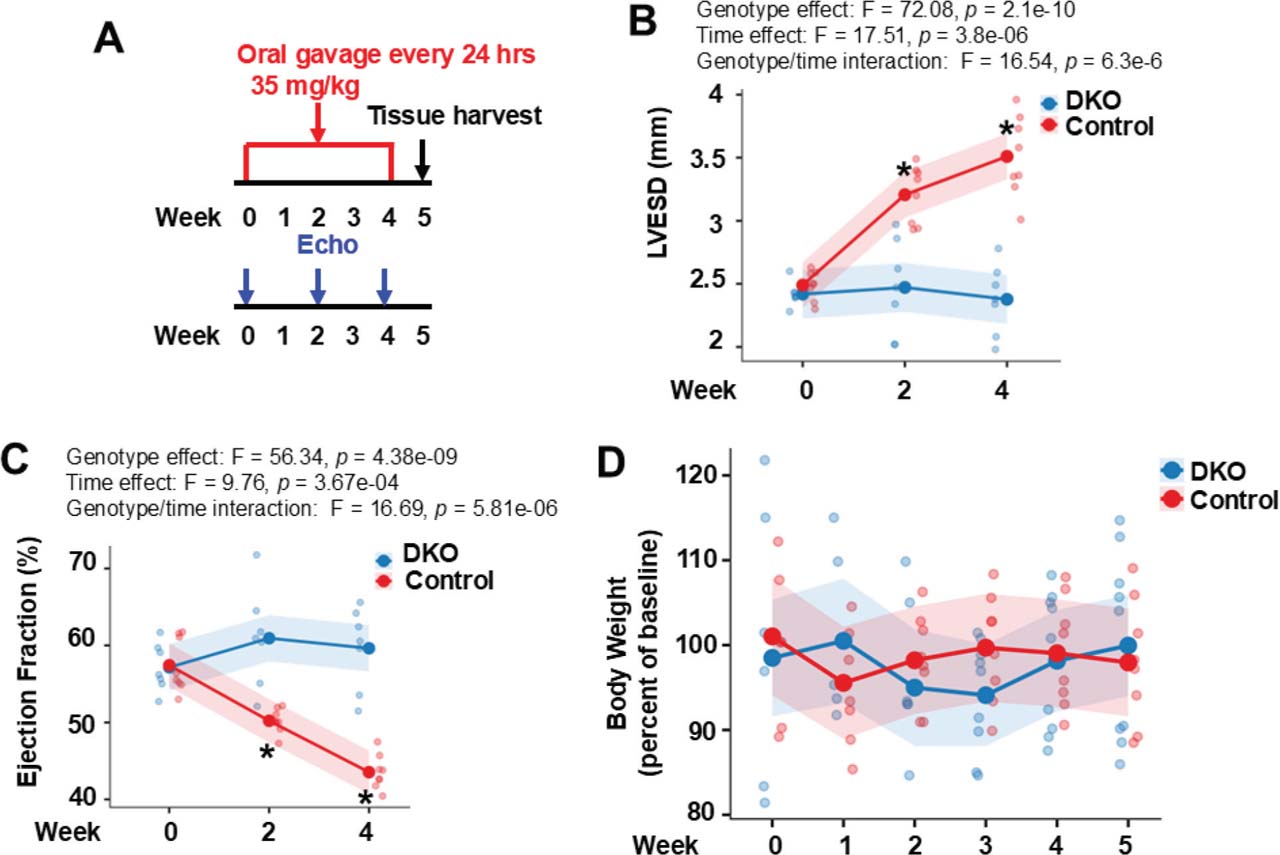
Fig 1.
Double ROCK deletion in cardiomyocytes is protective against ponatinib-induced CTX. (A) An experimental scheme using 6–8-month-old male control and DKO mice subjected to ponatinib treatment. Cardiac structure and function were monitored by multiple echocardiograms(Echo).(B) LVESD increased over time in control but not in DKO mice. The same pattern has been found in left ventricular end diastolic dimension (genotype effect: F = 52.31, p = 1.03e−08). (C) EF declined progressively in control but not in DKO mice. The same pattern has been found in FS (genotype effect: F = 67.57, p = 4.82e−10). (D) No significant reductions of body weight in two ponatinib-treated groups during the entire course (all p > 0.05). (B–D): N = 8 mice in each group. For statistical analysis, p-values were calculated using two-way repeated-measures ANOVA followed by post hoc multiple-comparison testing for (B,C) and two-way repeated-measures ANOVA was used to assess group differences over time for (D). DKO, inducible cardiomyocyte-specific ROCK1 and ROCK2 double knockout; EF, ejection fraction; FS, fractional shortening; LVESD, left ventricular end systolic dimension; ROCK, Rho-associated coiled-coil containing kinase.
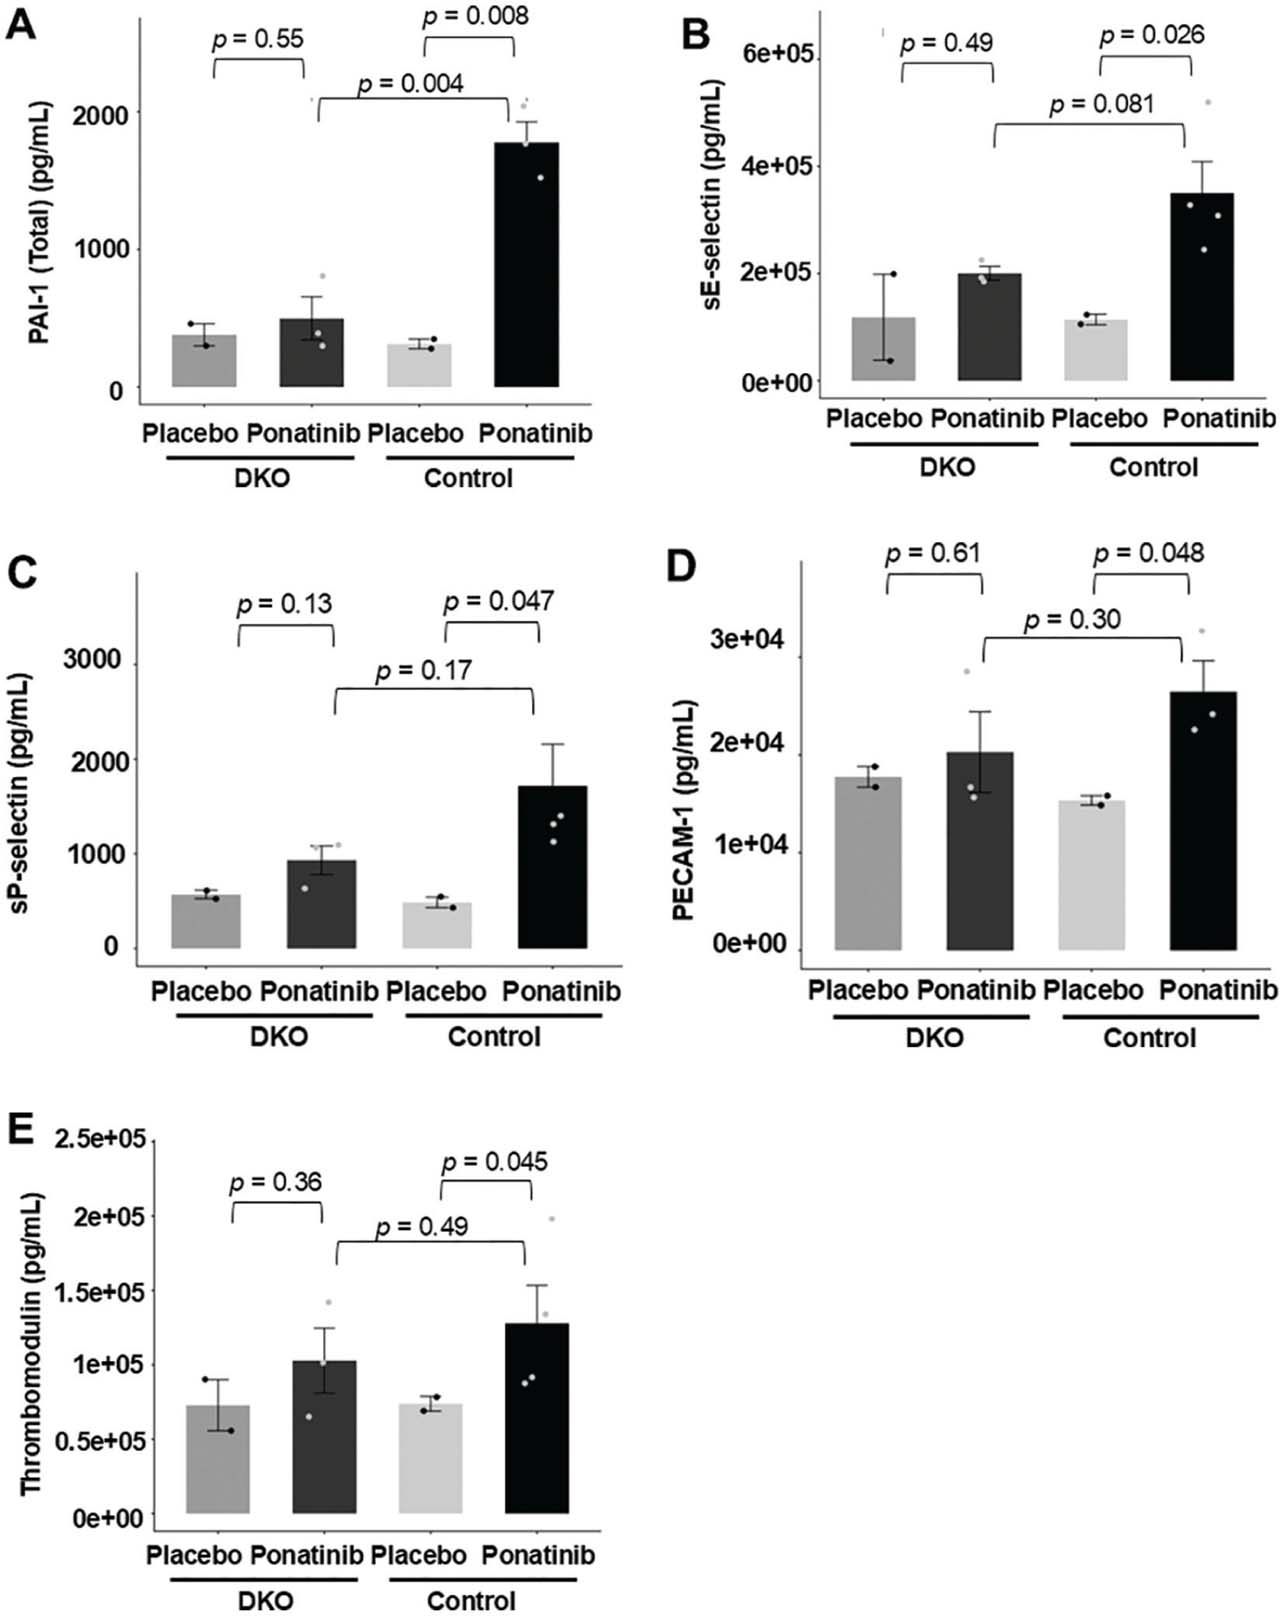
Fig 2.
Reduced vascular toxicity biomarkers in ponatinib-treated DKO mice. Whole blood was collected from the left ventricle of both ponatinib-treated DKO and control mice. Serum levels of PAI-1 (Total) (A), sE-selectin (B), sP-selectin (C), PECAM-1 (D), and Thrombomodulin (E) were measured using the Panel 1 7-Plex Discovery Assay® Array (Eve Technologies). Ponatinib treatment significantly increased serum levels of PAI-1 (Total), sE-selectin, sP-selectin, PECAM-1, and Thrombomodulin (A–E) in control mice. In contrast, these markers showed only the trend of increased circulating levels, but not significant in treated DKO mice (A–E). N = 3–4 mice in each group. For statistical analysis, p-values were calculated using an unpaired two-tailed Student’s t-test for (A–E). DKO, inducible cardiomyocyte-specific ROCK1 and ROCK2 double knockout; ROCK, Rho-associated coiled-coil containing kinase.
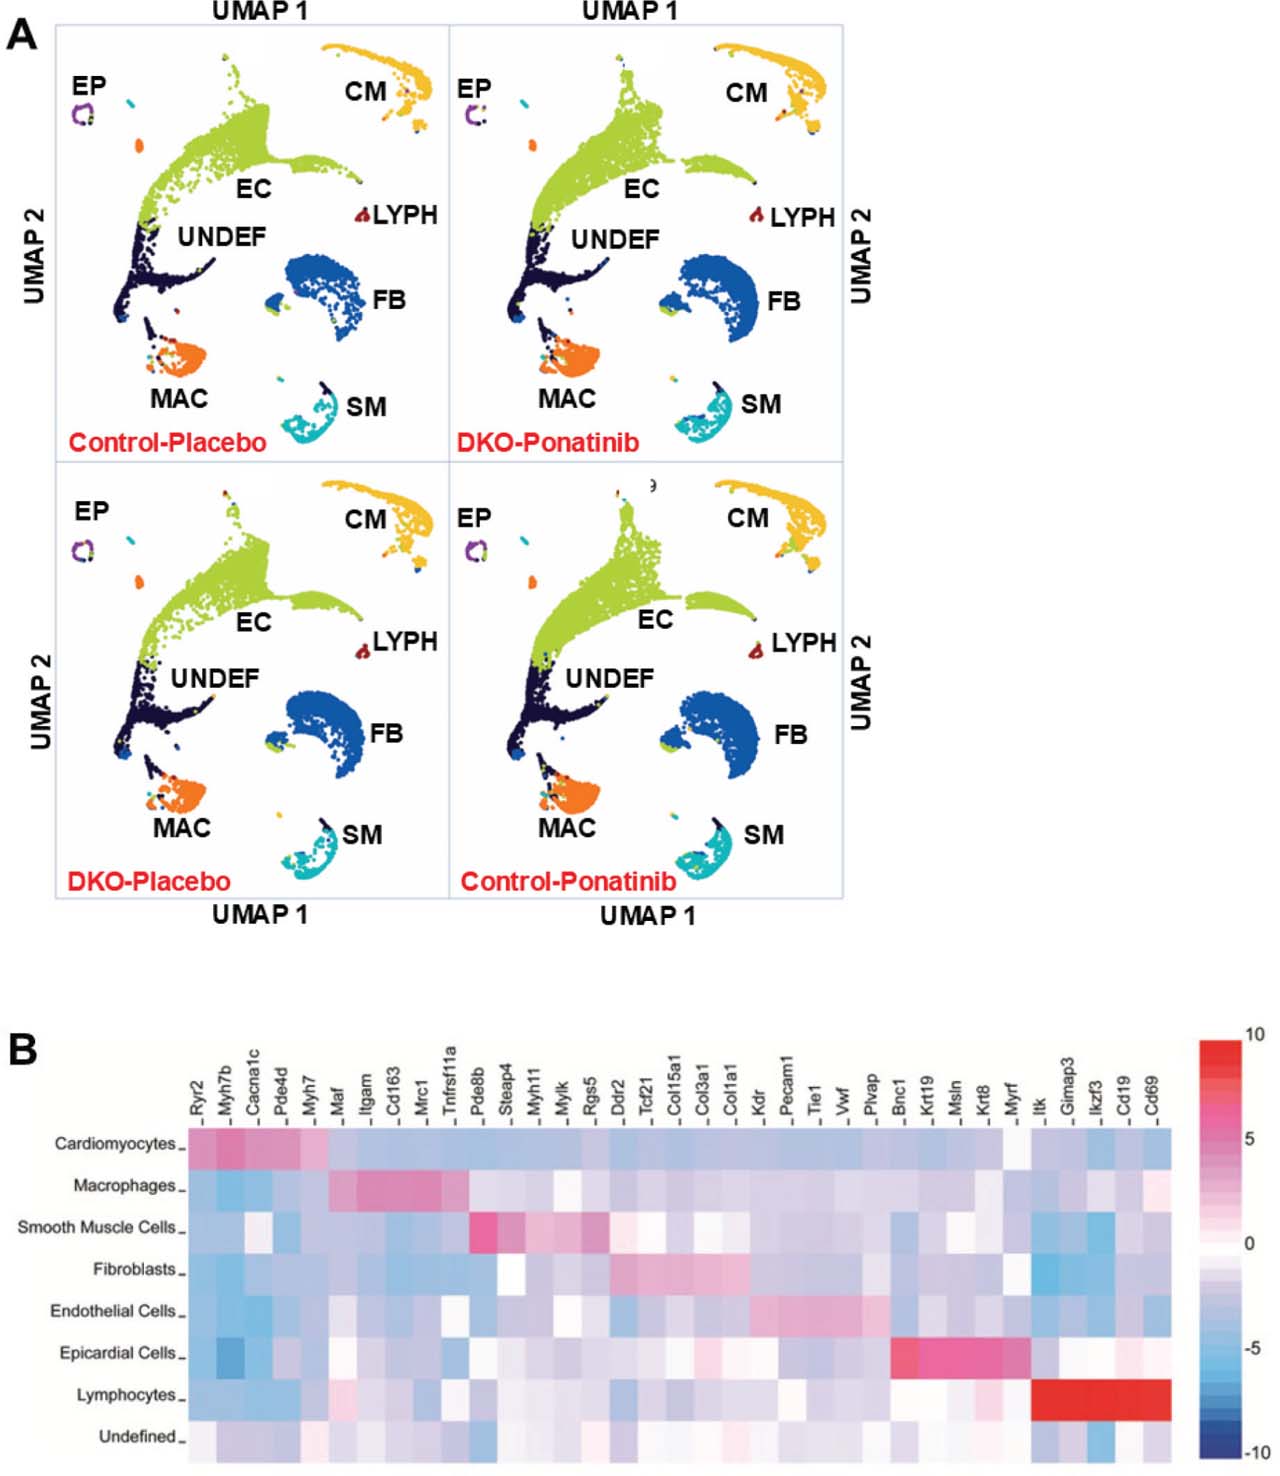
Fig 3.
Data from snRNA-seq reveals similar distribution of major cell types in DKO and control hearts with or without ponatinib treatment. (A) Loupe Browser output displayed as two-dimensional UMAP visualization after unsupervised clustering for 61,970 nuclei from 4 groups of ventricular samples including the control-placebo (10,997 nuclei), DKO-placebo (12,411 nuclei), control-ponatinib (21,731 nuclei), and DKO-ponatinib (16,831 nuclei). Seven major cell types and one UNDEF were identified for each group, including cardiomyocytes (CM), EC, fibroblasts (FB), macrophages/monocytes (MAC), SM, EP, and LYPH. (B) Gene expression heatmap depicting signature genes used to identify each cluster in (A). N = 2 pooled mouse ventricles in each group. DKO, inducible cardiomyocyte-specific ROCK1 and ROCK2 double knockout; EC, endothelial cells; EP, epicardial cells; LYPH, lymphocytes; MAC, macrophages/monocytes; ROCK, Rho-associated coiled-coil containing kinase; SM, smooth muscle cells; snRNA-seq, single-nucleus RNA sequencing; UMAP, uniform manifold approximation and projection; UNDEF, undefined cluster.
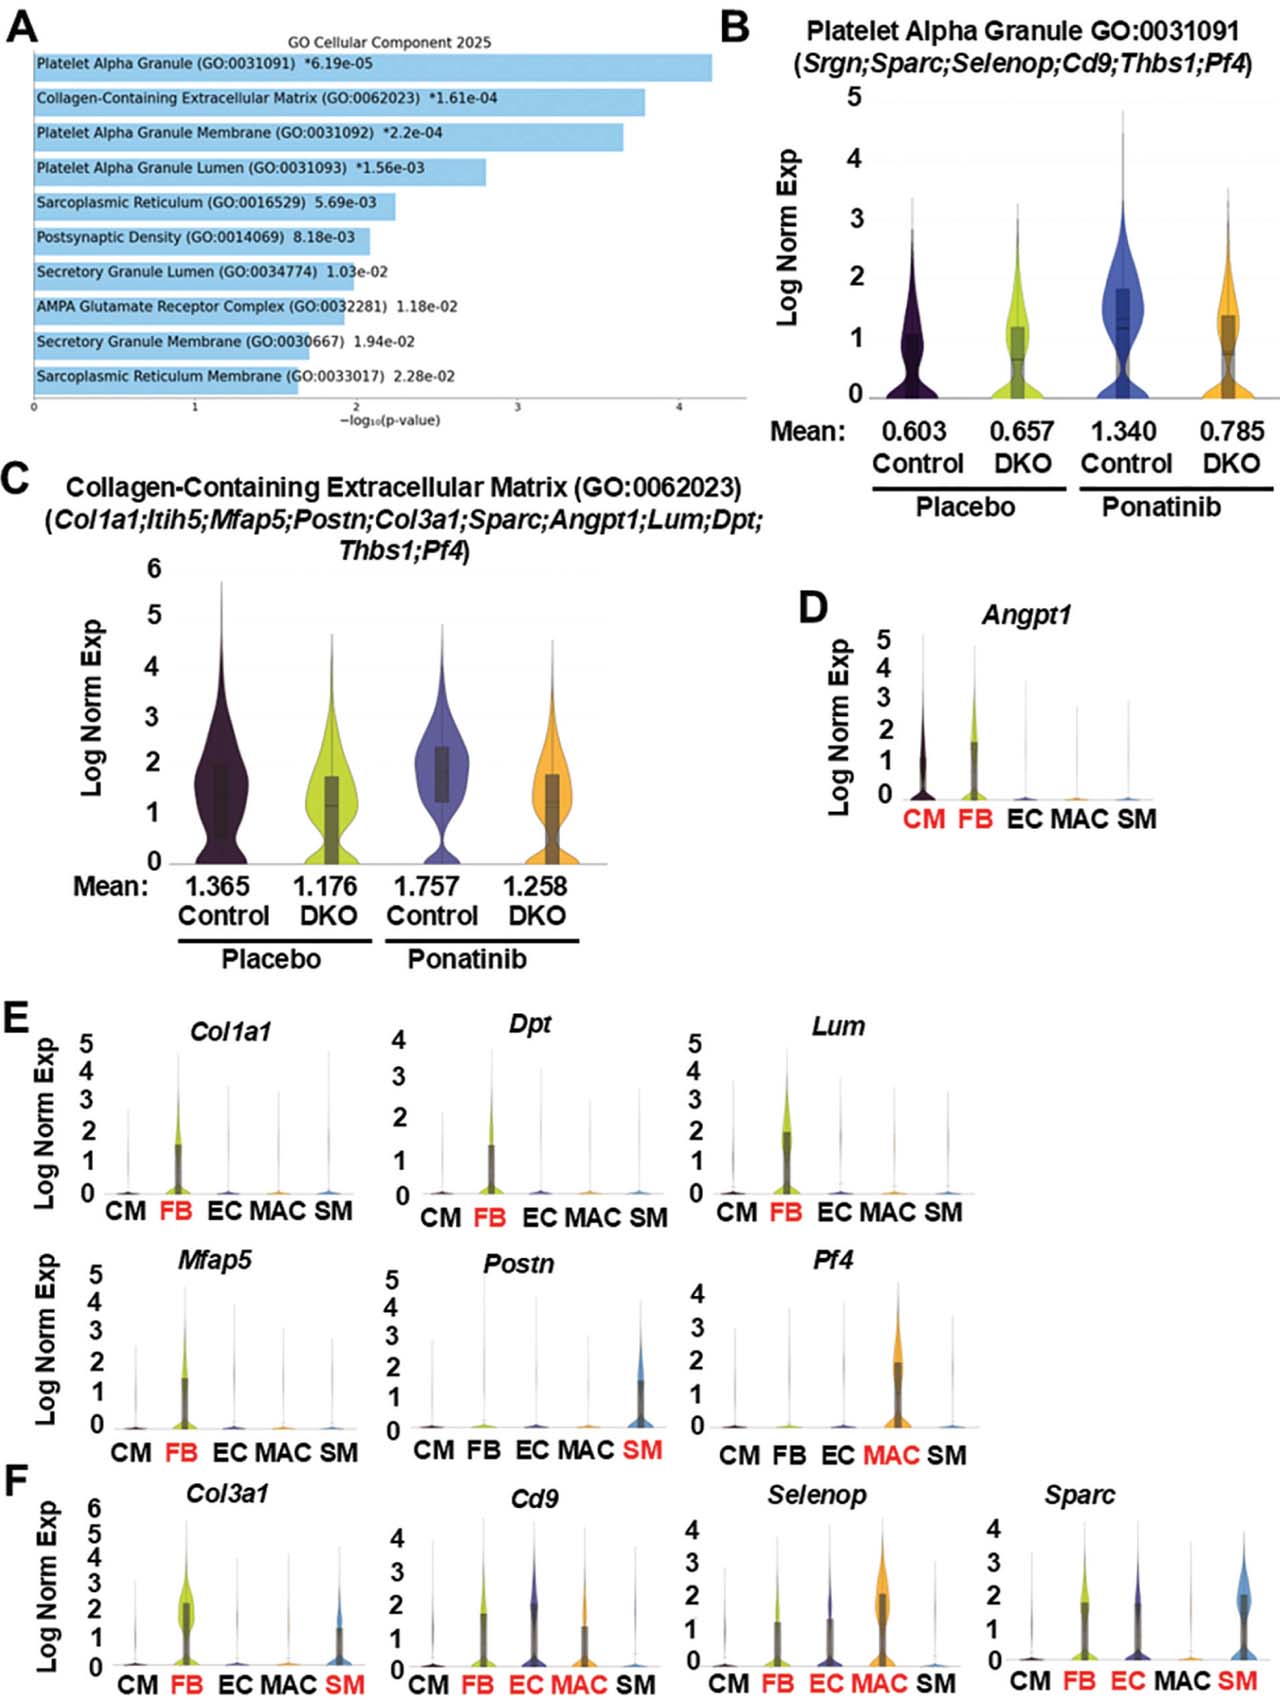
Fig 4.
Reduced extracellular matrix and blood coagulation-related gene expressions in ponatinib-treated DKO cardiomyocyte clusters. (A) Top 10 enriched terms (p-values are listed in Supplementary Table S4) by GO Cellular Component analysis of 151 DEGs generated by Loupe Browser (p < 0.05; p-values are adjusted using the Benjamini–Hochberg correction for multiple test; p-values are listed in Supplementary Table S1) that were downregulated in the cardiomyocyte cluster of DKO-ponatinib vs. control-ponatinib groups. GO enrichment analyses were conducted using FET with false discovery rate control by the Benjamini-Hochberg method (p-values are listed in Supplementary Table S4). (B,C) Violin plots visualizing the distribution of gene expression levels of two enriched terms with global significance in four groups of cardiomyocyte clusters. (D–F) Violin plots showing, among five major cell types, the distribution of the DEGs identified by pathway analyses. Although these DEGs were identified in cardiomyocytes by pathway analyses, few were enriched in cardiomyocytes (CM) (D), some were enriched in fibroblasts (FB), SM, or macrophage (MAC) (E), some were enriched in multiple cell types (F). DEGs, differentially expressed genes; DKO, inducible cardiomyocyte-specific ROCK1 and ROCK2 double knockout; EC, endothelial cells; FET, fisher exact test; GO, gene ontology; ROCK, Rho-associated coiled-coil containing kinase; SM, smooth muscle cell.
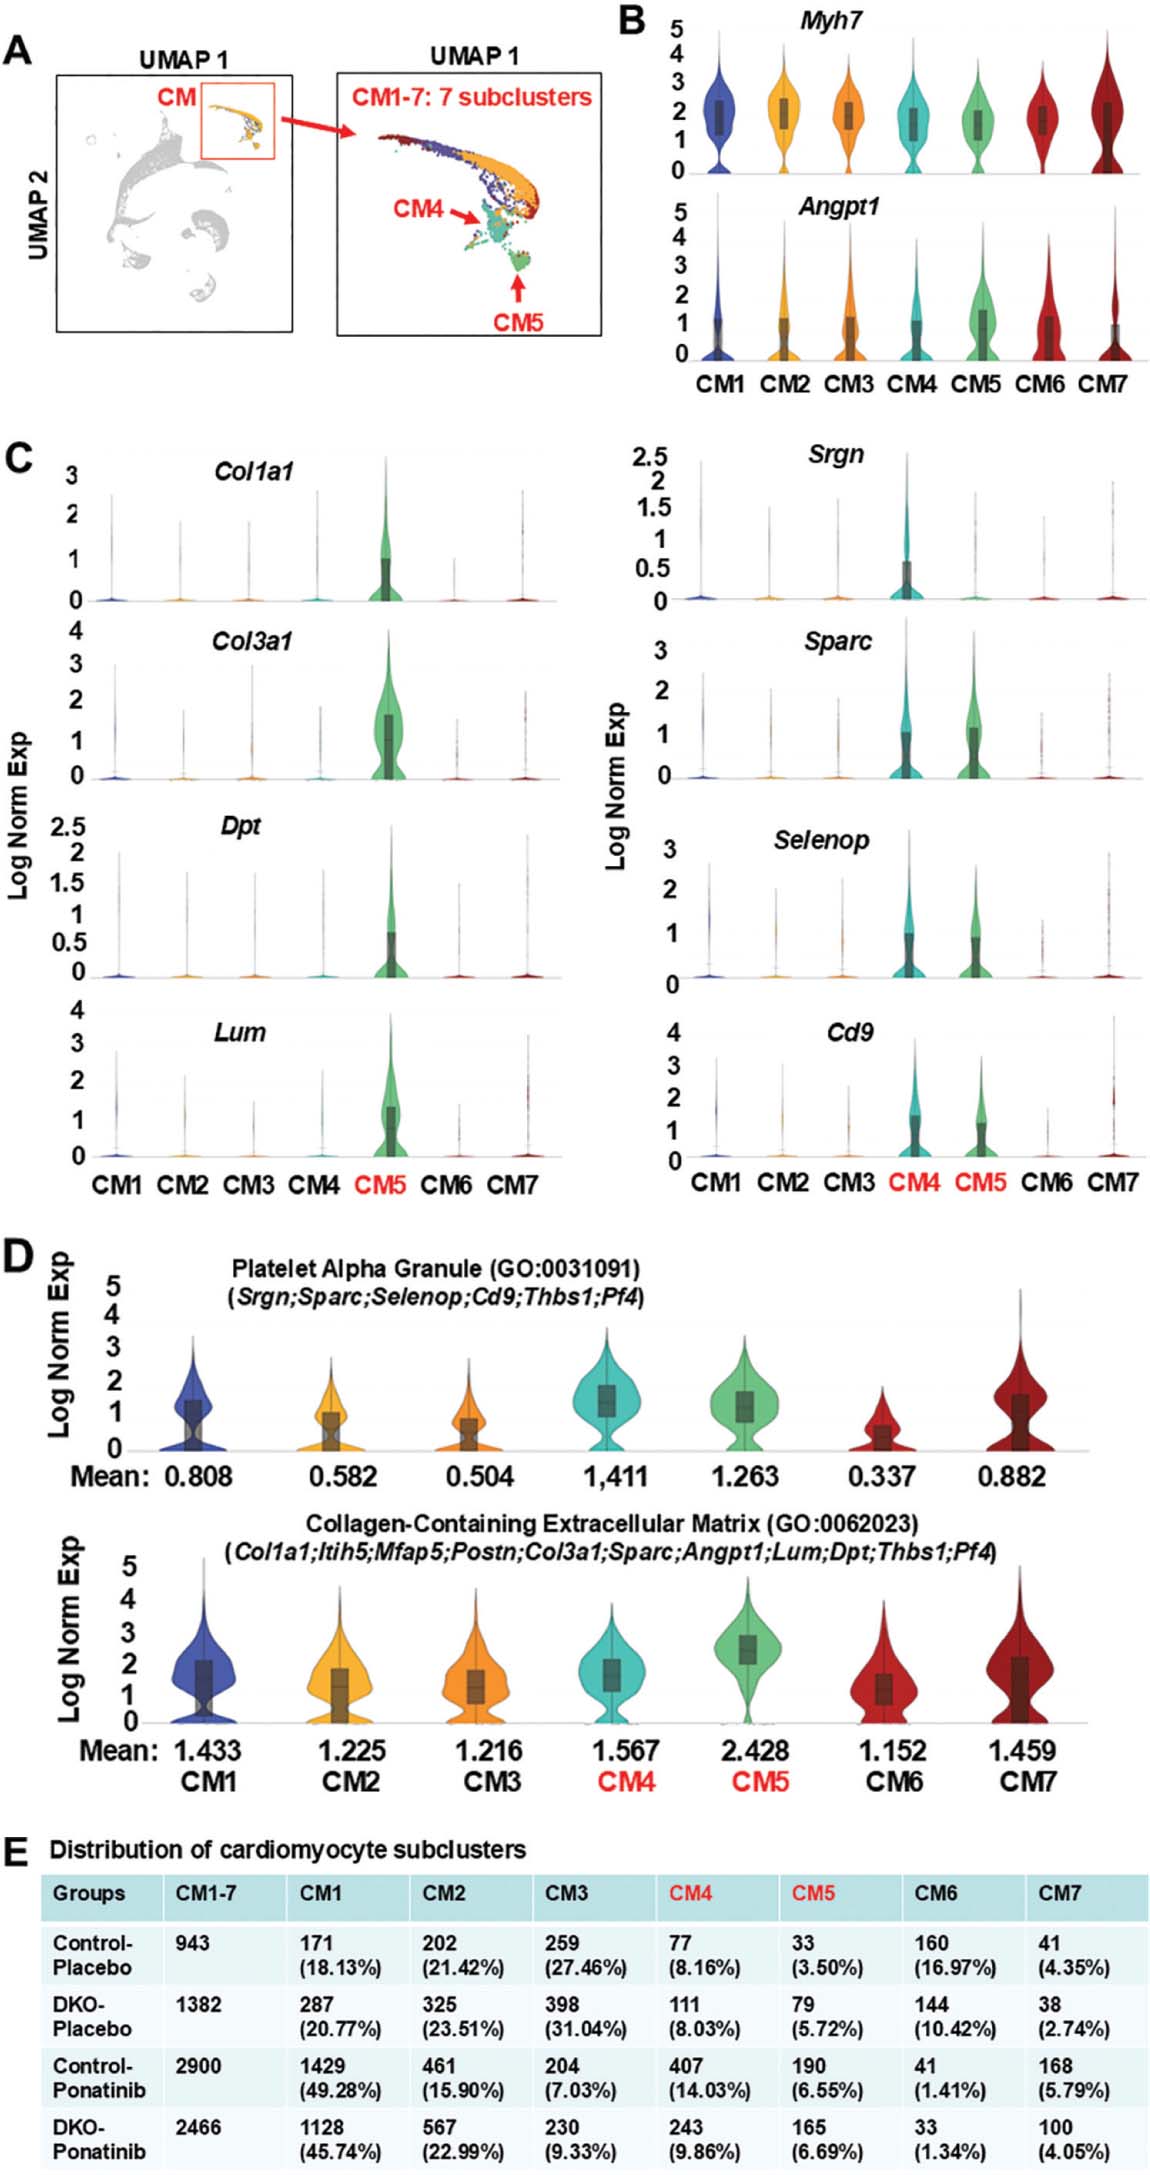
Fig 5.
Enrichment of ponatinib-induced extracellular matrix and blood coagulation related gene expressions in individual cardiomyocyte sub-clusters. (A) UMAP highlighting the cardiomyocyte cluster from the aggregation of 4 samples containing 7 distinct subclusters. (B, C) Violin plots showing, among 7 subclusters, the distribution of downregulated DEGs identified by pathway analyses of cardiomyocyte clusters from DKO-ponatinib group. cardiomyocyte enriched DEGs (Angpt1) and cardiomyocyte marker Myh7 were presented across all 7 subclusters (B). CM5 expressed the highest levels of fibroblast-related DEGs (e.g. Col1a1, Col3a1, Dpt, Lum), both CM4 and CM5 expressed the highest levels of endothelial cell- and macrophage-related DEGs (e.g. Srgn, Sparc, Selenop, Cd9) (C). (D) Violin plots visualizing the distribution of gene expression levels of two enriched GO terms (illustrated in Figure 4b,c) among 7 subclusters and showing their remarkable enrichment in CM4 and CM5. (E) Relative nuclei distribution of seven subclusters in each of the four samples. The numbers and ratios of nuclei in each subcluster of each sample were listed. CM4 was reduced in the DKO-ponatinib vs. control-ponatinib groups. DEGs, differentially expressed genes; DKO, inducible cardiomyocyte-specific ROCK1 and ROCK2 double knockout; GO, gene ontology; ROCK, Rho-associated coiled-coil containing kinase; UMAP, uniform manifold approximation and projection.
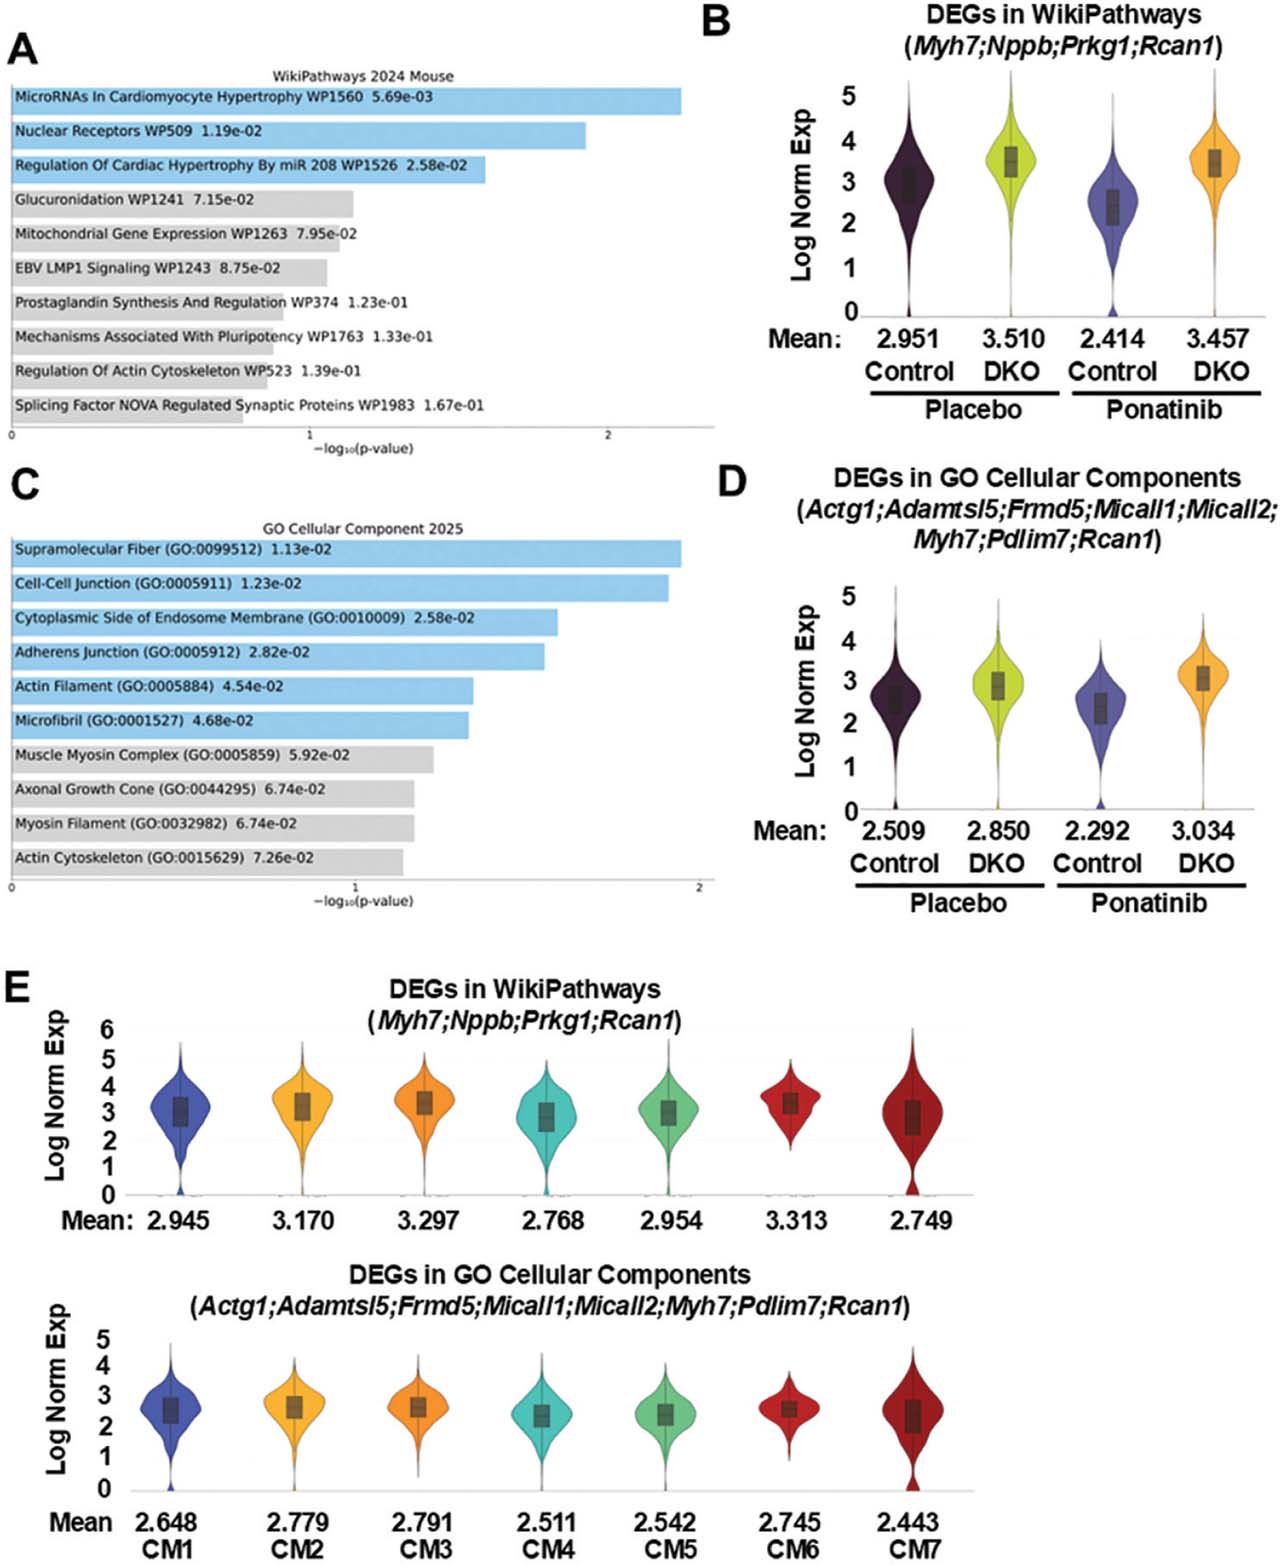
Fig 6.
Increased cardiomyocyte hypertrophy and cytoskeleton-related gene expression in ponatinib-treated DKO cardiomyocyte clusters. (A) Top 10 pathways by WikiPathways analysis of 87 DEGs were generated by Loupe Browser (p < 0.05; p-values are adjusted using the Benjamini–Hochberg correction for multiple test; p-values are listed in Supplementary Table S2) that were upregulated in the cardiomyocyte cluster of DKO-ponatinib vs. control-ponatinib groups. Pathway enrichment analyses were conducted using FET with false discovery rate control by the Benjamini-Hochberg method (p-values are listed in Supplementary Table S5). (B) Violin plots visualizing the distribution of DEGs related to cardiomyocyte hypertrophy in four groups of cardiomyocyte clusters. (C) Top 10 enriched terms (p-values are listed in Supplementary Table S6) by GO Cellular Component analysis of 87 upregulated DEGs (p < 0.05). (D) Violin plots visualizing the distribution of DEGs related to cardiomyocyte cytoskeleton in four groups of cardiomyocyte clusters. (E) Violin plots showing the distribution of DEGs related to cardiomyocyte hypertrophy and cytoskeleton among seven subclusters. DEGs, differentially expressed genes; DKO, inducible cardiomyocyte-specific ROCK1 and ROCK2 double knockout; GO, gene ontology; ROCK, Rho-associated coiled-coil containing kinase.
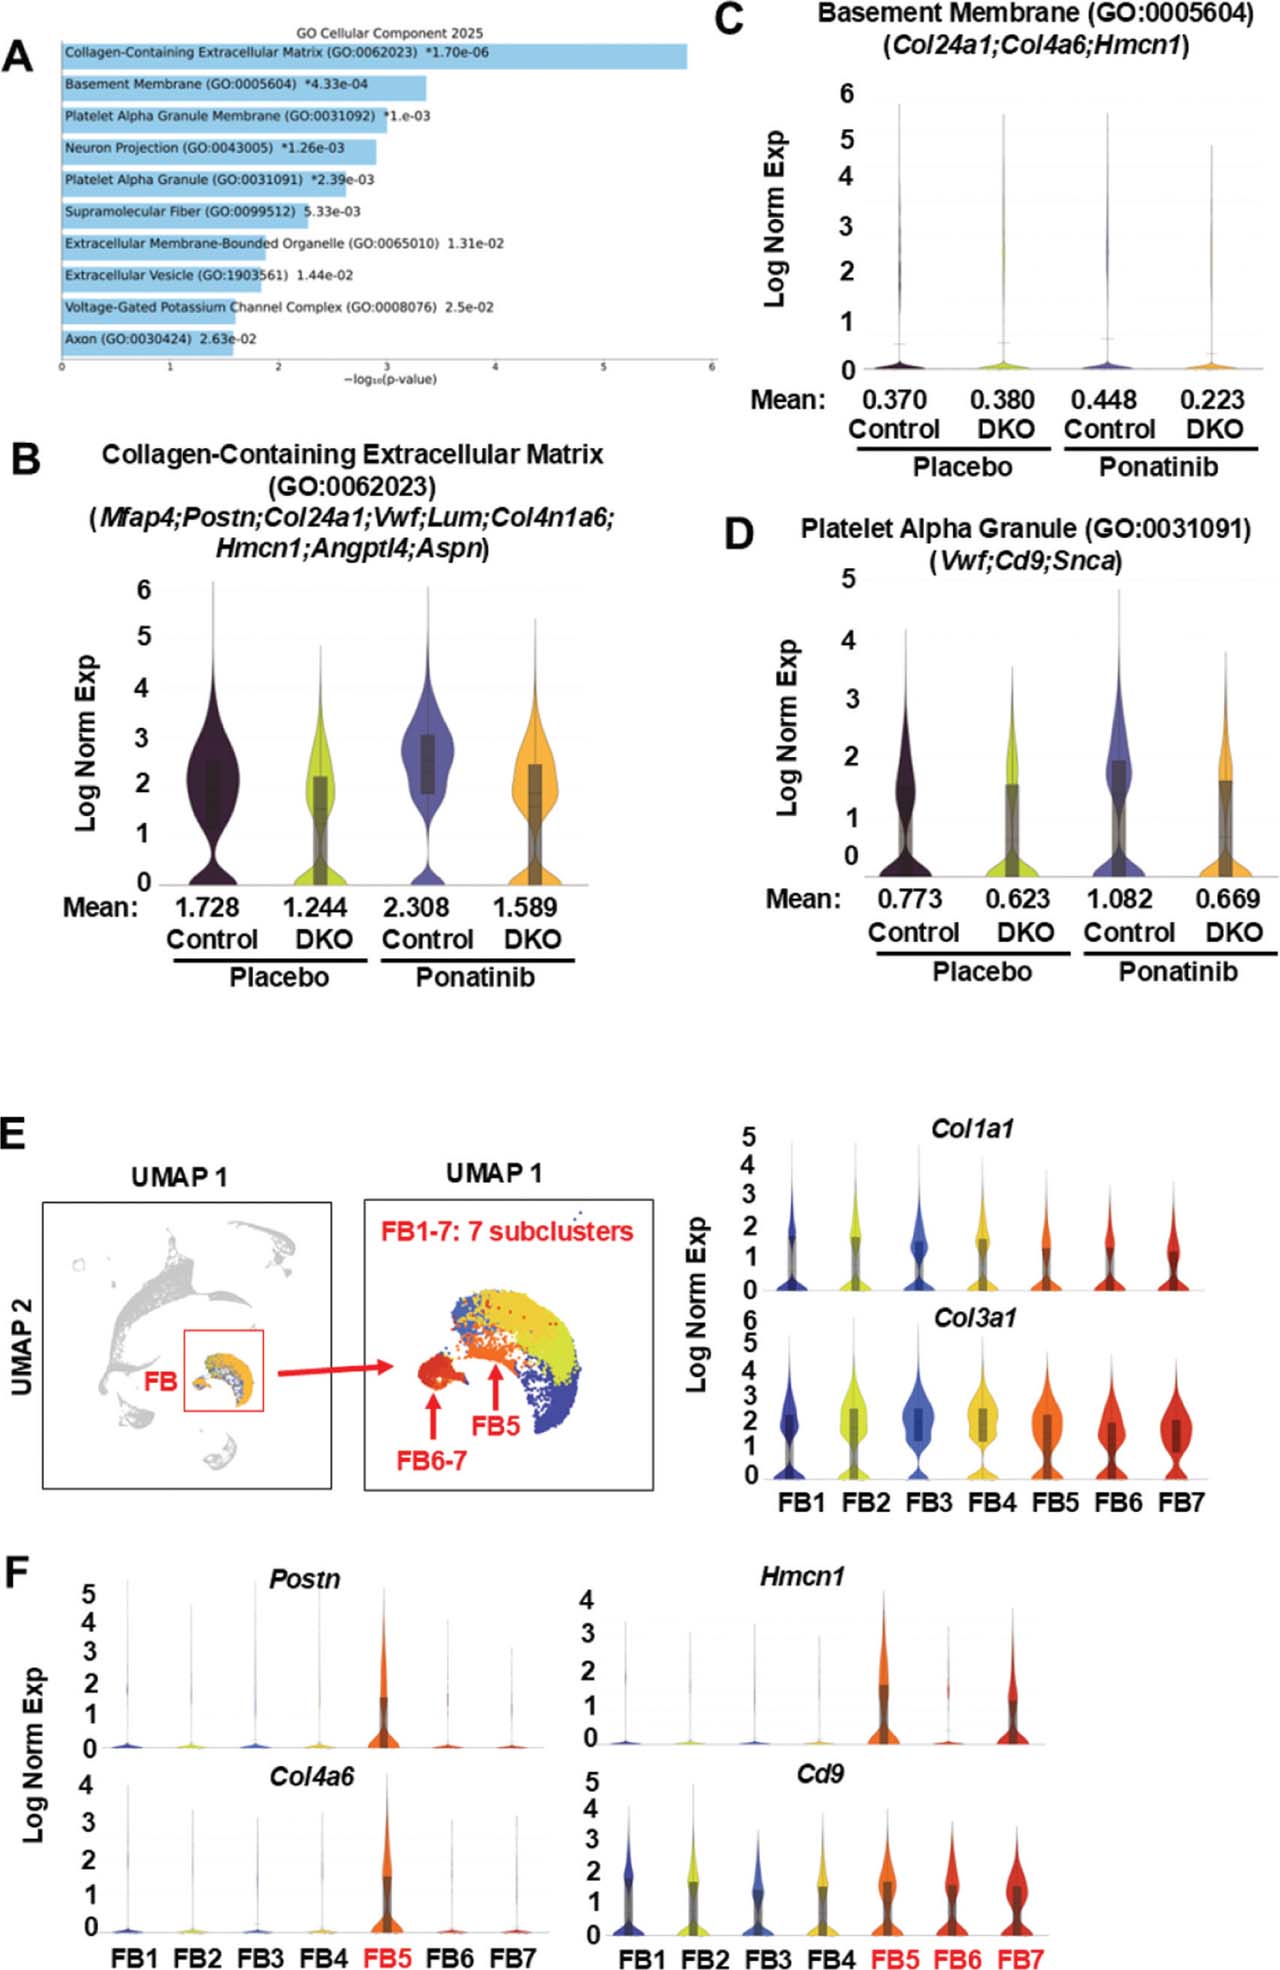
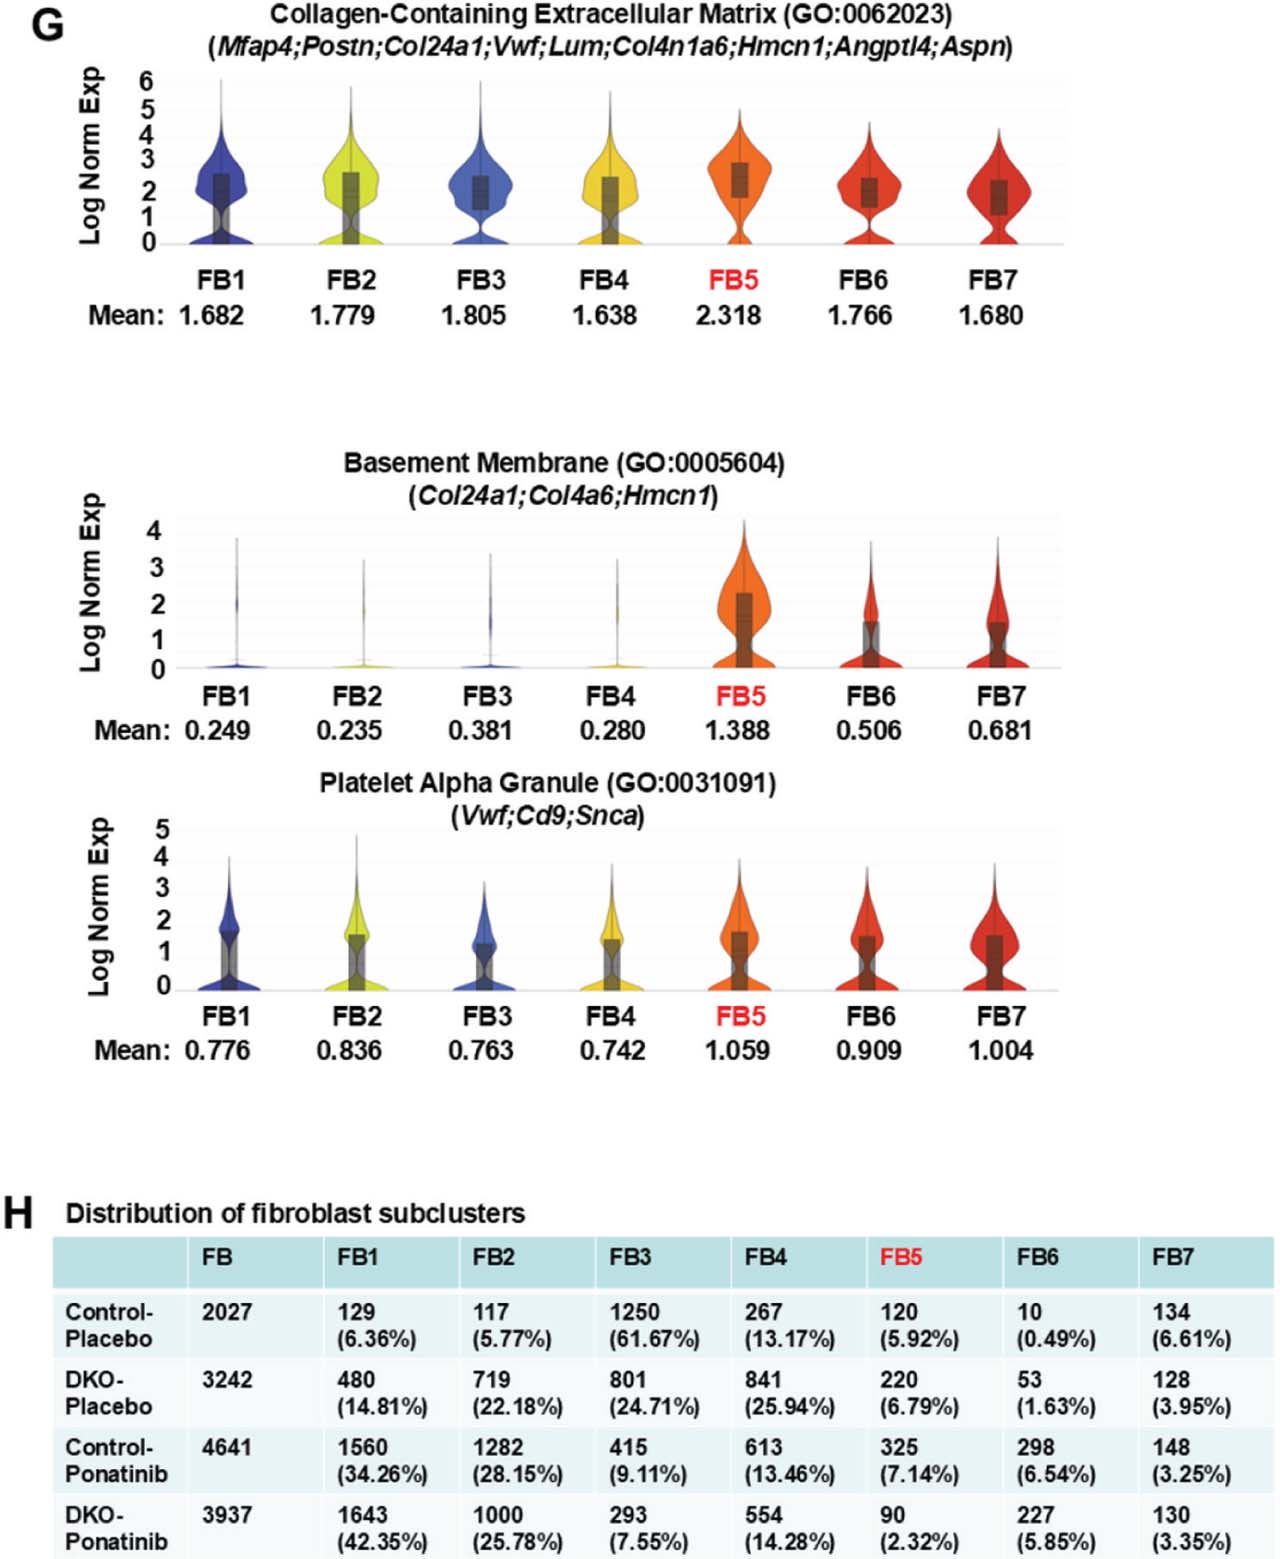
Fig 7.
Reduced extracellular matrix, basement membrane, blood coagulation and myofibroblast activation-related gene expressions in ponatinib-treated DKO fibroblast clusters. (A) Top 10 enriched terms by GO Cellular Component analysis of 59 DEGs generated by Loupe Browser (p < 0.05; p-values are adjusted using the Benjamini-Hochberg correction for multiple test; p-values are listed in Supplementary Table S7) that were downregulated in fibroblast clusters of DKO-ponatinib vs. control-ponatinib groups. GO Cellular Component analysis was conducted using FET with false discovery rate control by the Benjamini–Hochberg method (p-values are listed in Supplementary Table S10). (B–D) Violin plots visualizing the distribution of gene expression levels of three enriched terms with global significance in four groups of fibroblast clusters. (E) UMAP highlighting the fibroblast cluster from the aggregation of four samples containing seven distinct subclusters (numbered FB1-7). Fibroblast markers, Col1a1 and Col3a1, are expressed across all seven subclusters. (F) Violin plots showing, among seven subclusters, enrichment of Postn, a marker of myofibroblast, in FB5. In addition, some DEGs (e.g., Col4a6, Hmcn1, Cd9) were enriched in FB5, FB6, and FB7. (G) Violin plots visualizing the distribution of gene expression levels of three enriched GO terms among seven subclusters and showing their remarkable enrichment in FB5. (H) Relative nuclei distribution of seven subclusters in each sample. The numbers and ratios of nuclei in each subcluster of each sample were listed. FB5 was reduced in the DKO-ponatinib vs. control-ponatinib groups. DEGs, differentially expressed genes; DKO, inducible cardiomyocyte-specific ROCK1 and ROCK2 double knockout; FET, Fisher exact test; GO, gene ontology; ROCK, Rho-associated coiled-coil containing kinase; UMAP, uniform manifold approximation and projection.
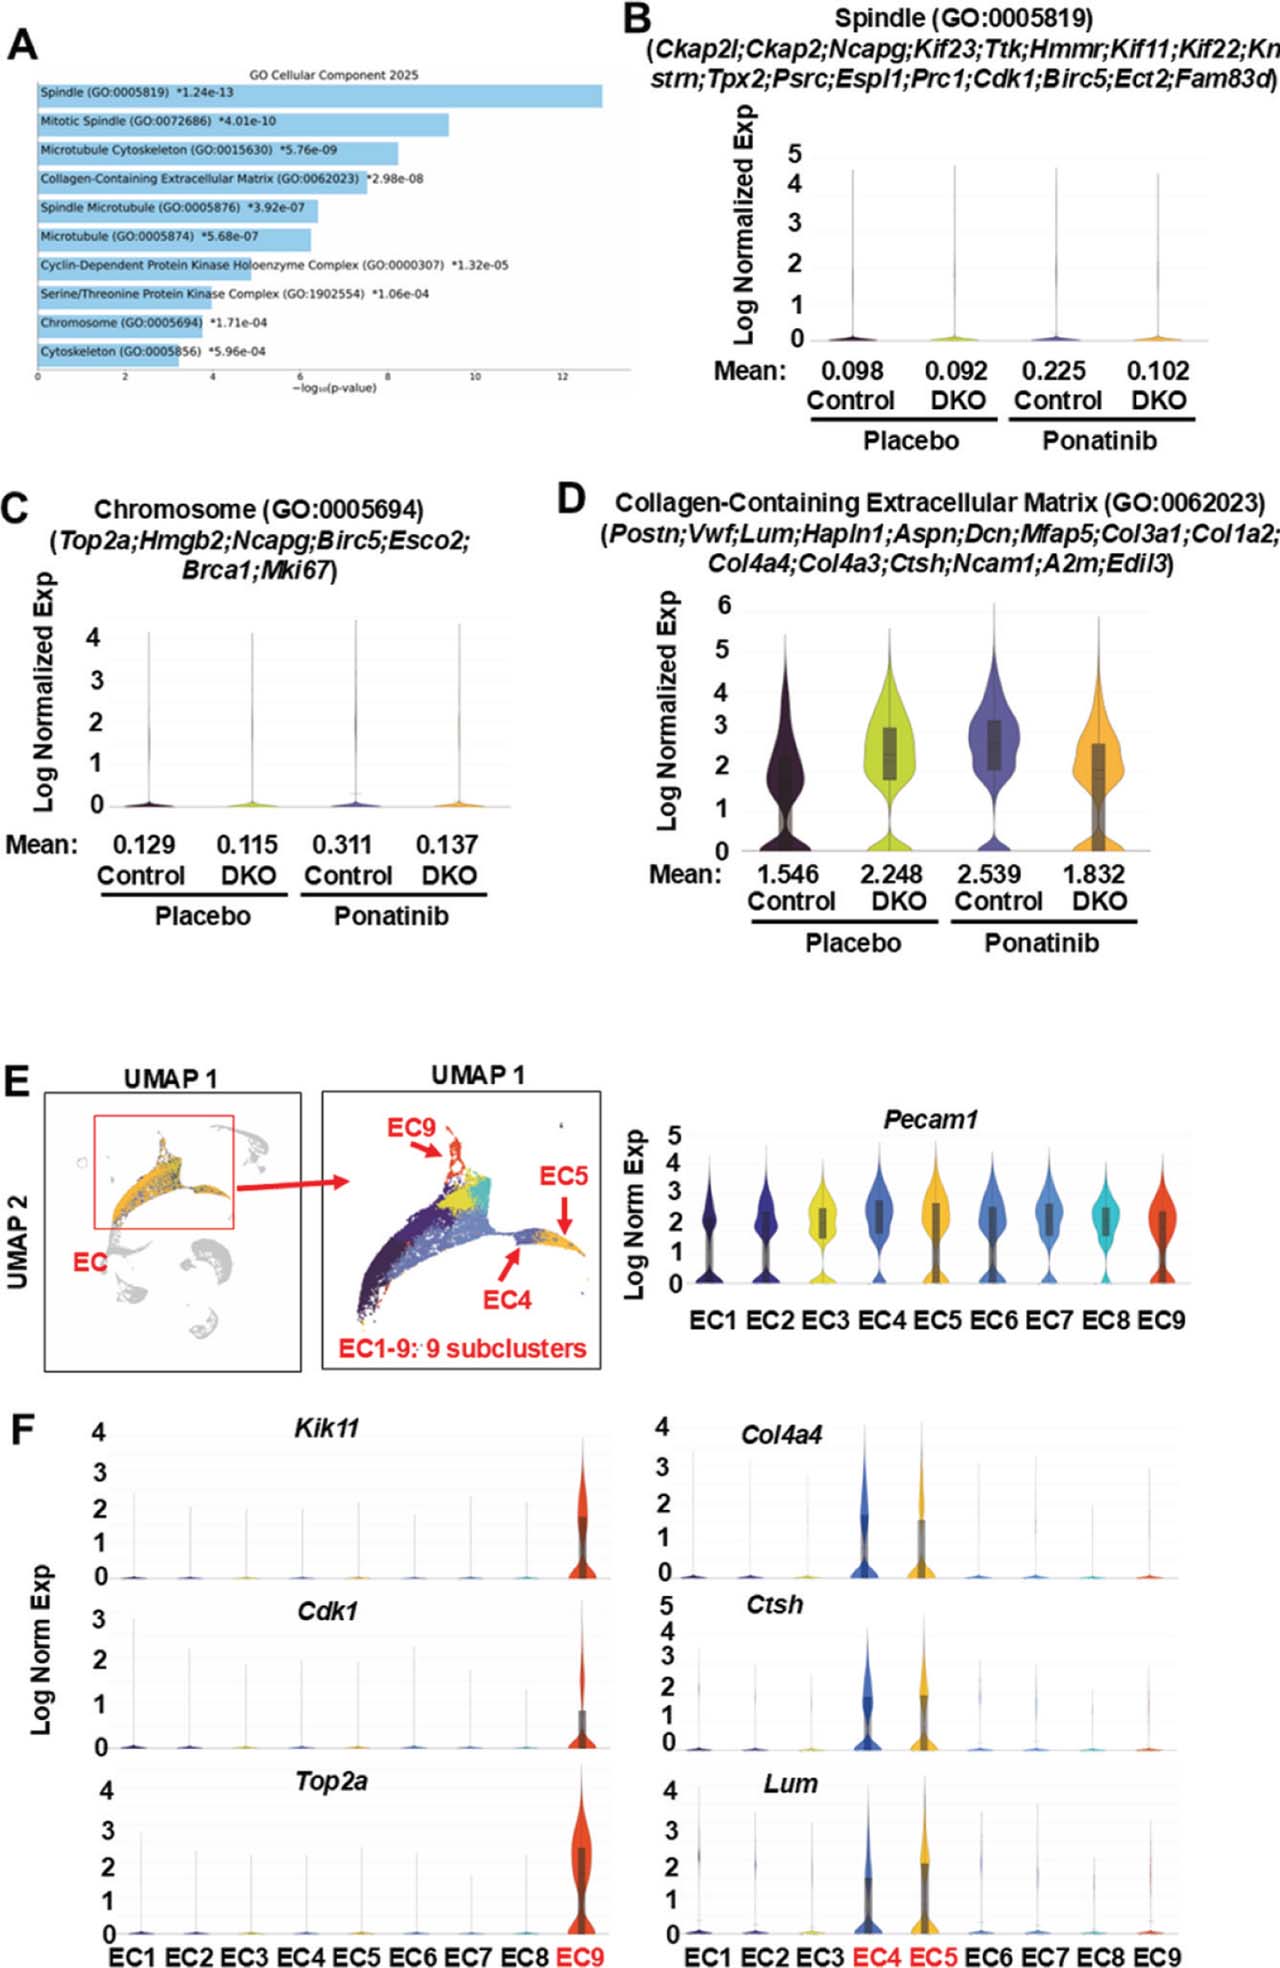
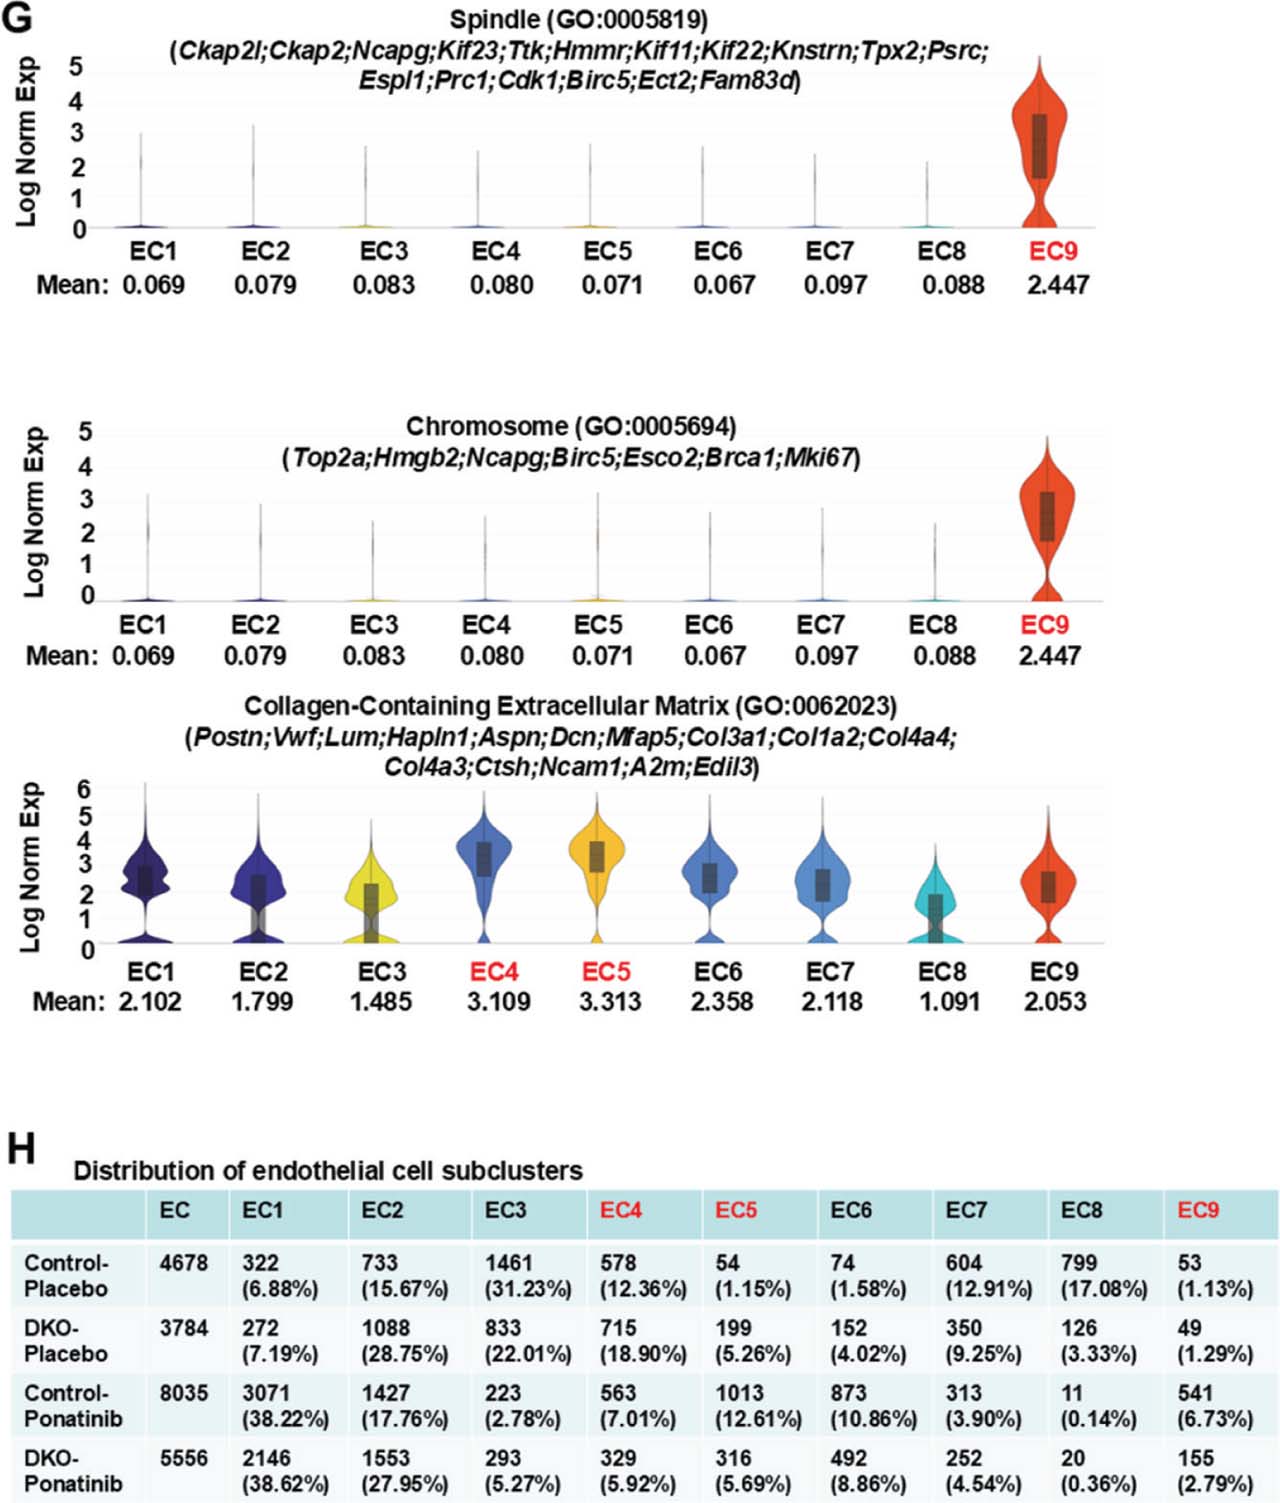
Fig 8.
Reduced extracellular matrix and cell proliferation related gene expression in ponatinib-treated DKO EC clusters. (A) Top 10 enriched terms by GO Cellular Component analysis of 130 DEGs generated by Loupe Browser (p < 0.05; p-values are adjusted using the Benjamini–Hochberg correction for multiple test; p-values are listed in Supplementary Table S13) that were downregulated in EC clusters of DKO-ponatinib vs.control-ponatinib groups. GO Cellular Component analysis was conducted using FET with false discovery rate control by the Benjamini-Hochberg method (p-values are listed in Supplementary Table S16). (B–D) Violin plots visualizing the distribution of gene expression levels of three enriched terms with global significance in four groups of EC clusters. (E) UMAP highlighting the EC cluster from the aggregation of four samples containing nine distinct subclusters (numbered EC1-9). Endothelial marker, Pecam1, expressed across all nine subclusters. (F) Violin plots showing enrichment of cell proliferation-related DEGs in EC9. Some DEGs related to extracellular matrix were enriched in two subclusters, EC4 and EC5. (G) Violin plots showing remarkable enrichment in EC9 for cell proliferation related components and in EC4 and EC5 for extracellular matrix related components. (H) Relative nuclei distribution of nine subclusters in each sample. The numbers and ratios of nuclei in each subcluster of each sample were listed. The relative nuclei distributions of EC4, EC5, and EC9 were all reduced in the DKO-ponatinib vs. control-ponatinib groups. DEGs, differentially expressed genes; DKO, inducible cardiomyocyte-specific ROCK1 and ROCK2 double knockout; EC, endothelial cells; FET, Fisher exact test; GO, gene ontology; ROCK, Rho-associated coiled-coil containing kinase; UMAP, uniform manifold approximation and projection.
Supplementary Fig. 1.
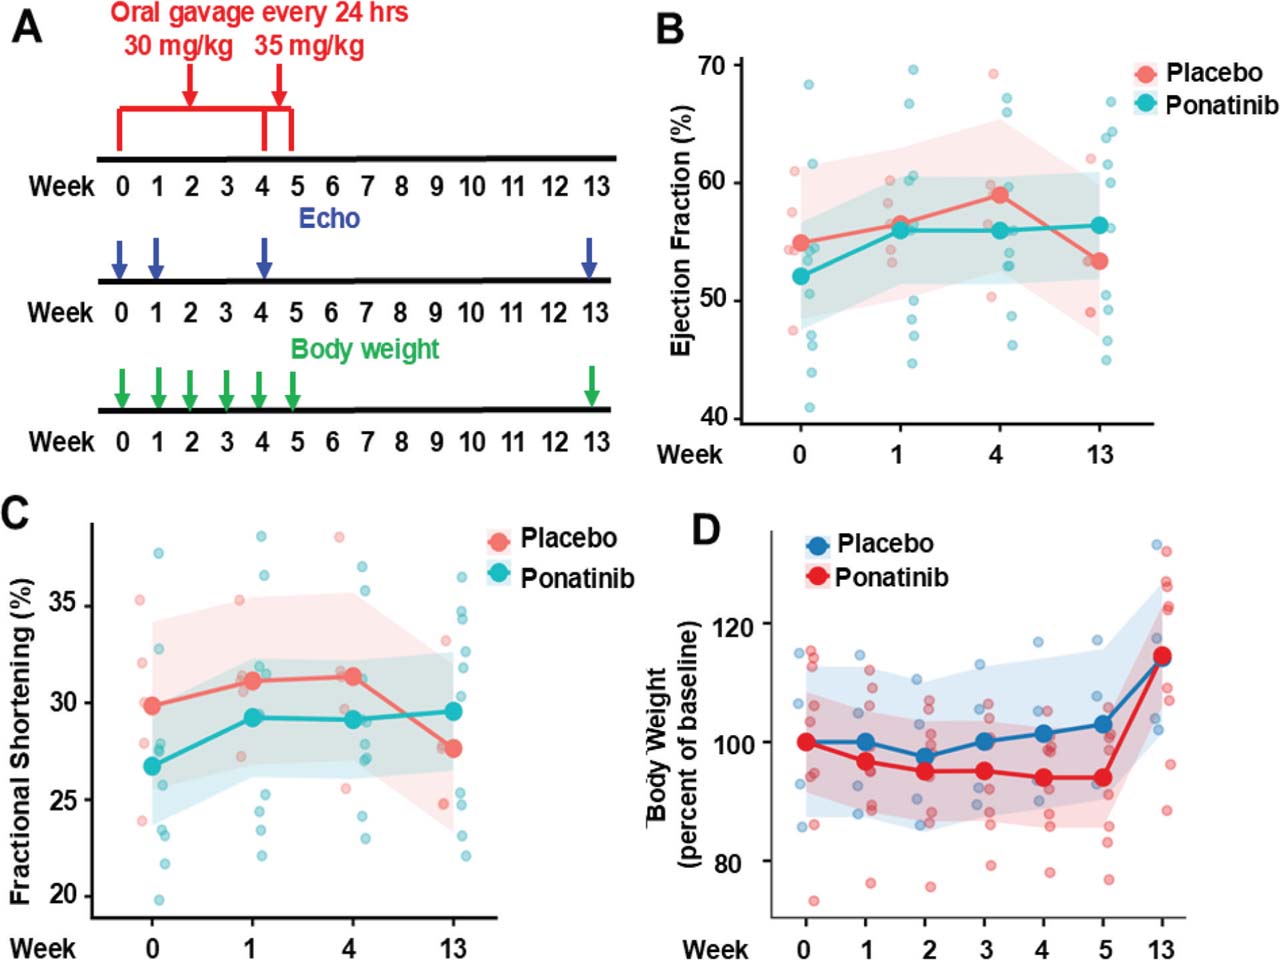
Ponatinib-induced CTX on lower dose and longtime course. (A) An experimental scheme involving 6–8-month-old male C57BL/6J mice subjected to ponatinib treatment at 30 mg/kg/day for 4 weeks and at 35 mg/kg/day for an additional week. The general drug toxicity was monitored by body weight decline, and cardiac function was monitored by echocardiography (Echo) at indicated time points. (B,C) Measurement of EF and FS at indicated timepoints; the endpoint was at 8 weeks post-treatment. No statistically significant difference was observed in the placebo-treated (received equal volume of DMSO in normal saline) and ponatinib-treated group, p = 0.469 (EF) and p = 0.482 (FS). (D) A trend but not statistically significant reductions in body weight were observed in the ponatinib-treated vs.placebo-treated group during first 4 weeks of treatment at 30 mg/kg/day. After an additional 1 week of treatment was added at 35 mg/kg/day, mouse body weight showed a further decline, but still not significant. The body weight was recovered 8 weeks after stopping treatment. For statistical analysis, two-way repeated-measures ANOVA was used to assess group differences over time for (b–d). N = 8 mice in each group. EF, ejection fraction; FS, fractional shortening.
Supplementary Fig. 2.
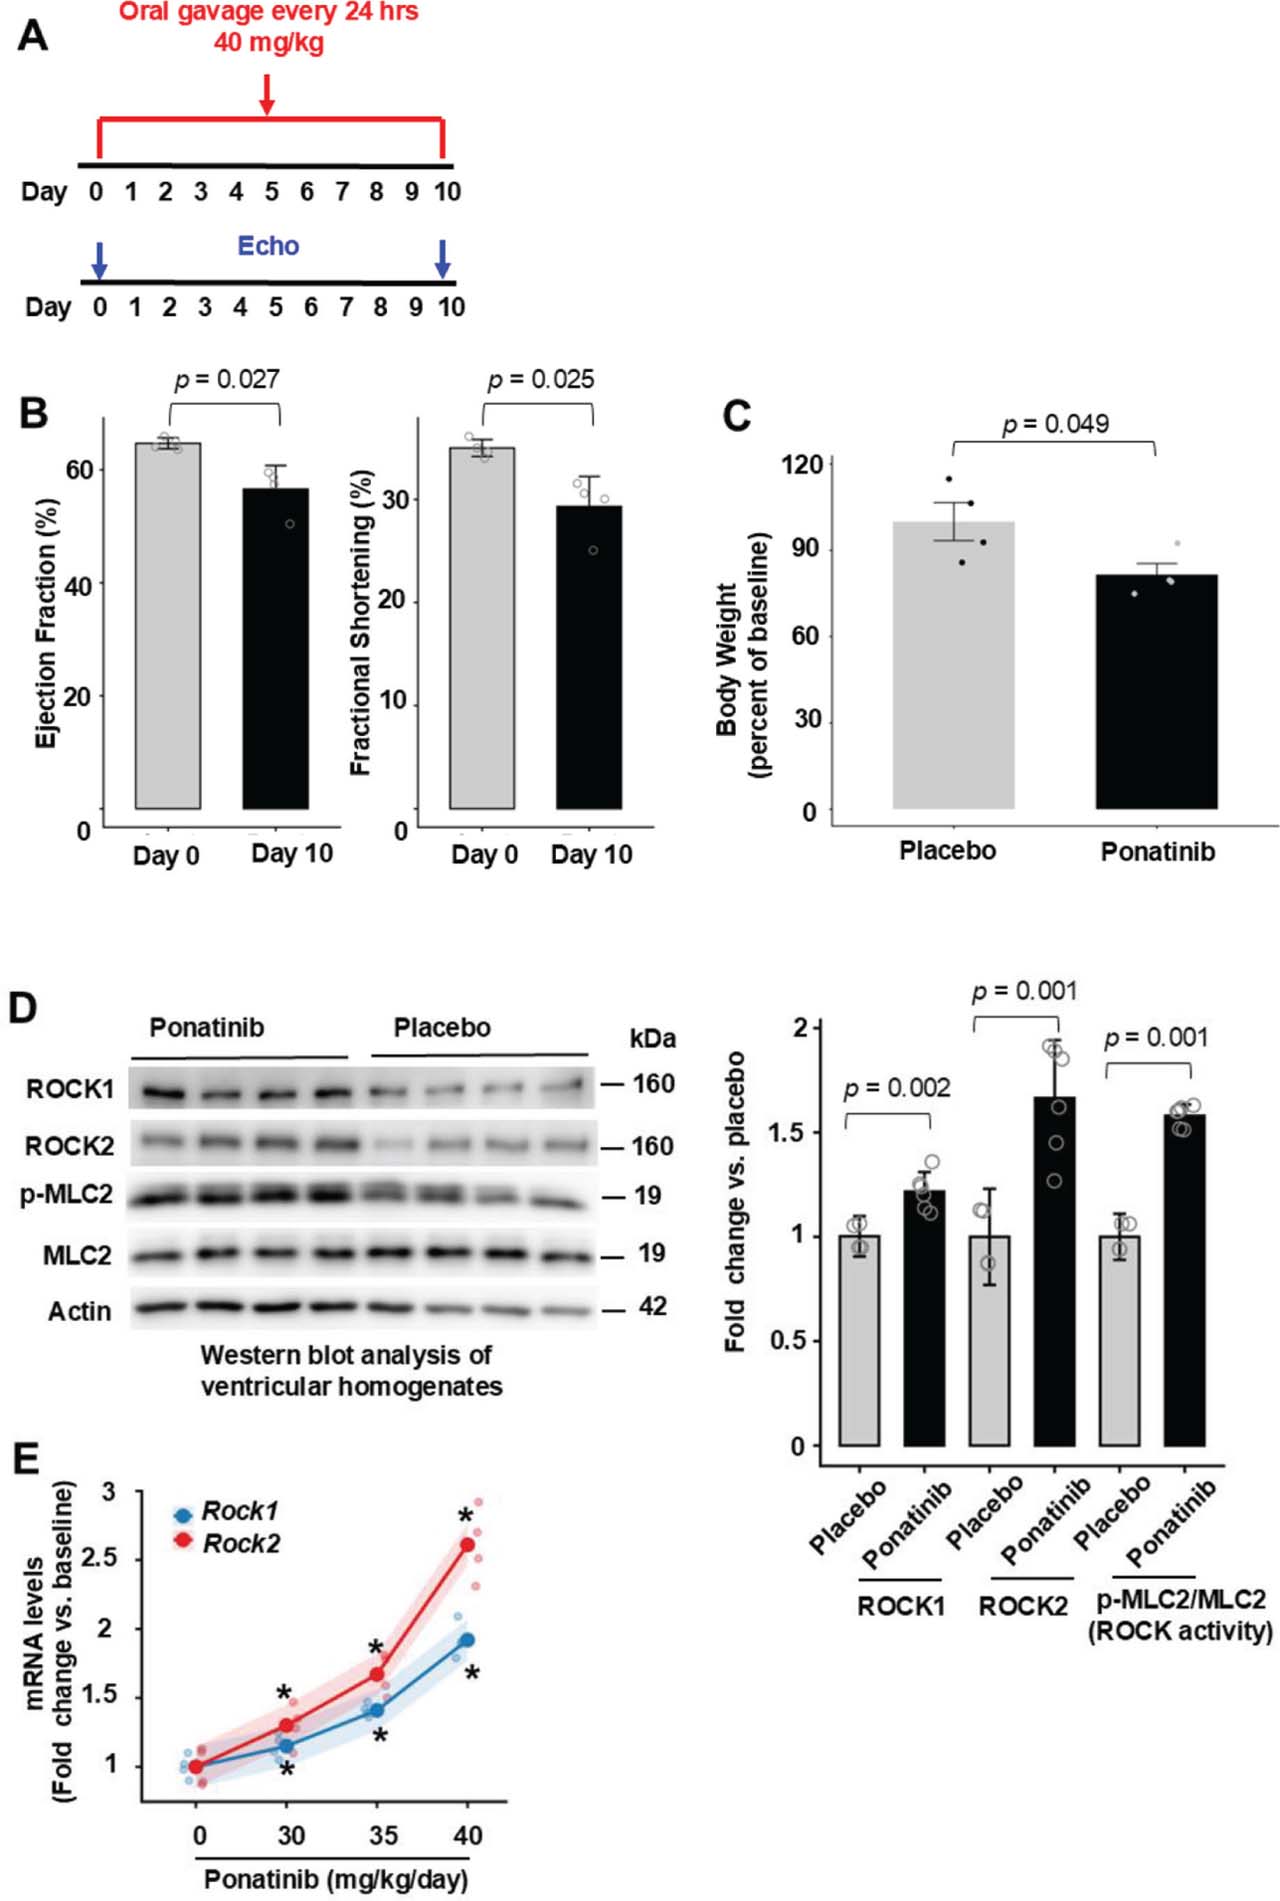
Ponatinib-induced CTX on higher dose and short time course. (A) The difference from the previous pilot study was at the dose of 40 mg/kg/day and the treatment length was 10 days. The general drug toxicity was monitored as in previous pilot study. (B) EF and FS were significantly different on day 10 of the treatment compared with the baseline. N = 8 mice in each group. (C) Ponatinib significantly reduced body weight after 10 days of treatment by about 18% indicating general drug toxicity. N = 8 mice in each group. (D) Representative image (left) of Western blot analysis in the ventricular homogenates from placebo or ponatinib-treated mice on day 10. Quantitative analysis (right) of immunoreactive bands of ROCK1, ROCK2, p-MLC2, MLC. N = 4–6 mice in each group. (E) Dose-dependent mRNA expression of ROCKs. The study mice subjected to increasing doses of drug treatment for 7 days. The mRNA expression of ROCKs was normalized with GAPDH. Data are shown as model-estimated marginal means ± 95% confidence intervals. Rock1 mRNA increased from baseline to the highest dose: baseline: 1.00 [0.85–1.15]; dose 40 mg/day/kg: 1.92 [1.77–2.07], with statistically significant increases observed from dose 30 mg/kg/day (p ≤6.84e−04) to 40 mg/kg/day (p ≤1.37e−08). Rock2 mRNA expression exhibited a steeper dose–response: baseline: 1.00 [0.85–1.15]; dose 30 mg/kg/day: 1.30 [1.15–1.45] and reaching 2.61 [2.46–2.76] at 40 mg/kg/day, with statistically significant increases observed from dose 30 mg/kg/day (p ≤1.58e−06) to 40 mg/kg/day (p ≤1.20e−12). The changes in Rock2 mRNA levels (defined as fold change vs.baseline) exceeded those of Rock1 at dose 35 mg/kg/day (Δ = 0.26, p = 0.020) and dose 40 mg/kg/day (Δ = 0.69, p = 2.0e−06), indicating greater sensitivity of Rock2 to increasing drug dosage. N = 4–6 mice in each group. For statistical analysis, p-values were calculated using an unpaired two-tailed Student’s t-test for (B–D), and p-values were calculated using two-way repeated-measures ANOVA followed by post hoc multiple-comparison testing for (E). EF, ejection fraction; FS, fractional shortening; ROCKs, Rho-associated coiled-coil containing kinase.
Supplementary Fig. 3.
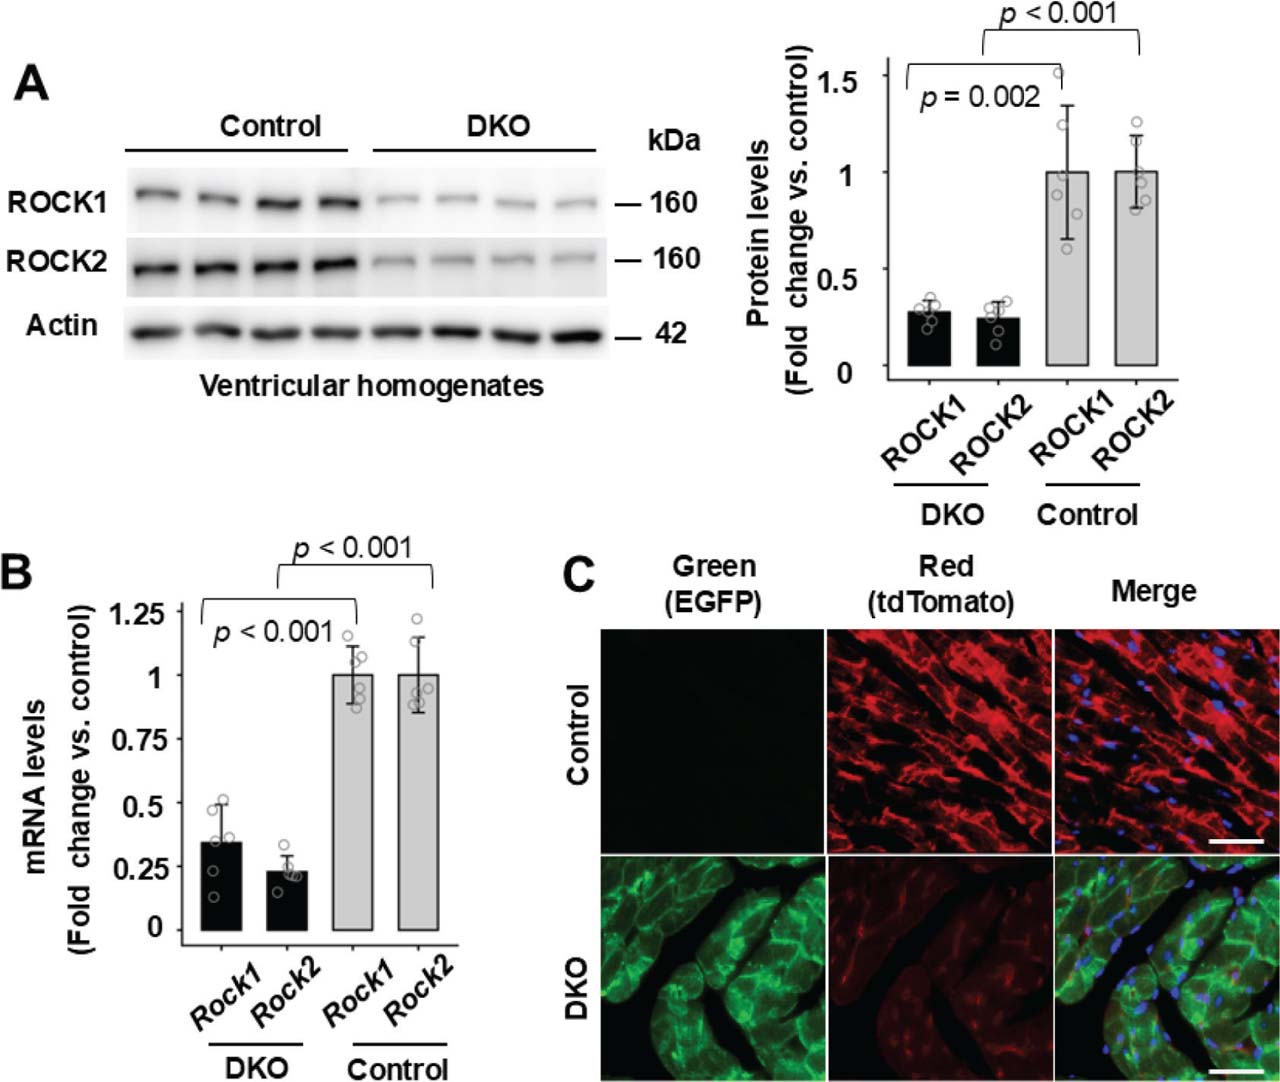
Reduced ROCK1 and ROCK2 expressions in DKO mouse hearts. (A) and (B), Western blot analysis (A) and real-time quantitative RT-PCR analysis (B) of ROCK1 and ROCK2 expressions in ventricular lysates of 6–8-month-old male DKO and control mice subjected to ponatinib treatment for 4 weeks. Rock1 and Rock2 mRNA levels were normalized with actin for quantitation (B). (C) Representative fluorescent images of control and DKO heart sections showing red (tdTomato), green (EGFP) and blue (DAPI) fluorescence. Bar, 100 mm. The procedure was through imaging freshly cut heart cryosections on fluorescence microscope. Consistent with the expected absence of EGFP protein expression in the control group, fluorescent imaging detected only tdTomato red signal in the control-ponatinib heart sections (upper panel) while DKO-ponatinib heart sections showed EGFP green signal in cardiomyocyte and tdTomato red signal in non-cardiomyocyte cells (lower panel). For statistical analysis, p-values were calculated using an unpaired two-tailed Student’s t-test for (A) and (B). N = 4–6 mice in each group. DKO, inducible cardiomyocyte-specific ROCK1 and ROCK2 double knockout; ROCKs, Rho-associated coiled-coil containing kinase; RT-PCR, reverse transcription polymerase chain reaction.
Supplementary Fig. 4.
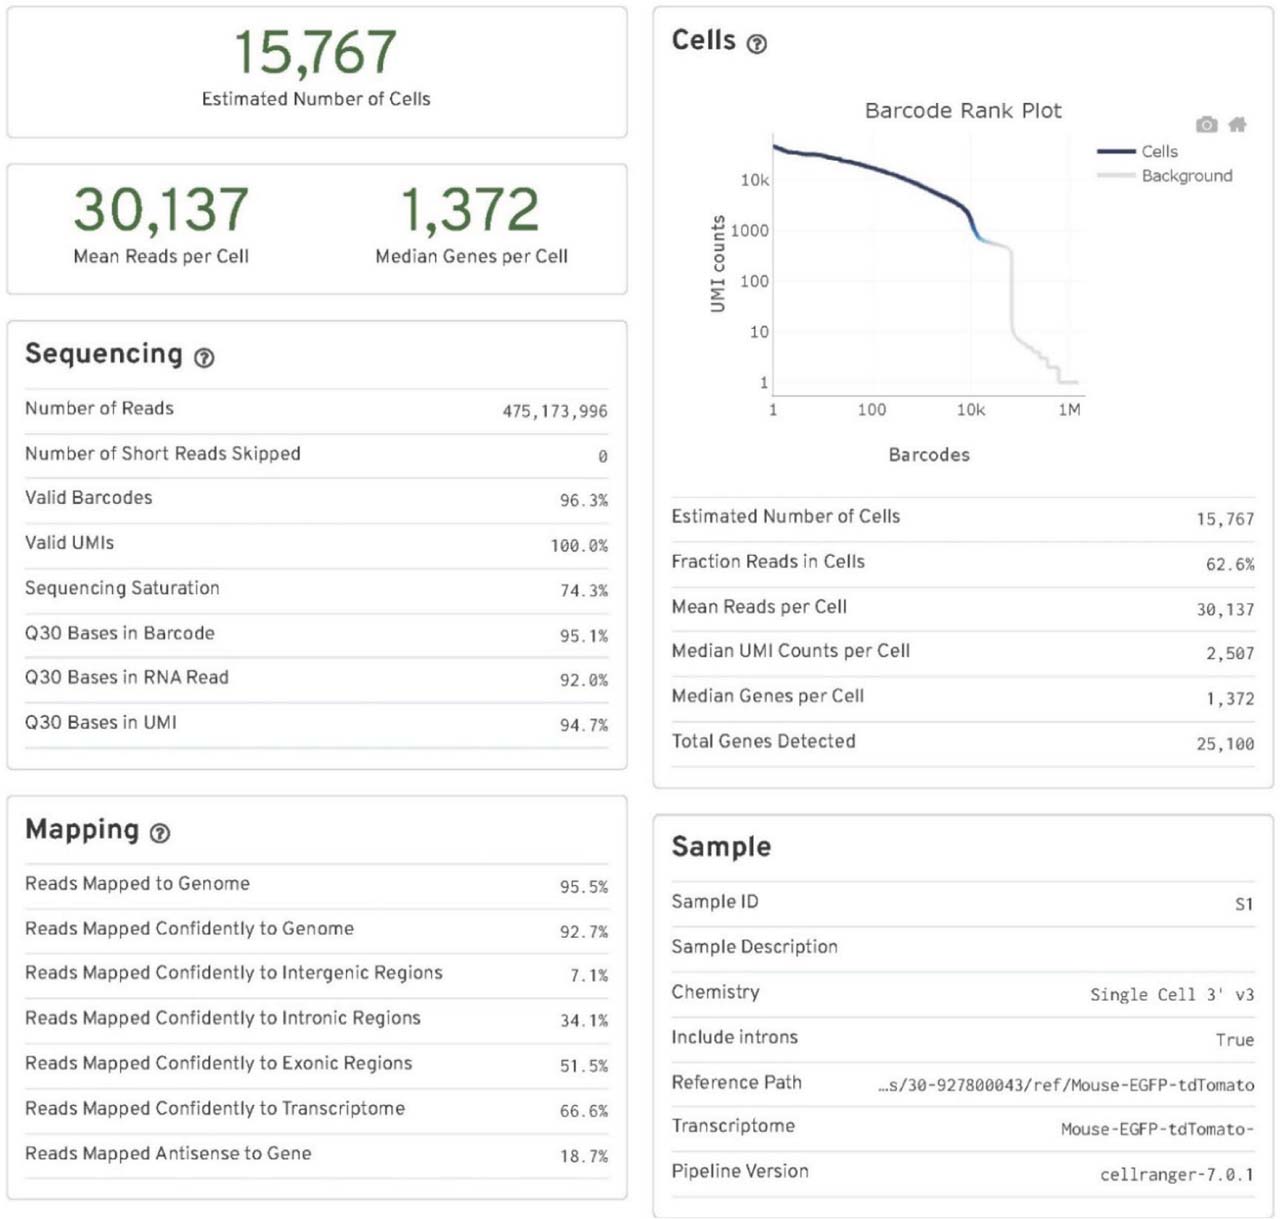
Cell Ranger output quality control file for the control-placebo group. Key quality control parameters include the number of cells (nuclei) sequenced, mean reads per cell (nucleus), median genes per cell (nucleus), sequencing saturation, fraction reads in cells (nuclei), and reads mapped confidently to the modified Mouse-EGFP-tdTomato genome. N = 2 pooled mouse ventricles.
Supplementary Fig. 5.
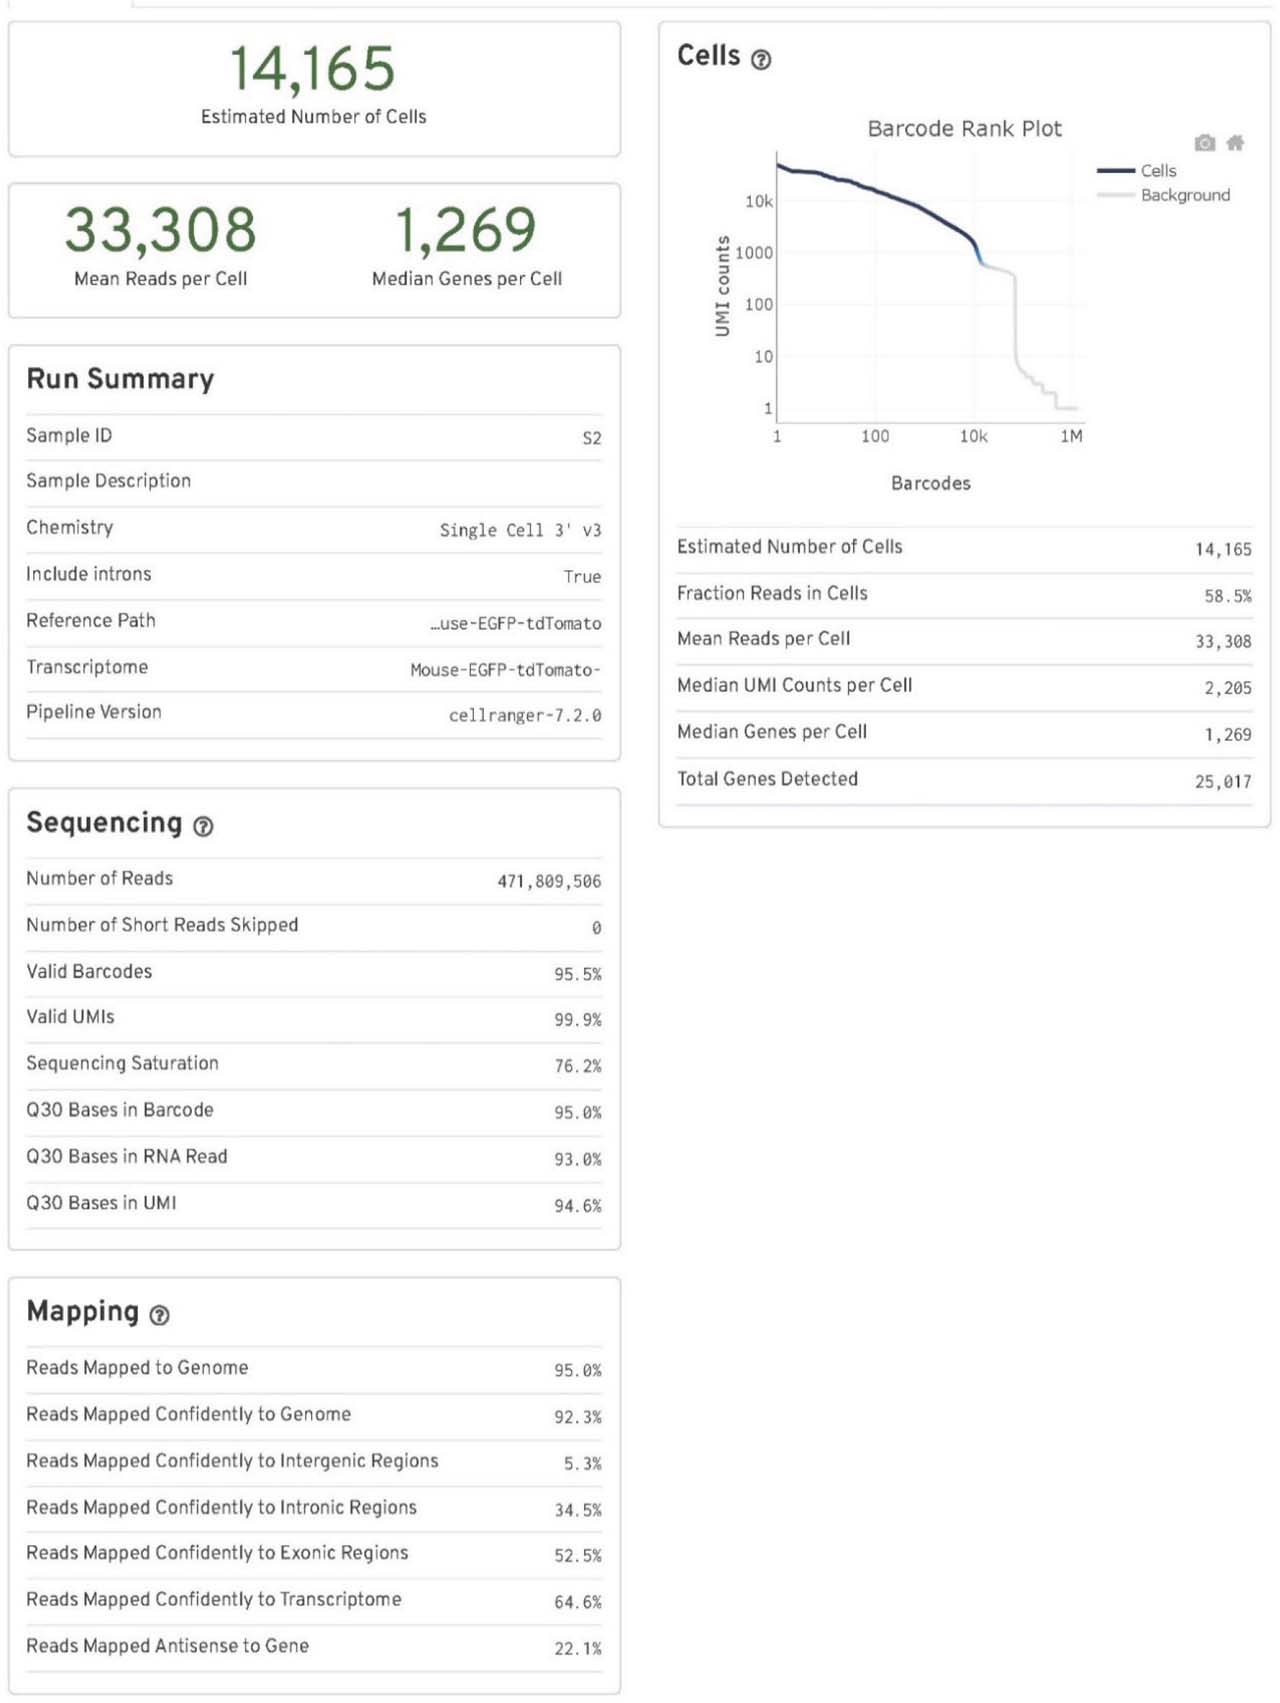
Cell Ranger output quality control file for the DKO-placebo group. Key quality control parameters include the number of cells (nuclei) sequenced, mean reads per cell (nucleus), median genes per cell (nucleus), sequencing saturation, fraction reads in cells (nuclei), and reads mapped confidently to the modified Mouse-EGFP-tdTomato genome. N = 2 pooled mouse ventricles. DKO, inducible cardiomyocyte-specific ROCK1 and ROCK2 double knockout; ROCKs, Rho-associated coiled-coil containing kinase.
Supplementary Fig. 6.
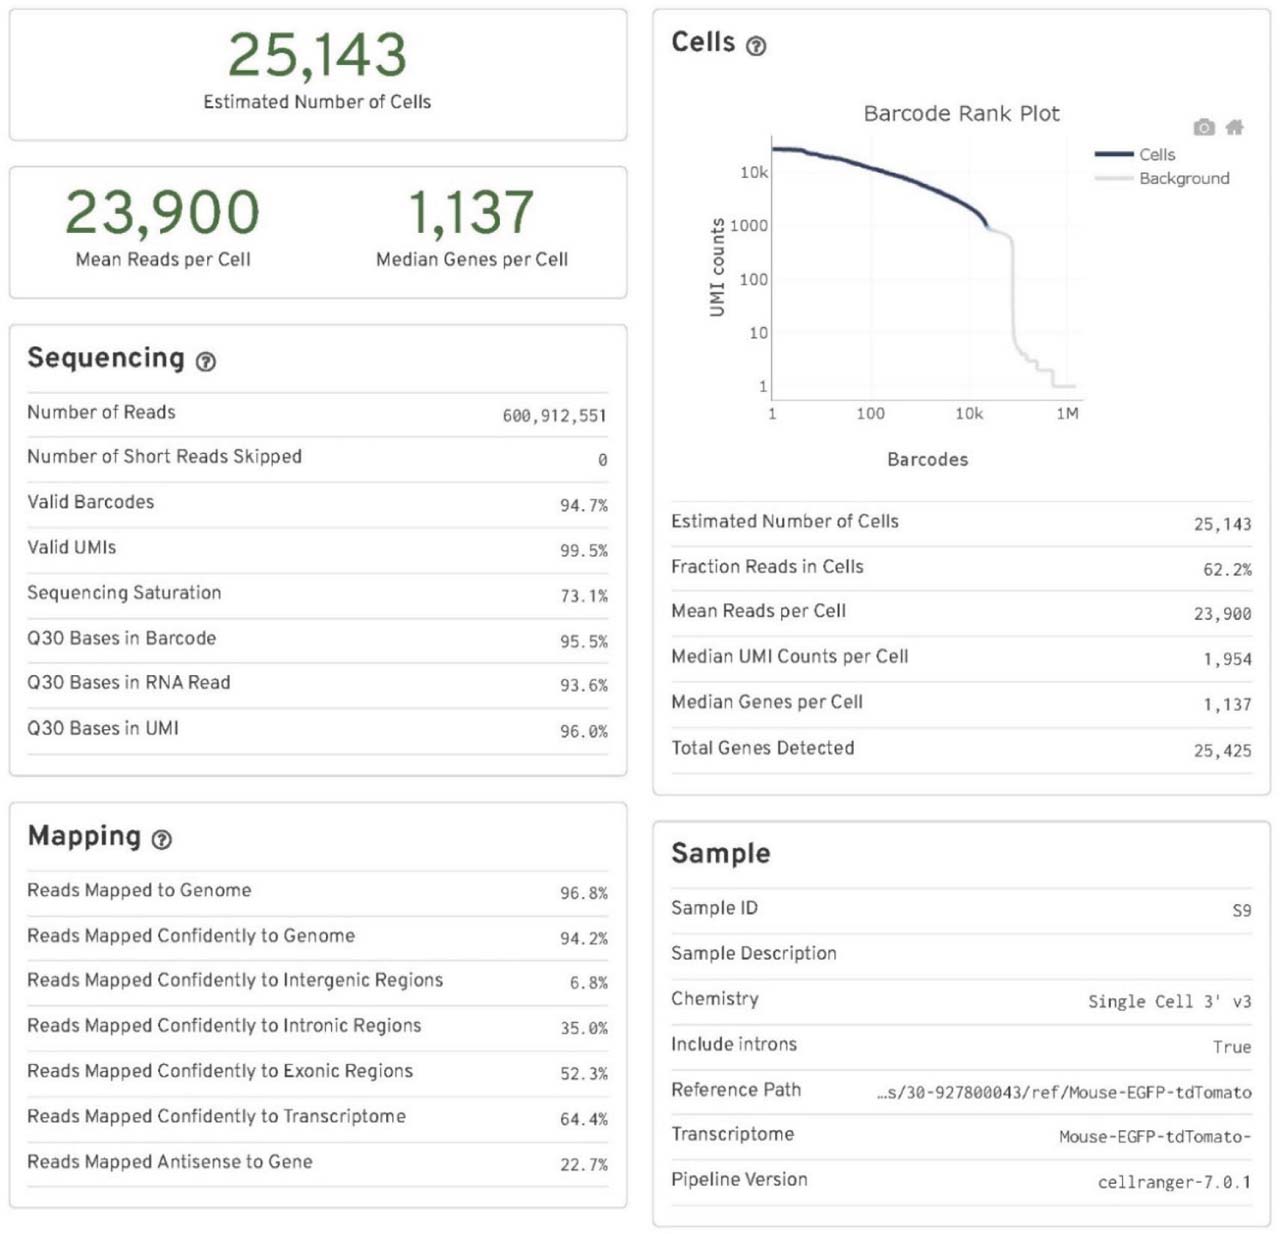
Cell Ranger output quality control file for the control-ponatinib group. Key quality control parameters include the number of cells (nuclei) sequenced, mean reads per cell (nucleus), median genes per cell (nucleus), sequencing saturation, fraction reads in cells (nuclei), and reads mapped confidently to the modified Mouse-EGFP-tdTomato genome. N = 2 pooled mouse ventricles.
Supplementary Fig. 7.
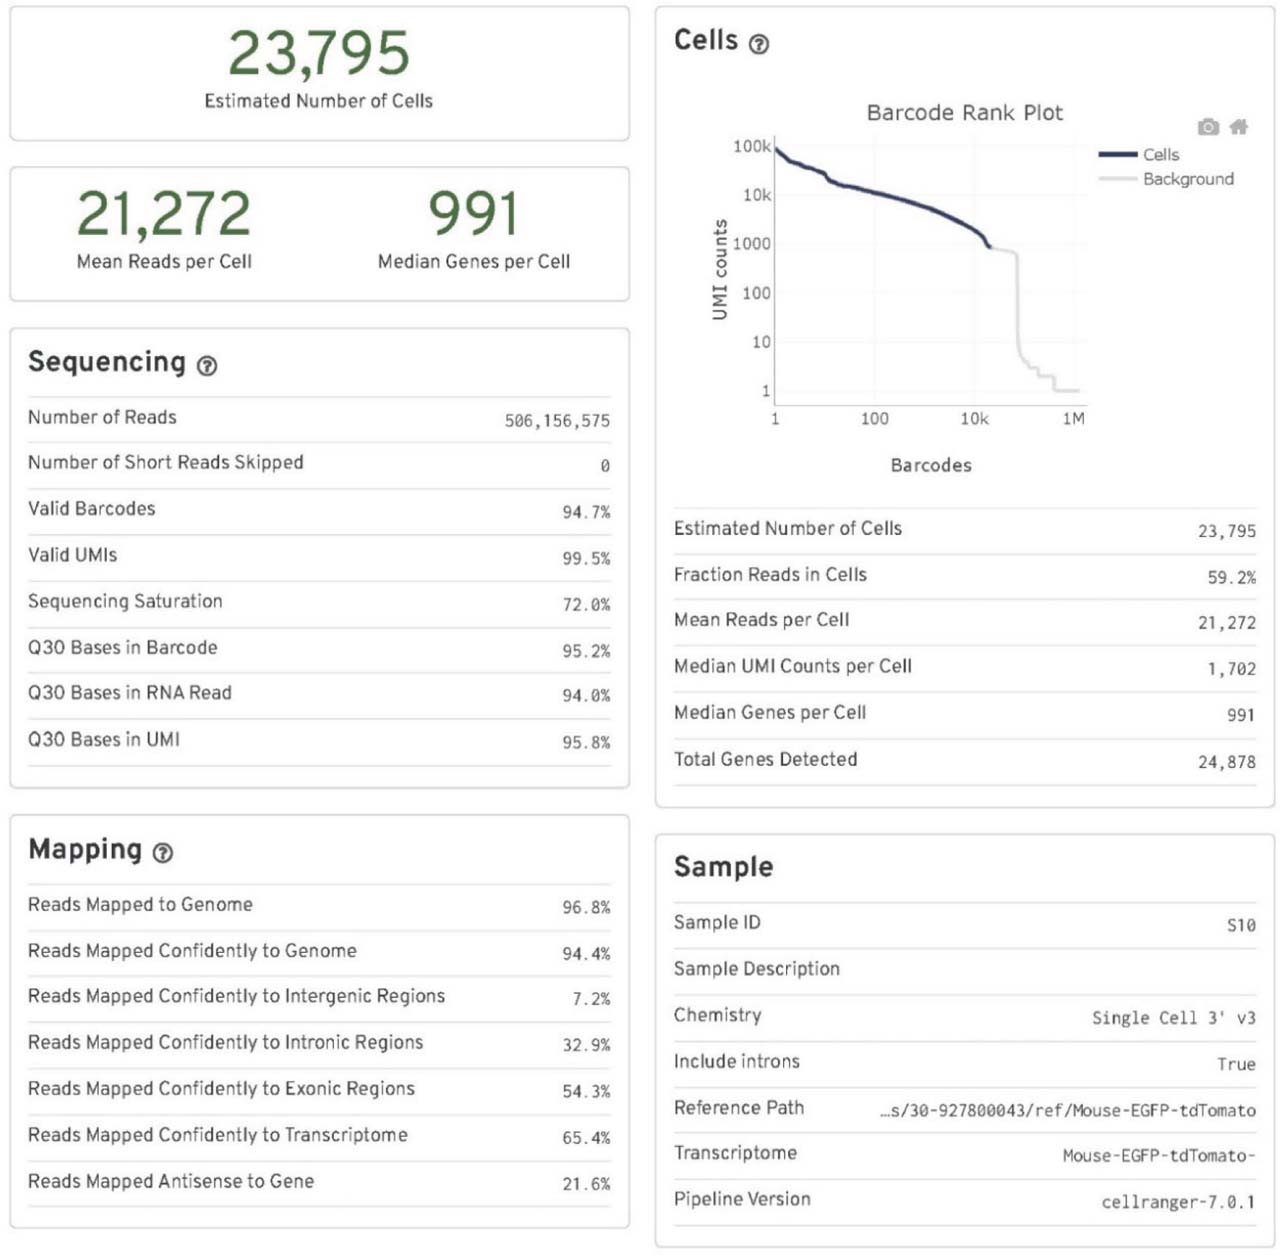
Cell Ranger output quality control file for the DKO-ponatinib group. Key quality control parameters include the number of cells (nuclei) sequenced, mean reads per cell (nucleus), median genes per cell (nucleus), sequencing saturation, fraction reads in cells (nuclei), and reads mapped confidently to the modified Mouse-EGFP-tdTomato genome. N = 2 pooled mouse ventricles. DKO, inducible cardiomyocyte-specific ROCK1 and ROCK2 double knockout; ROCKs, Rho-associated coiled-coil containing kinase.
Supplementary Fig. 8.
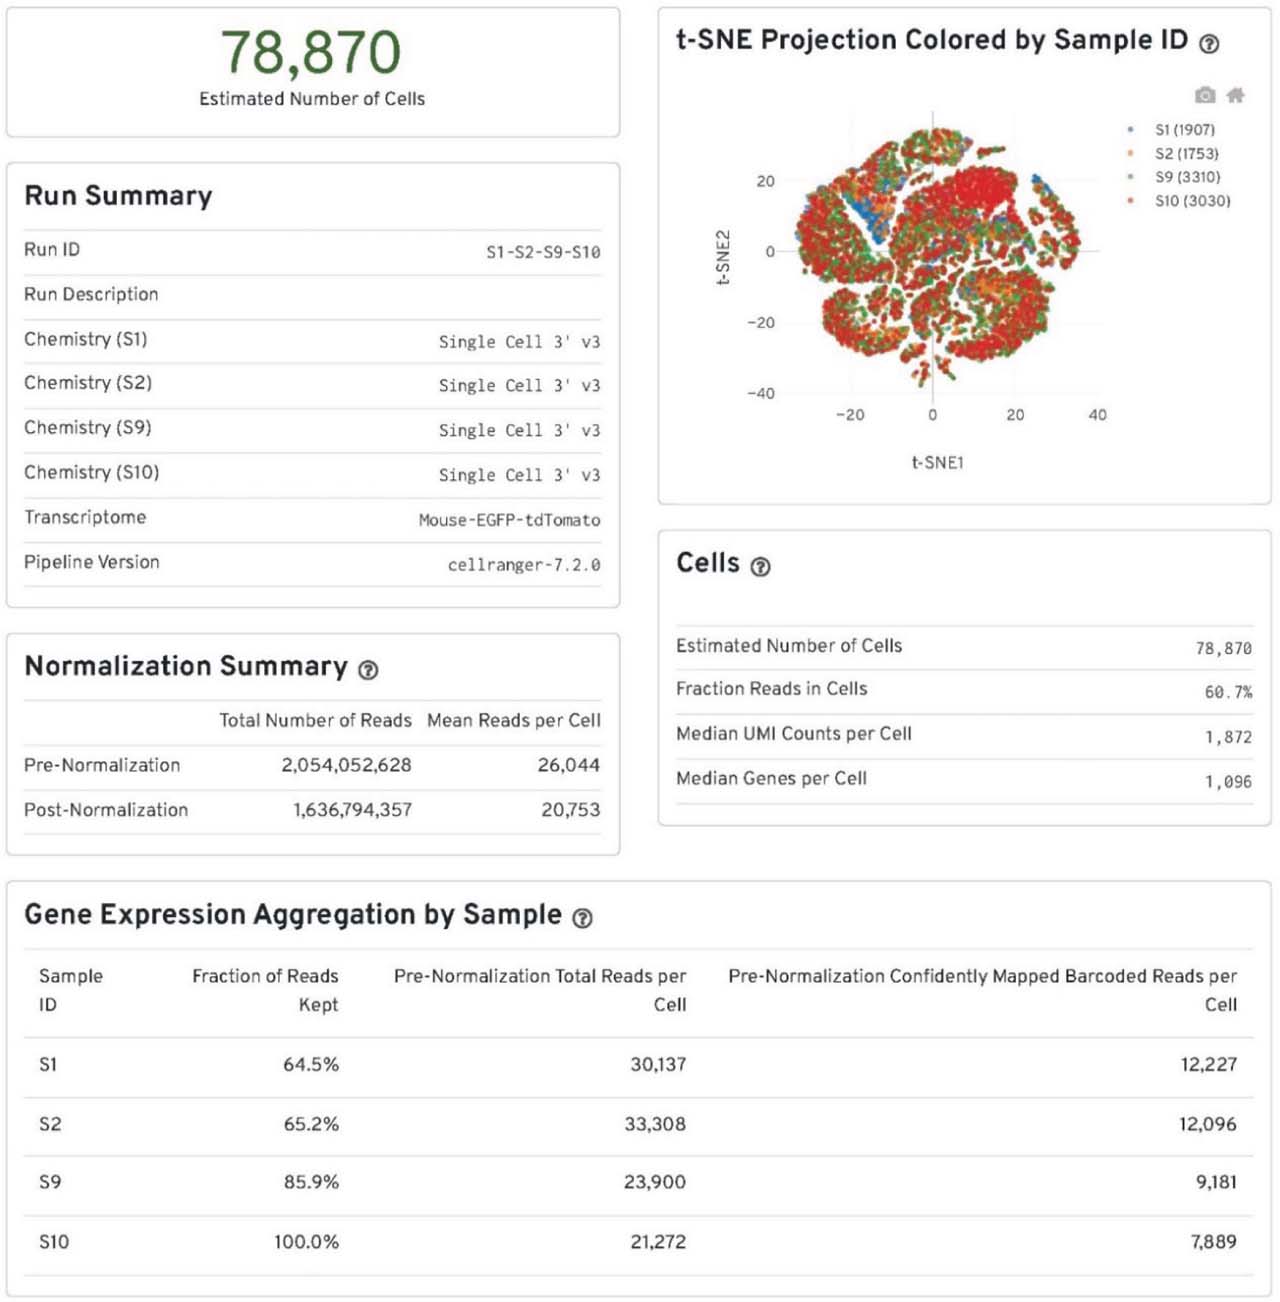
The summary of data integration by “cellranger aggr.” The outputs from the “cellranger count” of all four groups of the samples were aggregated, normalized to the same sequencing depth and then the feature-barcode matrices were recomputed by “cellranger aggr.” S1, S2, S9 and S10 correspond to the control-placebo, DKO-placebo, control-ponatinib, DKO-ponatinib groups respectively. N = 2 pooled mouse ventricles in each group. DKO, inducible cardiomyocyte-specific ROCK1 and ROCK2 double knockout; ROCKs, Rho-associated coiled-coil containing kinase.
Supplementary Fig. 9.
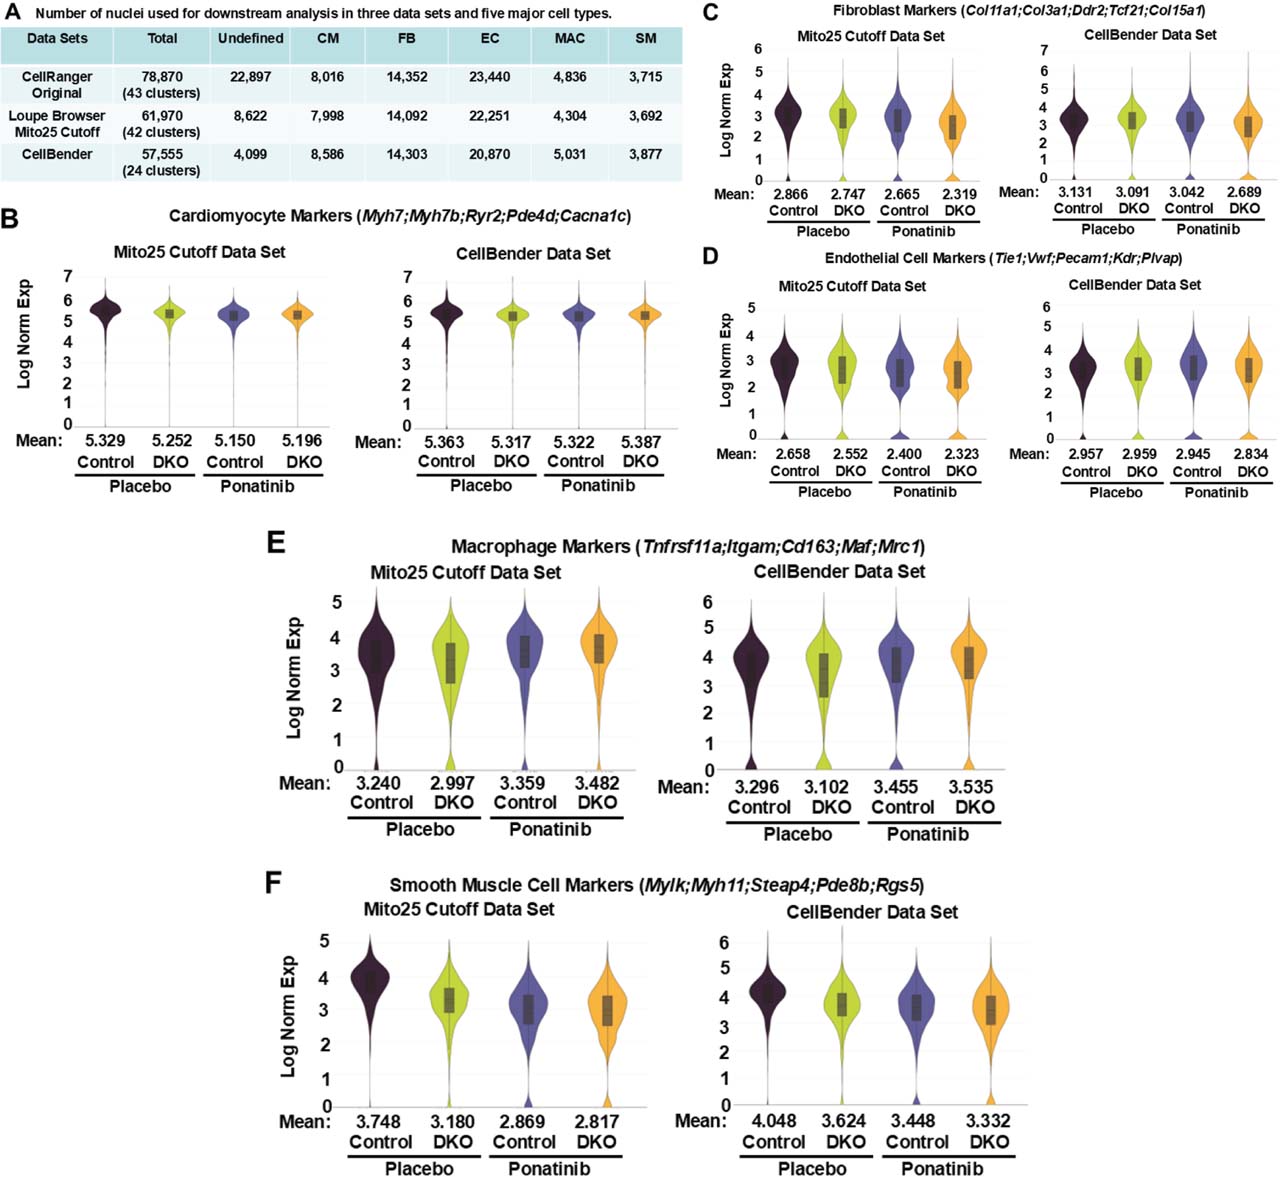
Comparison of Loupe Browser filtering and CellBender outputs. (A) Number of nuclei in each data set and five major cell types. Three integrated data sets were used for differential gene expressions and pathway analyses performed for four groups of the samples (control-placebo, DKO-placebo, control-ponatinib, DKO-ponatinib) by Loupe Browser. CellRanger Original data set represents the initial CellRanger output without performing filtering procedure therefore containing the highest number of the UNDEF (low-quality nuclei). Loupe Browser Mito25 Cutoff data set represents the filtered and reclustered data set including removing the nuclei with more than 25% of the transcripts coming from mitochondrial genes. CellBender output represents the data set after ambient RNA removal. In both Loupe Browser Mito25 Cutoff data set and CellBender data set, a large part of nuclei in the UNDEF were removed with only minimal effects on the number of five major cell types. In addition, Loupe Browser filtering generated 42 clusters compared to 24 clusters in CellBender output. (B–F) Comparison of the major cell type gene expressions between Loupe Browser Mito25 Cutoff data set and CellBender output data set. Violin plots with the mean expression values of combined expression of five signature genes used to identify cardiomyocyte clusters (B), fibroblast clusters (C), EC clusters (D), macrophage clusters (E), and SM clusters (F) among four groups of the samples, showed similar patterns between these two data sets. DKO, inducible cardiomyocyte-specific ROCK1 and ROCK2 double knockout; EC, endothelial cells; ROCKs, Rho-associated coiled-coil containing kinase; SM, smooth muscle cells; UNDEF, undefined cluster.
Supplementary Fig. 10.
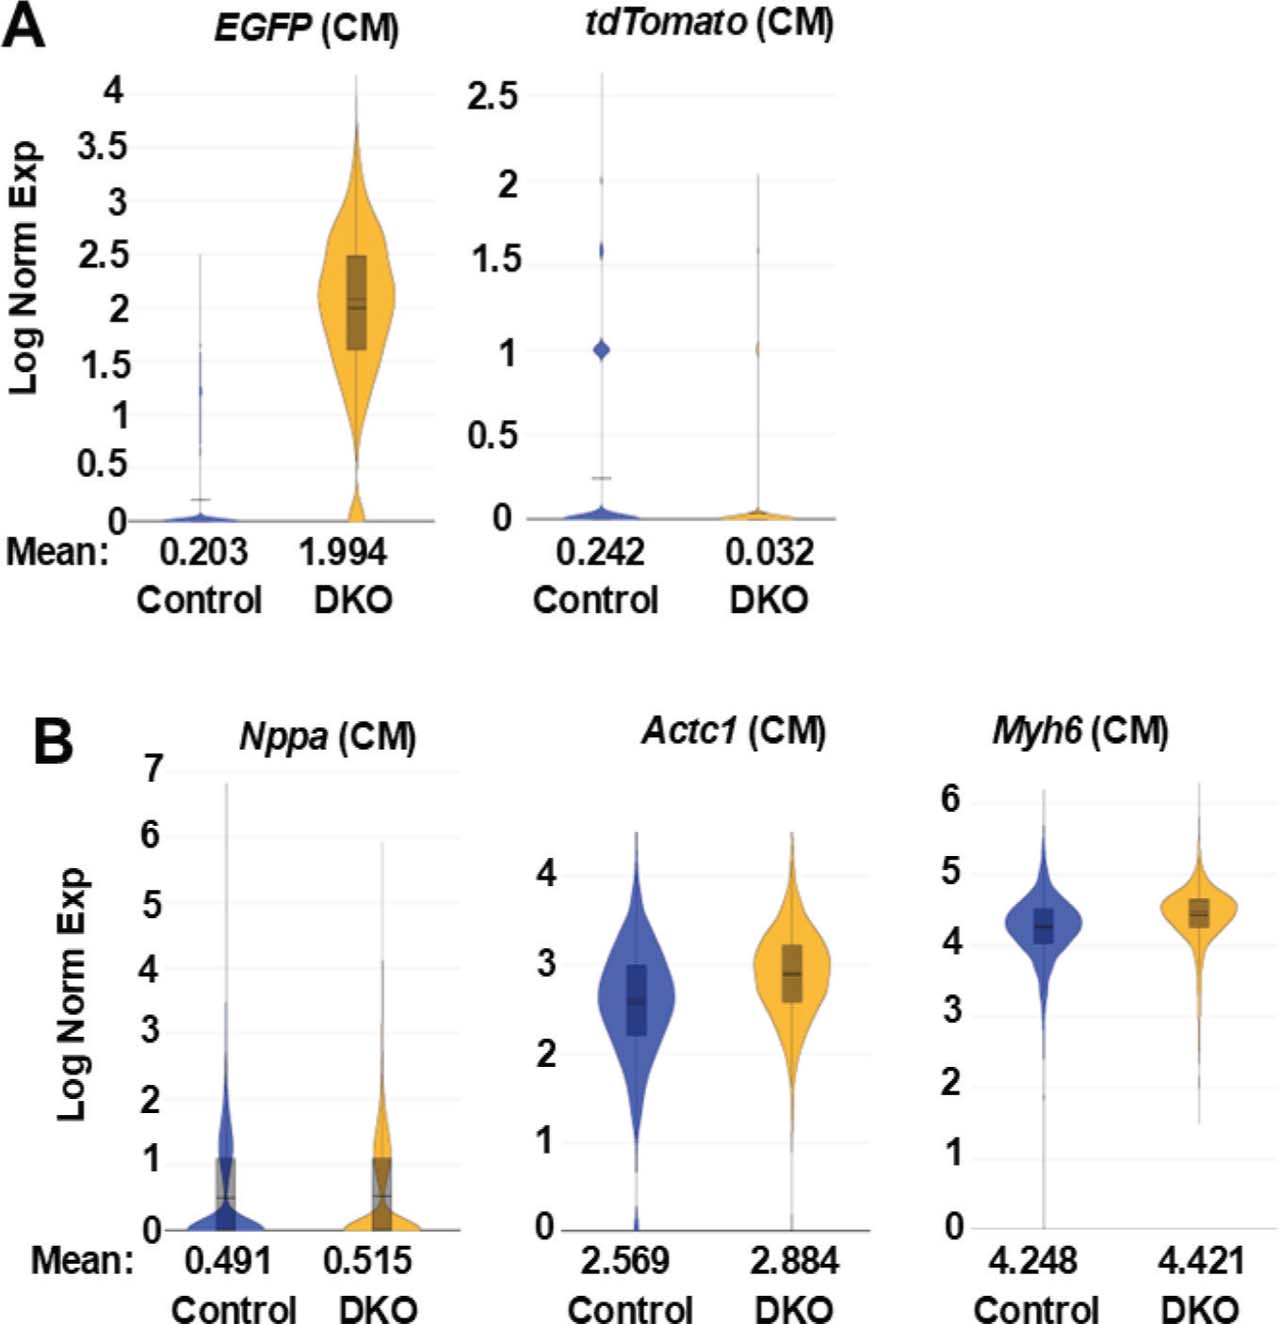
Differential EGFP and tdTomato gene expressions in the cardiomyocyte clusters of ponatinib-treated control and DKO hearts. (A) Violin plots of EGFP and tdTomato in cardiomyocyte (CM) clusters of control-ponatinib (2946 nuclei) and DKO-ponatinib (2551 nuclei) groups, showing induction of EGFP expression and reduction of tdTomato expression in DKO cardiomyocyte compared to control cardiomyocyte, expressed as Log Normalized Expression Levels (Log Norm Exp). (B) Violin plot of three typical cardiomyocyte markers (Nppa, Actc1, Myh6) which are expressed at comparable levels in the control and DKO CM clusters. DKO, inducible cardiomyocyte-specific ROCK1 and ROCK2 double knockout; ROCKs, Rho-associated coiled-coil containing kinase.
Supplementary Fig. 11.
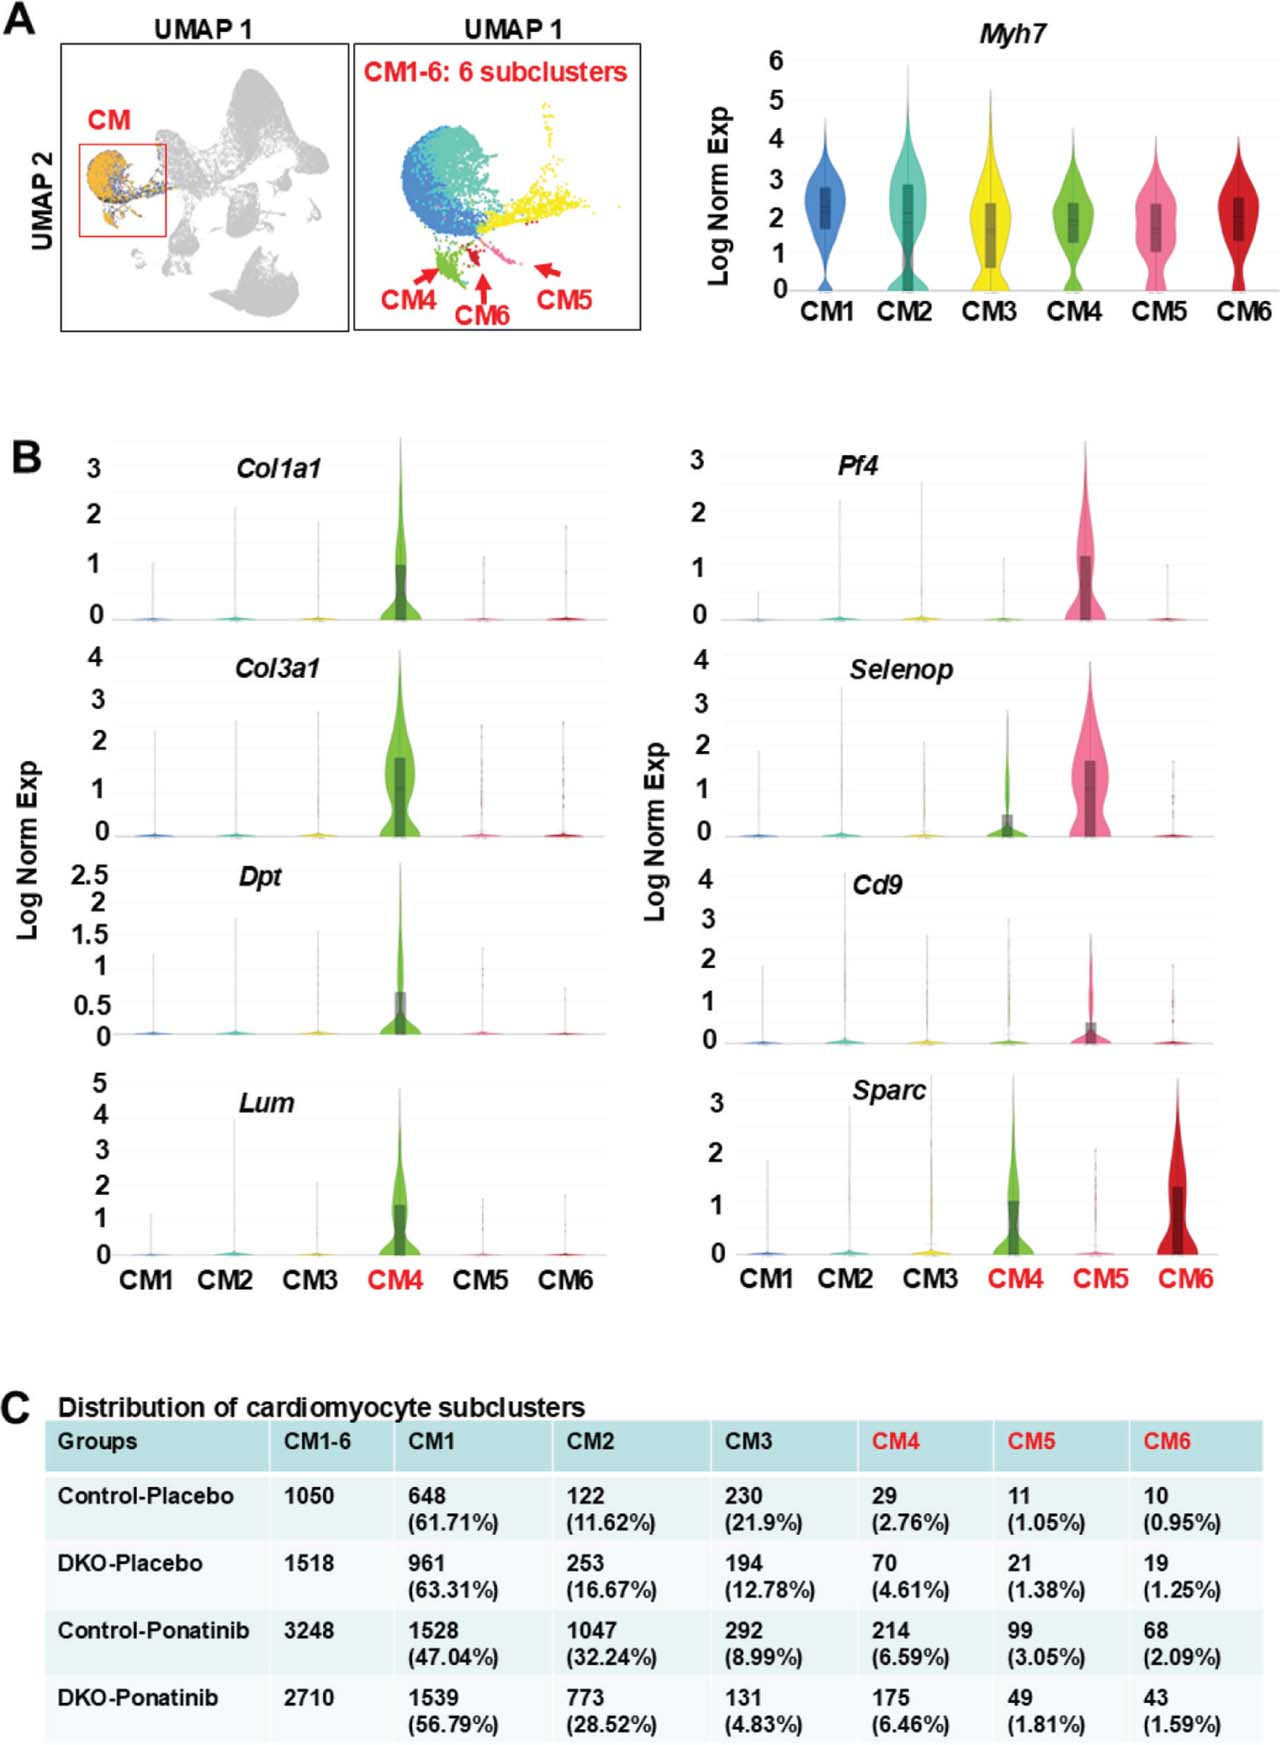
Analyses of cardiomyocyte subclusters using the CellBender output data set showing the enrichment of ponatinib-induced non-cardiomyocyte gene expressions in individual subclusters. (A) UMAP highlighting the cardiomyocyte cluster from the aggregation of four samples (control-placebo, DKO-placebo, control-ponatinib, DKO-ponatinib) containing six distinct subclusters (CM1-6). cardiomyocyte marker Myh7 was presented across all six subclusters. (B) Violin plots, performed on six subclusters, showing CM4 expressed the highest levels of fibroblast-related DEGs (e.g. Col1a1, Col3a1, Dpt, Lum) and CM4-6 expressed the highest levels of endothelial cell- and macrophage-related DEGs (e.g. Sparc, Selenop, Cd9, Pf4). (C) Relative nuclei distribution of six sub-clusters in each of the four samples. The numbers and ratios of nuclei in each subcluster of each sample were listed. The relative nuclei distributions of CM4-6 were all increased in control-ponatinib vs. control-placebo groups, while the increases for CM5-6 were less in the DKO-ponatinib vs. control-ponatinib groups. DEGs, differentially expressed genes; DKO, inducible cardiomyocyte-specific ROCK1 and ROCK2 double knockout; ROCKs, Rho-associated coiled-coil containing kinase; UMAP, uniform manifold approximation and projection.