
1. Introduction
Chronic myeloid leukemia (CML) is characterized by the Philadelphia chromosome, which results from a reciprocal translocation (t[9;22][q34;q11.2]), creating a fusion gene between the breakpoint cluster region (BCR) gene on chromosome 22 and the Abelson murine leukemia gene 1 (ABL1) gene on chromosome 9 (Jabbour and Kantarjian 2018). The fusion gene, breakpoint cluster region gene fused with the Abelson murine leukemia gene 1(BCR-ABL1), is a constitutively active tyrosine kinase that drives leukemic transformation and proliferation. Tyrosine kinase inhibitors (TKIs) such as those approved for the treatment of CML and Philadelphia+ (Ph+) acute lymphocytic leukemia (ALL) have revolutionized the treatment of these diseases (Zhong et al. 2021). Unfortunately, long-term treatment with imatinib (first-generation TKI) and dasatinib (second-generation) for patients has led to the development of drug resistance, mostly due to acquisition of new mutations in the fusion gene BCR-ABL1. To circumvent drug resistance encountered with first and second generation TKIs, a third-generation TKI ponatinib was developed (O’Hare et al. 2009). Although it is highly effective for refractory CML and ALL, severe cardiotoxicity (CTX) and vascular adverse events have been reported in a significant number of patients. Consequently, ponatinib was temporarily withdrawn from markets (Gainor and Chabner 2015). Albeit returned due to its indispensability, it is still restricted primarily to CML or ALL harboring imatinib-resistant T315I BCR-ABL1 mutation because there is no better alternative treatment option (Saussele et al. 2020; Singh et al. 2020). Therefore, investigating underlying mechanisms of ponatinib-induced toxicity is essential to develop strategies to defend against its CTX side effects (Singh et al. 2019, 2020).
An important downstream target of ABL kinases is p190RhoGAP, which inactivates the small GTPase RhoA and its further downstream effectors, Rho-associated coiled-coil containing kinases (ROCKs). ROCK activity is increased in the peripheral blood mononuclear cells of Ph+ leukemia patients treated with dasatinib and ponatinib compared to patients receiving imatinib and placebo (Yu et al. 2022). This supports the underlying mechanisms mediating CTX effects of TKIs are in part through RhoA/ROCKs hyperactivation occurring downstream of ABL inhibition, which possibly could be considered as “on-target” effects of TKIs.
ROCKs are central regulators of the actin cytoskeleton and have been implicated in a wide range of cardiovascular and cerebrovascular disorders. The two isoforms, Rho-associated coiled-coil containing kinases 1 and 2 (ROCK1 and ROCK2), are highly homologous. Previously, we found that ROCK1 is a key molecule in mediating apoptotic signaling in cardiomyocytes in pathological cardiac hypertrophy models (Chang et al. 2006; Zhang et al. 2006; Shi et al. 2008, 2010, 2011). We also demonstrated that ROCK1 deletion restores autophagic flux in doxorubicin-induced CTX in global and cardiomyocyte-specific ROCK1 knockout mice (Shi et al. 2018). Recently, we found that ROCK1 deficiency enhances caveolar molecular signaling and cell membrane repair following membrane disruption by mechanical force and oxidative damage in global and cardiomyocyte-specific ROCK1 knockout mice and in ROCK1-deficient mouse embryonic fibroblasts (Shi and Wei 2024). Collectively, these loss-of-function studies, along with other studies, have provided strong evidence that ROCK1 is a vital player in pathologic cardiac fibrosis and cardiomyocyte death. Additionally, in primary cells derived from patients, we observed anti-proliferative/survival activity of ROCK inhibitors against BCR-ABL1 and T315I BCR-ABL1 (Mali et al. 2011). The cardioprotective effects of ROCK1 deficiency seen in heart failure experimental models and anti-leukemic effects of ROCK inhibition in myeloid cells show that targeting ROCK activity may mitigate ponatinib-induced CTX effects while retaining its anti-leukemic properties. It should be noted that single ROCK2 deletion in cardiomyocytes can increase cardiac fibrosis during aging through compensatory up-regulation of ROCK1, suggesting different roles associated with the two isoforms (Shi et al. 2019). Hence, double ROCK deletion is necessary to investigate roles of ROCK activity in cardiomyocytes in mediating ponatinib-induced CTX.
In this study, we established a ponatinib-induced CTX mouse model and were able to evaluate the long-term effects of ponatinib on cardiac structure and function. To further explore the roles of ROCK in CTX, we used the inducible cardiomyocyte-specific double ROCK knockout (DKO) mouse model (Shi et al. 2019). Remarkably, we observed that double ROCK deletion in cardiomyocytes significantly prevented cardiac dilation and improved cardiac function following treatment. Moreover, the data revealed that double ROCK deletion in cardiomyocytes reduced the rise of various circulating vascular toxicity biomarkers correlated with CTX. To deconstruct the cellular and molecular mechanisms underlying the cardiovascular protection, a single-nucleus RNA sequencing (snRNA-seq) study was conducted, and meticulous data analysis revealed that several cell-type-specific ponatinib-induced transcriptomic signatures were attenuated in DKO mouse hearts. Comparative gene expression analysis across groups identified differential regulation of extracellular matrix-and thrombogenesis-related genes in cardiomyocytes, myofibroblast activation-associated genes in fibroblasts, and genes involved in cell proliferation and endothelial-to-mesenchymal transition in EC.
2. Materials and Methods
2.1. Approvals
All animal experiments were conducted in accordance with the National Institutes of Health “Guide for the Care and Use of Laboratory Animals” and were approved by the Institutional Animal Care and Use Committee at Indiana University School of Medicine.
2.2. Generation of double ROCK knockout mouse models
Generation of inducible DKO mouse was previously described (Shi et al. 2019). In brief, mice homozygous for the floxed Rock1 and Rock2 alleles (Rock1&2fl/fl) were crossed with the transgenic mice (α-myosin heavy chain promoter [αMHCMCM]) expressing tamoxifen-inducible MerCreMer recombinase (MCM) under the control of the αMHC (Sohal et al. 2001), and bred back to Rock1&2fl/fl mice to produce inducible DKO mice, αMHCMCM/Rock1&2fl/fl.
To label double ROCK-deleted cardiomyocytes, αMHCMCM/Rock1&2fl/fl mice were crossed with ROSAmT/mG mice from Jackson Laboratories (Stock No. 007676) and bred back to Rock1&2fl/fl mice to produce αMHCMCM/Rock1&2fl/fl/ROSAmT/mG mice. To activate inducible Cre (αMHCMCM), tamoxifen citrate diet (TD.130860 from Envigo Tekland) containing 400 mg/kg tamoxifen citrate were providing in chow to feed mice for 2 weeks followed by 4 weeks of regular chow to wash out the tamoxifen from their circulation before applying any additional experimental procedures on these mice. At 4 weeks after mice were on regular chow, about 70%–80% reduction of both Rock1 and Rock2 mRNA and their protein levels were observed in αMHCMCM/Rock1&2fl/fl/ROSAmT/mG (DKO) hearts without significant effects on cardiac function compared to control mice (Rock1&2fl/fl/ROSAmT/mG or αMHCMCM/ROSAmT/mG) as we previously observed with 3-day of tamoxifen intraperitoneal injection (Shi et al. 2019). Our previous study also indicated that the molecular changes were minimal between DKO and control mice at 4 weeks post-tamoxifen intraperitoneal injection; therefore, the preexisting effects are neglectable (Shi et al. 2019). The tamoxifen chow treatment at the indicated dosages has been employed in several studies, which showed no detectable effects on mouse heart structure and function (Wang et al. 2021; Yusuf et al. 2022). Briefly, ponatinib treatment started 4 weeks after mice were on regular chow. We used Rock1&2fl/fl/ROSAmT/mG mice as control mice in study for the following reasons: 1) both genotypes, Rock1&2fl/fl/ROSAmT/mG and αMHCMCM/ROSAmT/mG can serve as control groups owing to they were indistinguishable for their cardiac function after receiving tamoxifen treatment; 2) Rock1&2fl/fl/ROSAmT/mG and DKO mice were littermates from breading, therefore individual variability effect is the least.
2.3. In vivo mouse models of ponatinib CTX
The following three groups of mice of 6–8-month-old were used for ponatinib CTX study: 1) C57BL/6J mice, purchased from Jackson Laboratories; 2) DKO mice at 4 weeks after tamoxifen treatment; 3) control mice at 4 weeks after tamoxifen treatment. Both male and female mice were used for ponatinib treatment. Among three study mouse groups, the C57BL/6J mice were used for pilot studies to test several treatment plans, including various drug delivery methods, drug dosages, and treatment lengths (Supplementary Figures S1 and S2); the detailed descriptions of these pilot studies are presented in Supplementary Results. Other two groups, DKO (αMHCMCM/Rock1&2fl/fl/ROSAmT/mG) and control mice (Rock1&2fl/fl/ROSAmT/mG), after receiving tamoxifen treatment as detailed above, were used to assess the role of ROCK in mediating CTX. Ponatinib (HY-12047, MedChemExpress LLC) was dissolved in DMSO and administered to mice by oral gavage daily (35 mg/kg/day) for 4 weeks (N = 8 for DKO or control group, respectively) (Figure 1a). The placebo groups received an equal volume of DMSO in normal saline for 4 weeks (N = 8 for DKO or control group, respectively). Fresh stock solution was prepared every week and stored at 4°C. Oral gavages of ponatinib (dissolved in DMSO) or placebo (DMSO in normal saline) in mice were performed on awake animals by skilled personnel to ensure animal safety. Cardiac dimensions and muscle contraction were evaluated with VisualSonics® 2100 ultrasound machine for small animal imaging and MS400 transducer (Fujifilm Visual Sonics, Inc., Toronto, ON, Canada) before ponatinib treatment (baseline) and during the following 4 weeks with 1-week intervals as previously described (Shi et al. 2008, 2010, 2018, 2019). All mice were sacrificed 1 week after the last ponatinib oral gavage; a final echocardiogram was performed 1 day before sacrifice. Mice preceding echocardiography were anesthetized by isoflurane inhalation via a nose cone (1%–2% in oxygen) and maintained on a platform at 35°C. At the terminal experimental time point, animal euthanasia was performed by CO2 asphyxiation. Euthanasia was confirmed by a secondary physical method (cervical dislocation) to ensure death. A blood sample was immediately drawn from the left ventricle for serum preparation, which was used for evaluating inflammatory cytokines and vascular dysfunction biomarkers. Hearts were removed immediately, rinsed in pre-cooled PBS, followed by 1) flash freezing and stored in liquid nitrogen for later protein, RNA, or snRNA-seq analyses, 2) cryopreserved in OCT medium for cryo-sectioning, or 3) fixed in 4% paraformaldehyde buffer for paraffin embedding.
2.4. Fluorescence histology analysis
For cryo-sectioning DKO hearts, 10-µm sections were obtained using a TN 2085 semi-automatic cryostat (Tanner Scientific, Sarasota, FL, USA). Neither mT (tdTomato) nor mG (EGFP) required immunostaining before visualization under a fluorescence microscope. Slides were mounted in Vectashield mounting media (Vector Laboratories, Burlingame, CA, USA) containing diamidino-2-phenylindole (DAPI) to counterstain the nuclei. The fluorescent images were taken with Leica DM5500B microscope (objectives: HCX PL FUOTAR 20.0 × 0.50, HCX PL FUOTAR 40 × 0.75; Bannockburn, IL, USA) equipped with a DFC300FXR2 camera, and analyzed with the Leica AF6000 software (Bannockburn, IL, USA) as previously described (Shi et al. 2013a, b; Surma et al. 2014).
2.5. mRNA and protein analysis
Rock1 and Rock2 mRNA expression levels were quantitated by quantitative reverse transcription polymerase chain reaction (RT-qPCR) with left ventricular tissues from study mouse hearts as previously described (Shi et al. 2019). Protein sample preparation and quantitation by Western blot were performed as previously described (Shi et al. 2019).
2.6. Blood cardiovascular disease biomarkers analysis
Whole blood was collected from study mice at terminal time point and serums were prepared as described above. Analysis was performed by Eve Technologies (Calgary, AB, Canada) using the Panel 1 7-Plex Discovery Assay® Array (MDCVD1, Eve Technologies). The Panel 1 7-Plex Discovery Assay® Array simultaneously detected plasma levels of PAI-1 (Total), PECAM-1, sP-selectin, sE-selectin, Thrombomodulin, which are critical markers involved in inflammation, endothelial function, and thrombotic processes.
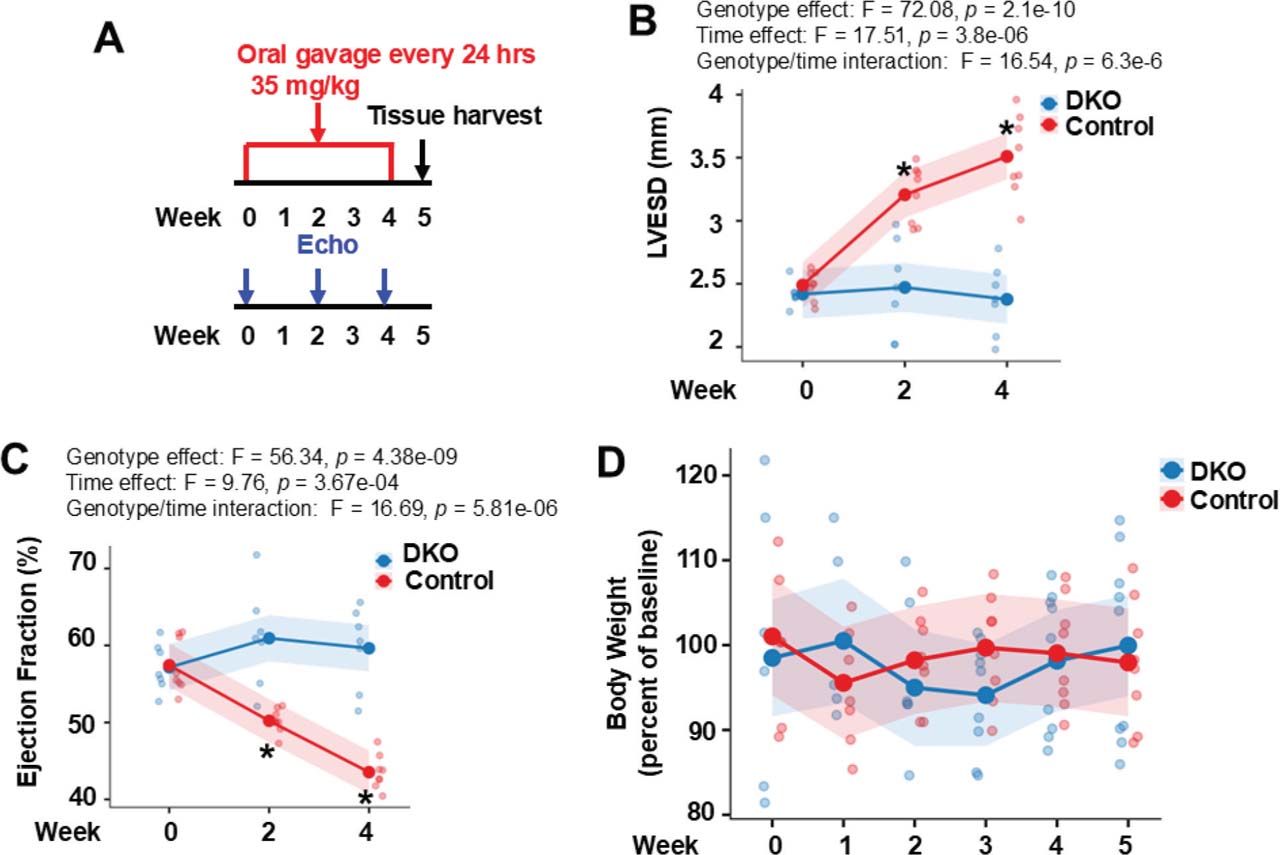
Fig 1.
Double ROCK deletion in cardiomyocytes is protective against ponatinib-induced CTX. (A) An experimental scheme using 6–8-month-old male control and DKO mice subjected to ponatinib treatment. Cardiac structure and function were monitored by multiple echocardiograms(Echo).(B) LVESD increased over time in control but not in DKO mice. The same pattern has been found in left ventricular end diastolic dimension (genotype effect: F = 52.31, p = 1.03e−08). (C) EF declined progressively in control but not in DKO mice. The same pattern has been found in FS (genotype effect: F = 67.57, p = 4.82e−10). (D) No significant reductions of body weight in two ponatinib-treated groups during the entire course (all p > 0.05). (B–D): N = 8 mice in each group. For statistical analysis, p-values were calculated using two-way repeated-measures ANOVA followed by post hoc multiple-comparison testing for (B,C) and two-way repeated-measures ANOVA was used to assess group differences over time for (D). DKO, inducible cardiomyocyte-specific ROCK1 and ROCK2 double knockout; EF, ejection fraction; FS, fractional shortening; LVESD, left ventricular end systolic dimension; ROCK, Rho-associated coiled-coil containing kinase.
2.7. snRNA-seq analysis
Flash frozen ventricle tissues from two individual mice were pooled based on genotype and ponatinib treatment condition: DKO-placebo, DKO-ponatinib, control-placebo, control-ponatinib. The samples of four-group were shipped in dry ice to Azenta (Azenta Life Sciences, South Plainfield, NJ, USA) for snRNA-seq analysis. All samples were stored at −80°C upon receiving next day until further processing for nuclei extraction and sequencing.
Nuclei extraction was performed in the Miltenyi Nuclei Extraction Buffer (Miltenyi Biotec, Auburn, CA, USA) following manufacturer’s guidelines with gentle MACS Dissociation and C tubes (Miltenyi Biotec). Isolated nuclei were counted post-trypan blue staining with Thermo Fisher Countess III automated cell counter (Thermo Fisher, Waltham, MA, USA). Single-nucleus 3’ RNA libraries were generated using the Chromium Single Cell 3’ kit (10X Genomics, CA, USA). High-throughput single-nucleus gene expression profiling was achieved by targeting capture of ~10,000 Gel Beads-in-Emulsion per sample for downstream analysis and processed through the Chromium Controller following the standard manufacturer’s specifications. The sequencing libraries were evaluated for quality on the Agilent TapeStation (Agilent Technologies, Palo Alto, CA, USA), and quantified using Qubit 2.0 Fluorometer (Invitrogen, Carlsbad, CA, USA). Pooled libraries were quantified using qPCR (Applied Biosystems, Carlsbad, CA, USA) prior to loading onto an Illumina HiSeq (4000 or equivalent) instrument (Illumina, San Diego, CA, USA). The samples were sequenced at a configuration compatible with the recommended guidelines as outlined by 10X Genomics (Pleasanton, CA, USA).
2.8. snRNA-seq data analysis
Raw sequence data (.bcl files) were converted into fastq files and de-multiplexed using the Cell Ranger (7.0.1, 10X Genomics) “cellranger mkfastq” command. Data were then analyzed using “cellranger count” pipeline with the modified Mus musculus reference with addition of sequences of EGFP and tdTomato, obtained from the original vector, which had been used to create ROSAmT/mG mice (Muzumdar et al. 2007). From the outputs of “cellranger count” pipeline, the cloupe. cloupe files were processed, explored and visualized using Loupe Browser v8.0 (10x Genomics, Pleasanton, CA, USA). To analyze all samples together, outputs from the “cell-ranger count” of all samples were aggregated, normalized to the same sequencing depth and then the feature-barcode matrices were recomputed by “cellranger aggr.” The resulted cloupe.cloupe files of combined samples were then analyzed by Loupe Browser v8.0. For quality control, we used the “Reanalyze” mode on the Loupe Browser, which provides an interactive filtering and reclustering workflow. The filtering was performed as follows: unique molecular identifiers (UMIs) were normalized to include counts between 400 and 40,000; features included were in the range of 300–6000, nuclei with more than 25% of the transcripts coming from mitochondrial genes were removed. After quality filtering and removing low-quality nuclei from the dataset, the remaining nuclei were then reclustered by Loupe Browser and for further downstream analysis.
Besides the quality control performed by Loope Browser described above, we also performed an additional procedure to remove ambient RNA and technical artifacts from snRNA-seq data with CellBender as a tool to generate the final file containing a cleaned gene expression matrix. The outputs of CellBender pipeline (.h5 files) were converted to Seurat objects (.rds files), which were then converted using the LoupeR package (10x Genomics) into Loupe Browser files (.cloupe files) for further downstream analysis.
2.9. Statistical analysis
Data are presented as mean ± SEM. Comparisons between treated and placebo groups within each genotype were performed using two-tailed Student’s t-tests. Longitudinal outcomes were analyzed using linear mixed-effects models with fixed effects for group, time, and their interaction to account for repeated measures, followed by post hoc contrasts based on estimated marginal means with multiplicity adjustment (Holm or Tukey). Two-way ANOVA was used to assess the main effects of two categorical factors and their interaction (e.g., cardiac structural and functional parameters); when the overall F test was significant, Tukey’s honestly significant difference test was applied for multiple comparisons. Pathway enrichment analyses were conducted using the Fisher exact test (FET) with false discovery rate control by the Benjamini–Hochberg method. A two-sided p < 0.05 was considered statistically significant. Part of sequence and statistical analyses were conducted in R (version 4.5.3) with Microsoft Copilot support; all scientific interpretations, decisions, and conclusions were made by the authors.
2.10. Data availability
The data supporting the findings in this study are available in the methods and/or Supplementary Data of this article. The raw and processed snRNA-seq data supporting the findings have been deposited in the Gene Expression Omnibus under accession number GSE324906. All data will become publicly available upon publication.
3. Results
3.1. Establishing a CTX mouse model for comprehensiveevaluation
Most pre-clinical studies using mouse models were focused on acute and short-term vascular events. To establish an optimal in vivo CTX mouse model for evaluating cardiac structural and functional detriments, we tested several treatment plans including various drug delivery methods, drug dosages, and treatment lengths (Supplementary Figures S1 and S2). Detailed descriptions of these pilot studies are presented in Supplementary Results. In addition, we assessed drug dose-dependent regulation of mRNA levels of ROCKs, revealing significant increases in ponatinib-treated mouse hearts at 30 mg/kg/day, 35 mg/kg/day, or 40 mg/kg/day for 7 days (Supplementary Figure S2e). We quantitatively detected a significant progressive upregulation of Rock1 and Rock2 mRNA from dose 30 mg/kg/day to 40 mg/kg/day. Interestingly, Rock2 mRNA expression exhibited a steeper dose-response vs.Rock1 mRNA at doses 35 mg/kg/day and 40 mg/kg/day, implying a greater sensitivity of Rock2 mRNA to increased drug dosage. These observations support the association between the ponatinib-induced CTX and the increased ROCK expression.
Based on the above initial studies, we have established the following strategy utilized in all following experiments: mice at 6–8 months old were given ponatinib at 35 mg/kg/day by oral gavage for 4 weeks and were sacrificed at 1-week post-treatment (Figure 1a). Evidently, this strategy allowed us to detect observable left ventricular dilation (Figure 1b) and decline in cardiac functions (Figure 1c) in the control mice without significant reduction in body weight (Figure 1d), indicative of mild general drug toxicity with the experimental scheme. Importantly, double ROCK deletion in cardiomyocytes significantly prevented cardiac dilation following ponatinib treatment and left ventricular end systolic dimensions (LVESD) exhibited a significant genotype-dependent time course with progressive dilation in the control group but not in the DKO group (Figure 1b). The findings in cardiac functions such as ejection fraction (EF) also showed a significant genotype-dependent time course with progressive decline in the control group, but not in the DKO group (Figure 1c). Therefore, cardiac structure and function were only preserved in DKO group during the whole observational period. The differences between the two genetic groups are biologically valuable.
Molecular analysis indicated around 70%–80% reduction of both ROCK1 and ROCK2 protein and mRNA levels in ponatinib-treated DKO hearts vs. ponatinib-treated control hearts (Supplementary Figure S3a, S3b). The results are consistent with cardiomyocyte-specific deletion of ROCKs as previously reported (Shi et al. 2019). In the current study, we have surveyed an alternative method for instantly validating Cre-mediated recombination in DKO cardiomyocytes using ROSAmT/mG mice (Muzumdar et al. 2007). Fluorescent imaging detected only tdTomato red signal in the control-ponatinib heart sections, while DKO-ponatinib heart sections showed EGFP green signal in cardiomyocytes and tdTomato red signal in non-cardiomyocyte cells (Supplementary Figure S3c). Subsequent snRNA-seq data analysis further supported highly efficient Cre-mediated recombination in DKO cardiomyocytes (see Supplementary Results and Supplementary Figure S10).
3.2. Double ROCK deletion in cardiomyocytes suggested protection against ponatinib-induced vascular toxicity
We assessed vascular toxicity by measuring circulating markers of vascular dysfunction. The ponatinib treatment in the current study significantly increased serum levels of PAI-1 (Total), sE-selectin, sP-selectin, PECAM-1, and Thrombomodulin in the control mice, but not in ponatinib treated DKO mice (Figure 2a–e), resulting in a marked responsive difference between genotypes; loss of ROCKs can blunt drug-induced elevation of these five biomarkers. Of note, although the circulating marker study was modest by sample size, it was worthwhile as it can be exploratory; they showed either significant reduced levels (Figure 2a) or a non-statistically significant trend of reduced levels (Figure 2b–e) in DKO mice vs. control mice after ponatinib treatment. Hence, from monitoring these circulating markers level in study mice, we could perceive the treatment effect, gaining the supportive information for cardiomyocyte ROCKs in mediating ponatinib-induced vascular dysfunction.
3.3. Identification of seven major cell type clusters and over 40 subclusters by snRNA-seq data analysis
We performed snRNA-seq analyses on mouse hearts of four-group, control-placebo, DKO-placebo, control-ponatinib, and DKO-ponatinib. Detailed descriptions of snRNA-seq data generation and the data quality control procedure are presented in Supplementary Results. To analyze all samples of four-group together, their data files (Supplementary Figures S4–S7) were pooled together using the 10X Genomic’s “cellranger aggr” pipeline (Supplementary Figures S8). After quality control, the remaining 61,970 nuclei (named Loupe Browser Mito25 Cutoff data set) across four samples were then reclustered, followed by arrangement of two-dimensional uniform manifold approximation and projection (UMAP) for visualization (Figure 3a). To better define major cell types, we used K-means clustering mode (K = 10) for unsupervised clustering, which revealed 10 distinct clusters, which were then manually defined based on the expression of cell type-specific signature genes (Figure 3b). Seven major cell types were annotated (Figure 3a), including cardiomyocytes (cluster 4), EC (clusters 2, 5, 8), fibroblasts (cluster 3), macrophages/monocytes (cluster 6), smooth muscle cells (SM) (cluster 7), epicardial cells (EP) (cluster 9), and lymphocytes (LYPH) (cluster 10). Cluster 1 is named undefined cluster (UNDEF) and shows no clear pattern of gene expression (Figure 3b) but a high number of mitochondrial genes per nucleus. After performing Loupe Browser filtering, though most nuclei in the undefined low-quality cluster were removed, it almost shows no effects to shift the number of major cell types (Supplementary Figure S9).
In-depth studies were focused on differential gene expression and pathway analyses in all four groups and five major cell types, including cardiomyocytes (12.9% of total nuclei), fibroblasts (22.7%), EC (35.9%), macrophages (7.6%), SM (6.0%). LYPH cluster (472 nuclei, <1% of total nuclei), EP cluster (413 nuclei, <1% of total nuclei), and the undefined low-quality cluster (13.9%) weren’t included for further analysis.
In addition to performing quality control by Loupe Browser, we also performed a computational procedure to remove ambient RNA and technical artifacts from snRNA-seq data with CellBender. CellBender processing removed background RNA counts due to more abundant gene expressions in cardiomyocytes than in other cell types. A major difference between the CellBender output data set and Loupe Browser Mito25 Cutoff data set is that Loupe Browser Mito25 Cutoff data set contains 42 clusters in Graph-Based Clustering mode compared to 24 clusters in CellBender output (Supplementary Figure S9). As the overall goals of the downstream analyses involve five major cell type clusters and their subclusters, the subsequent downstream analyses were mainly focused on Loupe Browser Mito25 Cutoff data set which contains more clusters. We used CellBender data set to validate some of the results from Loupe Browser Mito25 Cutoff data set to distinguish robust cell-type-specific signals and findings that may be partially influenced by ambient RNA contamination (Supplementary Results and Supplementary Figure S11).
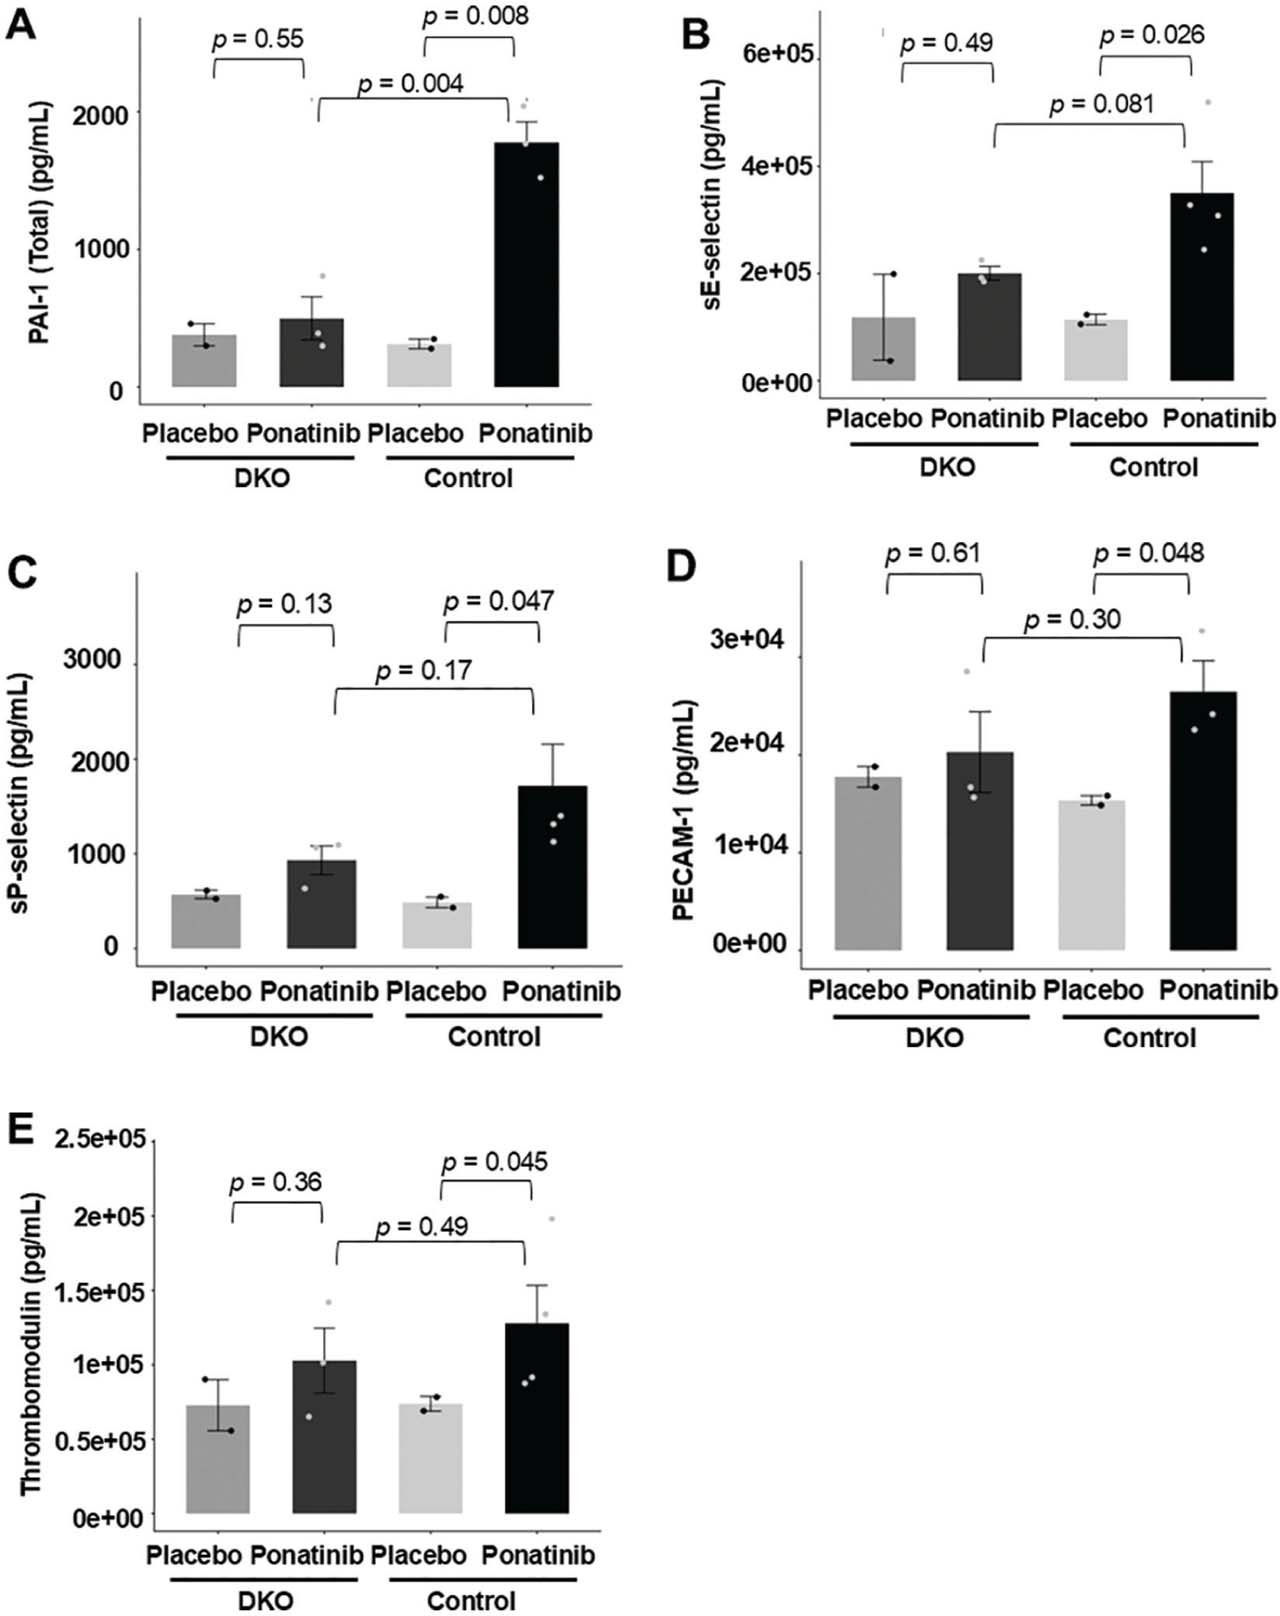
Fig 2.
Reduced vascular toxicity biomarkers in ponatinib-treated DKO mice. Whole blood was collected from the left ventricle of both ponatinib-treated DKO and control mice. Serum levels of PAI-1 (Total) (A), sE-selectin (B), sP-selectin (C), PECAM-1 (D), and Thrombomodulin (E) were measured using the Panel 1 7-Plex Discovery Assay® Array (Eve Technologies). Ponatinib treatment significantly increased serum levels of PAI-1 (Total), sE-selectin, sP-selectin, PECAM-1, and Thrombomodulin (A–E) in control mice. In contrast, these markers showed only the trend of increased circulating levels, but not significant in treated DKO mice (A–E). N = 3–4 mice in each group. For statistical analysis, p-values were calculated using an unpaired two-tailed Student’s t-test for (A–E). DKO, inducible cardiomyocyte-specific ROCK1 and ROCK2 double knockout; ROCK, Rho-associated coiled-coil containing kinase.
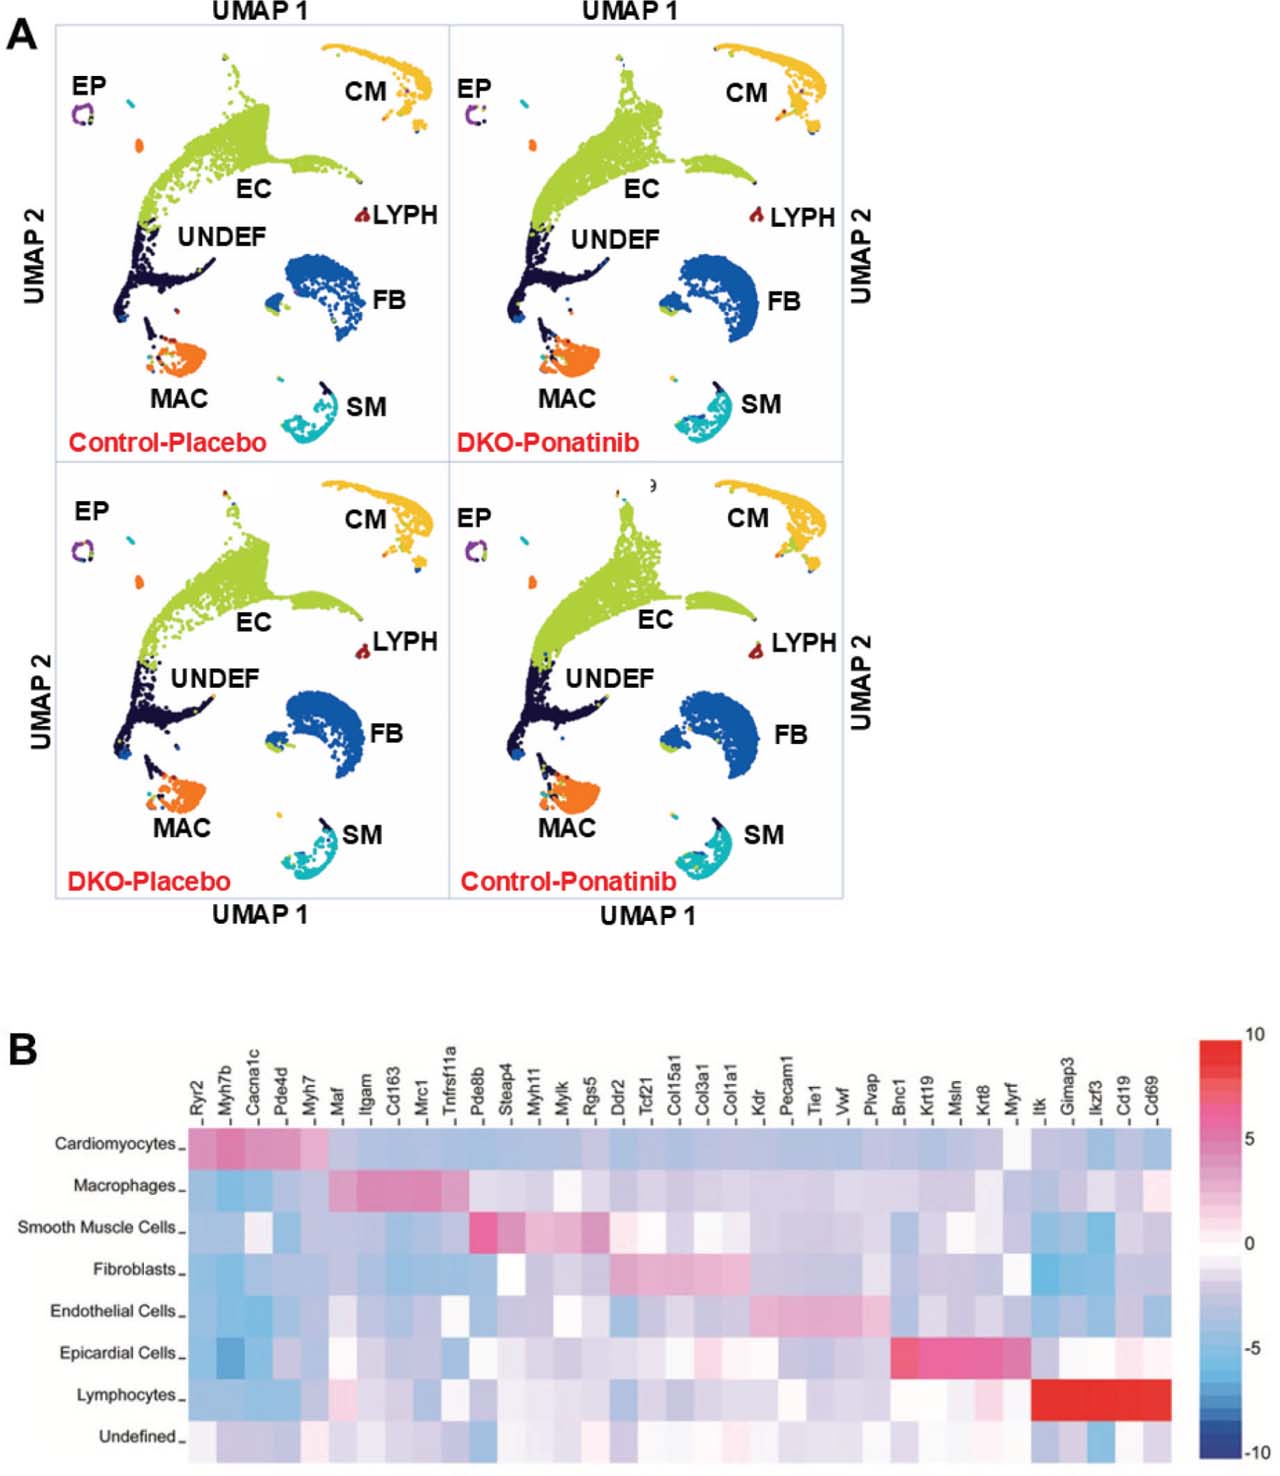
Fig 3.
Data from snRNA-seq reveals similar distribution of major cell types in DKO and control hearts with or without ponatinib treatment. (A) Loupe Browser output displayed as two-dimensional UMAP visualization after unsupervised clustering for 61,970 nuclei from 4 groups of ventricular samples including the control-placebo (10,997 nuclei), DKO-placebo (12,411 nuclei), control-ponatinib (21,731 nuclei), and DKO-ponatinib (16,831 nuclei). Seven major cell types and one UNDEF were identified for each group, including cardiomyocytes (CM), EC, fibroblasts (FB), macrophages/monocytes (MAC), SM, EP, and LYPH. (B) Gene expression heatmap depicting signature genes used to identify each cluster in (A). N = 2 pooled mouse ventricles in each group. DKO, inducible cardiomyocyte-specific ROCK1 and ROCK2 double knockout; EC, endothelial cells; EP, epicardial cells; LYPH, lymphocytes; MAC, macrophages/monocytes; ROCK, Rho-associated coiled-coil containing kinase; SM, smooth muscle cells; snRNA-seq, single-nucleus RNA sequencing; UMAP, uniform manifold approximation and projection; UNDEF, undefined cluster.
3.4. Differential gene expressions and pathway analyses of cardiomyocyte clusters revealed reduced extra-cellular matrix and blood coagulation-associated gene expression in ponatinib-treated DKO cardiomyocytes
Differential gene expression analysis was performed among the four clusters of cardiomyocytes, including control-placebo (984 nuclei), DKO-placebo (1409 nuclei), control-ponatinib (2946 nuclei), and DKO-ponatinib (2551 nuclei). Differentially expressed genes (DEGs) between different samples were identified using genes with adjusted p-values <0.05. Differential expression testing revealed a total of 1548 DEGs between control-placebo and control-ponatinib, 238 DEGs between control-ponatinib and DKO-ponatinib, 248 DEGs between control-placebo and DKO-placebo, and 291 DEGs between DKO-placebo and DKO-ponatinib.
Our major focus in snRNA-seq experiments is to gain enhanced comprehension of the cellular and molecular mechanisms underlying the protective effects of double ROCK deletion in cardiomyocytes. We centered the pathway analyses on the 238 DEGs between control-ponatinib and DKO-ponatinib cardiomyocyte clusters. Among these DEGs, 151 genes were downregulated (Supplementary Table S1), and 87 genes were upregulated (Supplementary Table S2) in DKO-ponatinib group. These lists of DEGs were subsequently used for downstream pathway analyses, which were conducted using the Enrichr web-based application (Chen et al. 2013; Kuleshov et al. 2016; Xie et al. 2021), the WikiPathways Mouse 2024 pathways database, and gene ontology (GO) Cellular Component 2025 database. Visualization of enriched pathways was conducted using the Enrichment Analysis Visualization Appyter.
Pathway analyses were performed on 151 downregulated DEGs in DKO-ponatinib cardiomyocyte cluster, which returned 63 enriched pathways. The top 10 enriched WikiPathways were all with p-values computed from FET reaching significance (e.g. <0.05) (Supplementary Table S3). However, they did not reach global significance, as their adjusted p-values computed using the Benjamini-Hochberg method for correction for multiple hypotheses testing were all >0.05; therefore, they were not further analyzed. We then conducted analysis using GO Cellular Component 2025 database on 151 downregulated DEGs in DKO-ponatinib cardiomyocyte cluster, which returned 112 enriched terms. Importantly, 4 of the top 10 enriched terms reached global significance with their adjusted p-values <0.05 (Figure 4a and Supplementary Table S4). Three of these four enriched terms shared similar characteristics related to platelet alpha granules; therefore, we further analyzed one of them (GO:0031091) (Figure 4b), along with Collagen-Containing Extracellular Matrix (GO:0062023) (Figure 4c). Their combined expression mean values were the highest in the control-ponatinib group compared to all other groups. Significantly, the downregulations of these GO components in the DKO-ponatinib group suggest reduced thrombogenesis and extracellular matrix remodeling, both severe adverse effects of ponatinib-induced CTX. For all subsequent pathway analyses performed on the five major cell types, only those reaching global significance (p-values computed using the Benjamini-Hochberg method for correction for multiple hypotheses testing <0.05) were highlighted in the relevant Supplementary Tables (Supplementary Tables S4, S10, S16) and were further explored and discussed for their biological significance. For the pathways with p-values computed from FET reaching significance but not reaching global significance, the data presented in the Supplementary Tables and described below should be regarded as preliminary.
We next explored the cell type distributions of the 14 DEGs involved in the two globally significant GO enriched terms described above (Figure 4b,c). Although these DEGs were identified in cardiomyocyte clusters, few were enriched in cardiomyocytes (Figure 4d), some were enriched in one of the non-cardiomyocyte cell types such as fibroblasts, SM. or macrophages (Figure 4e), some were enriched in multiple non-cardiomyocyte cell types (Figure 4f). These observations indicate that ponatinib treatment induces the expression of non-cardiomyocyte-enriched genes in cardiomyocytes.
To further explore the composition of the cardiomyocyte cluster, we reviewed Loupe Browser Mito25 Cutoff data set containing 42 clusters in Graph-Based Clustering mode. UMAP highlighting the cardiomyocyte cluster from the aggregation of four samples contains seven distinct subclusters (numbered CM1-7) (Figure 5a). Importantly, while cardiomyocyte enriched DEG (Angpt1) and marker Myh7 were presented across all seven subclusters (Figure 5b), non-cardiomyocyte enriched DEGs showed remarkable enrichments in CM4 and CM5 subclusters (Figure 5c). Additionally, the subcluster CM4 showed highest expression of DEGs pertinent to thrombogenesis, and the subcluster CM5 showed highest expression of DEGs pertinent to extracellular matrix remodeling, respectively (Figure 5d). Strikingly, we found that ponatinib treatment changed the relative nuclei distribution of these seven subclusters in the control groups with increased distributions for CM1, CM4, CM5, and CM7, and decreased distributions for CM2, CM3, and CM6 subclusters (Figure 5e). Of note, the subcluster CM4 with the highest expression of DEGs pertinent to thrombogenesis was considerably down-regulated in DKO-ponatinib group (9.86% of its cardiomyocyte nuclei) compared to the control-ponatinib group (14.03% of its cardiomyocyte nuclei) (Figure 5e). Together, these results indicate that double ROCK deletion in cardiomyocytes reduces not only ponatinib-induced gene expressions related to extra-cellular matrix remodeling and thrombogenesis, but also the subclusters highly expressing these genes.
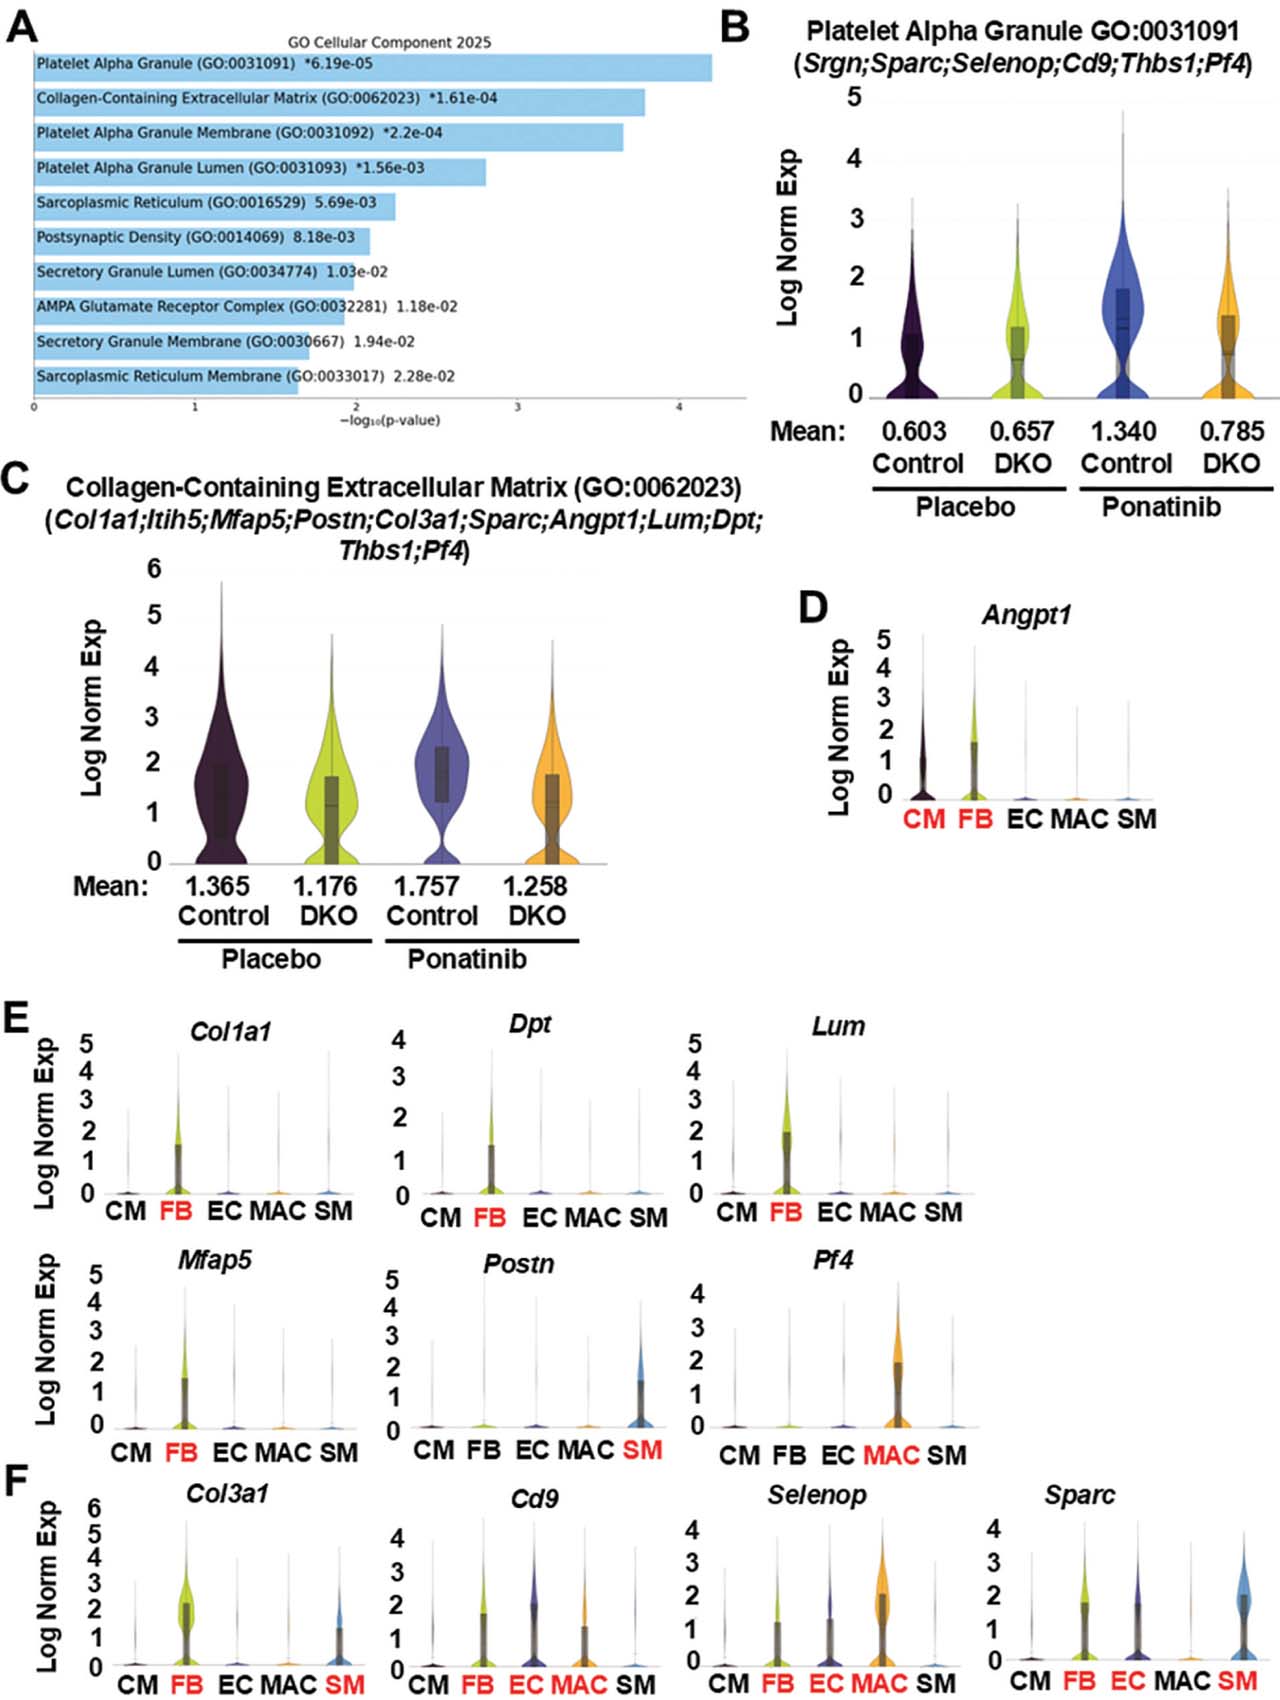
Fig 4.
Reduced extracellular matrix and blood coagulation-related gene expressions in ponatinib-treated DKO cardiomyocyte clusters. (A) Top 10 enriched terms (p-values are listed in Supplementary Table S4) by GO Cellular Component analysis of 151 DEGs generated by Loupe Browser (p < 0.05; p-values are adjusted using the Benjamini–Hochberg correction for multiple test; p-values are listed in Supplementary Table S1) that were downregulated in the cardiomyocyte cluster of DKO-ponatinib vs. control-ponatinib groups. GO enrichment analyses were conducted using FET with false discovery rate control by the Benjamini-Hochberg method (p-values are listed in Supplementary Table S4). (B,C) Violin plots visualizing the distribution of gene expression levels of two enriched terms with global significance in four groups of cardiomyocyte clusters. (D–F) Violin plots showing, among five major cell types, the distribution of the DEGs identified by pathway analyses. Although these DEGs were identified in cardiomyocytes by pathway analyses, few were enriched in cardiomyocytes (CM) (D), some were enriched in fibroblasts (FB), SM, or macrophage (MAC) (E), some were enriched in multiple cell types (F). DEGs, differentially expressed genes; DKO, inducible cardiomyocyte-specific ROCK1 and ROCK2 double knockout; EC, endothelial cells; FET, fisher exact test; GO, gene ontology; ROCK, Rho-associated coiled-coil containing kinase; SM, smooth muscle cell.
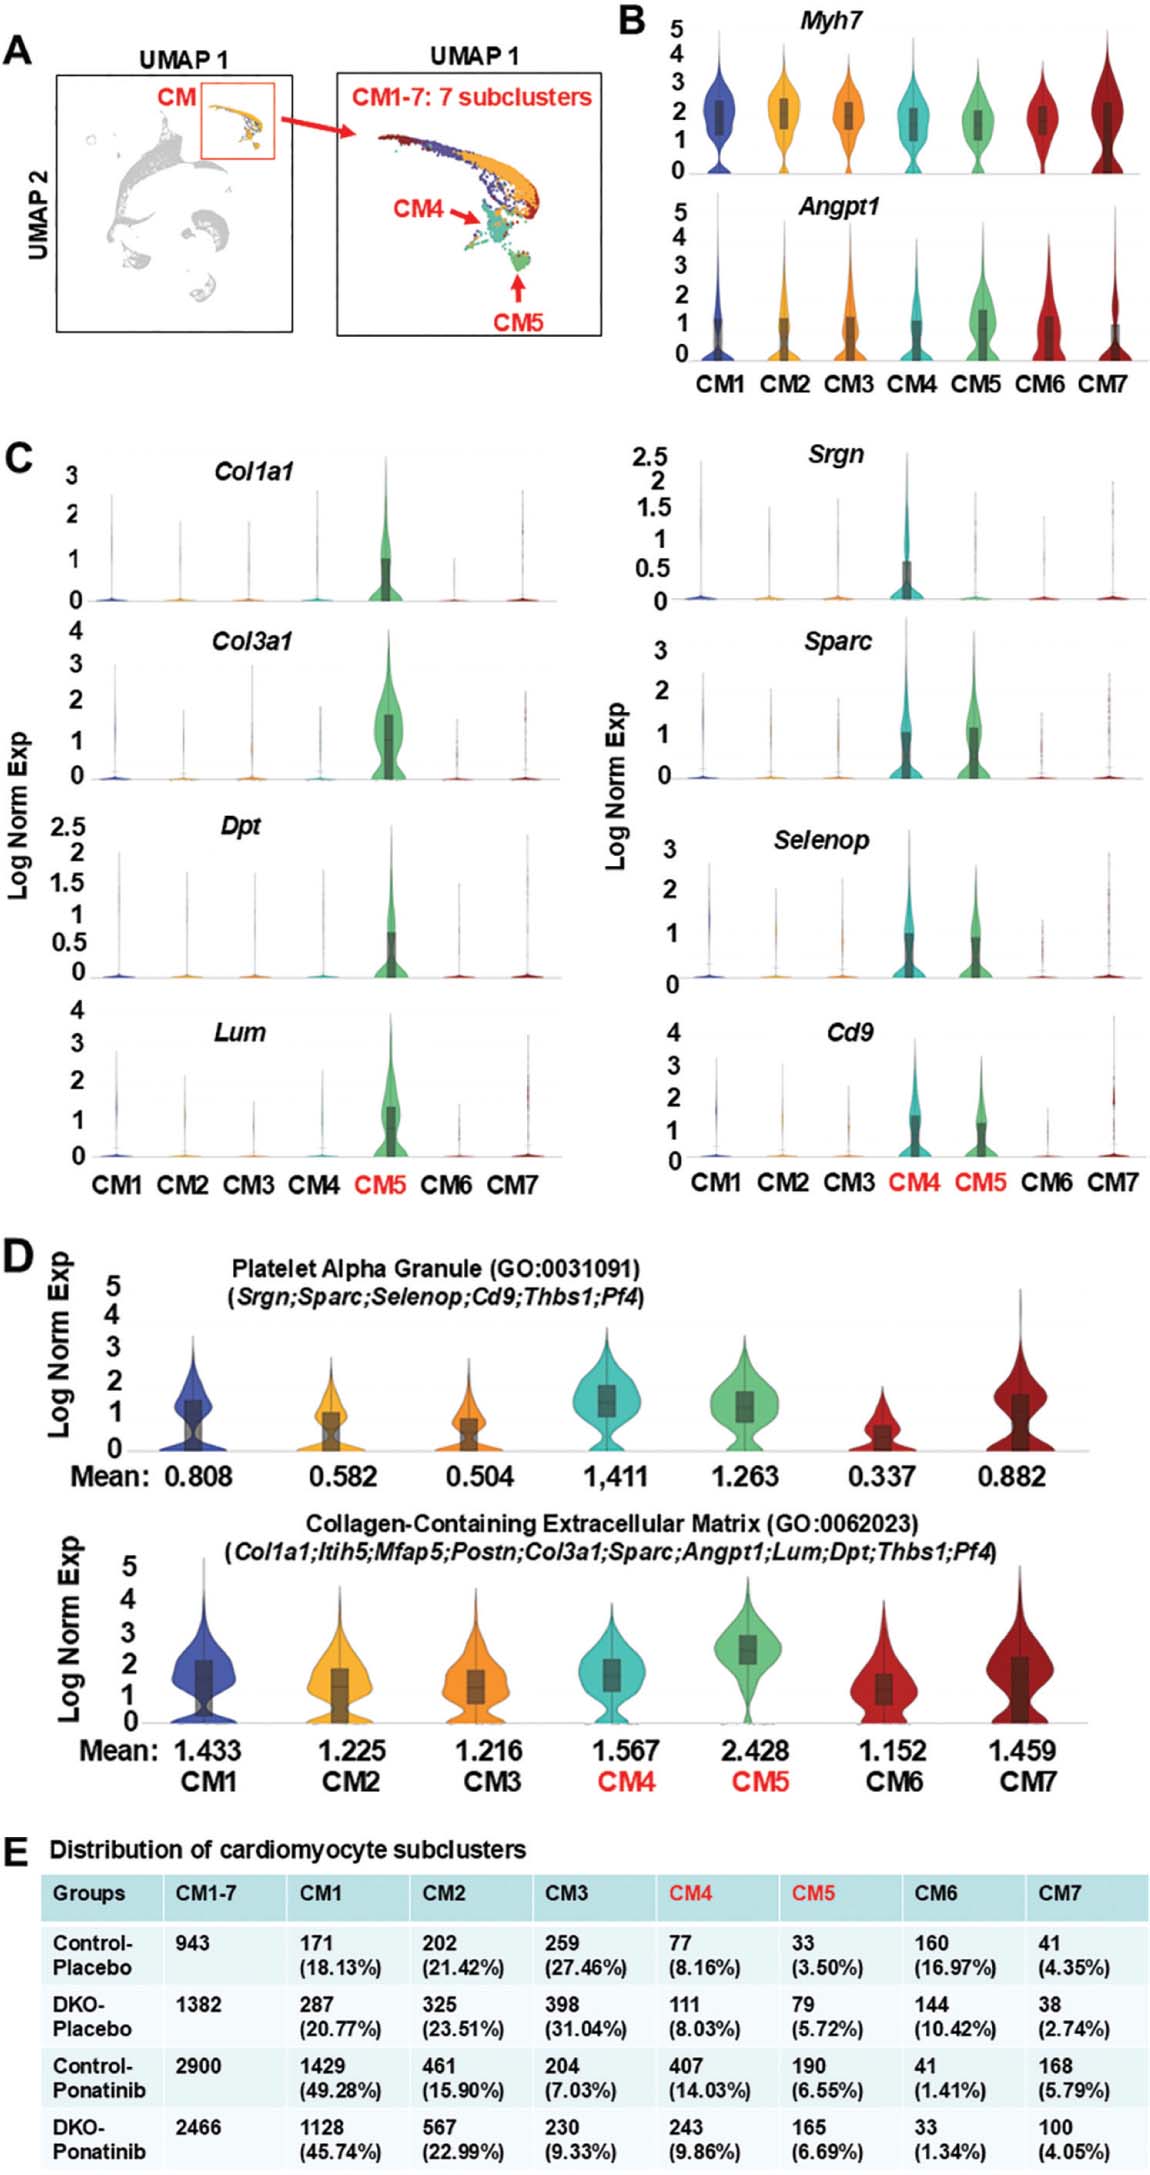
Fig 5.
Enrichment of ponatinib-induced extracellular matrix and blood coagulation related gene expressions in individual cardiomyocyte sub-clusters. (A) UMAP highlighting the cardiomyocyte cluster from the aggregation of 4 samples containing 7 distinct subclusters. (B, C) Violin plots showing, among 7 subclusters, the distribution of downregulated DEGs identified by pathway analyses of cardiomyocyte clusters from DKO-ponatinib group. cardiomyocyte enriched DEGs (Angpt1) and cardiomyocyte marker Myh7 were presented across all 7 subclusters (B). CM5 expressed the highest levels of fibroblast-related DEGs (e.g. Col1a1, Col3a1, Dpt, Lum), both CM4 and CM5 expressed the highest levels of endothelial cell- and macrophage-related DEGs (e.g. Srgn, Sparc, Selenop, Cd9) (C). (D) Violin plots visualizing the distribution of gene expression levels of two enriched GO terms (illustrated in Figure 4b,c) among 7 subclusters and showing their remarkable enrichment in CM4 and CM5. (E) Relative nuclei distribution of seven subclusters in each of the four samples. The numbers and ratios of nuclei in each subcluster of each sample were listed. CM4 was reduced in the DKO-ponatinib vs. control-ponatinib groups. DEGs, differentially expressed genes; DKO, inducible cardiomyocyte-specific ROCK1 and ROCK2 double knockout; GO, gene ontology; ROCK, Rho-associated coiled-coil containing kinase; UMAP, uniform manifold approximation and projection.
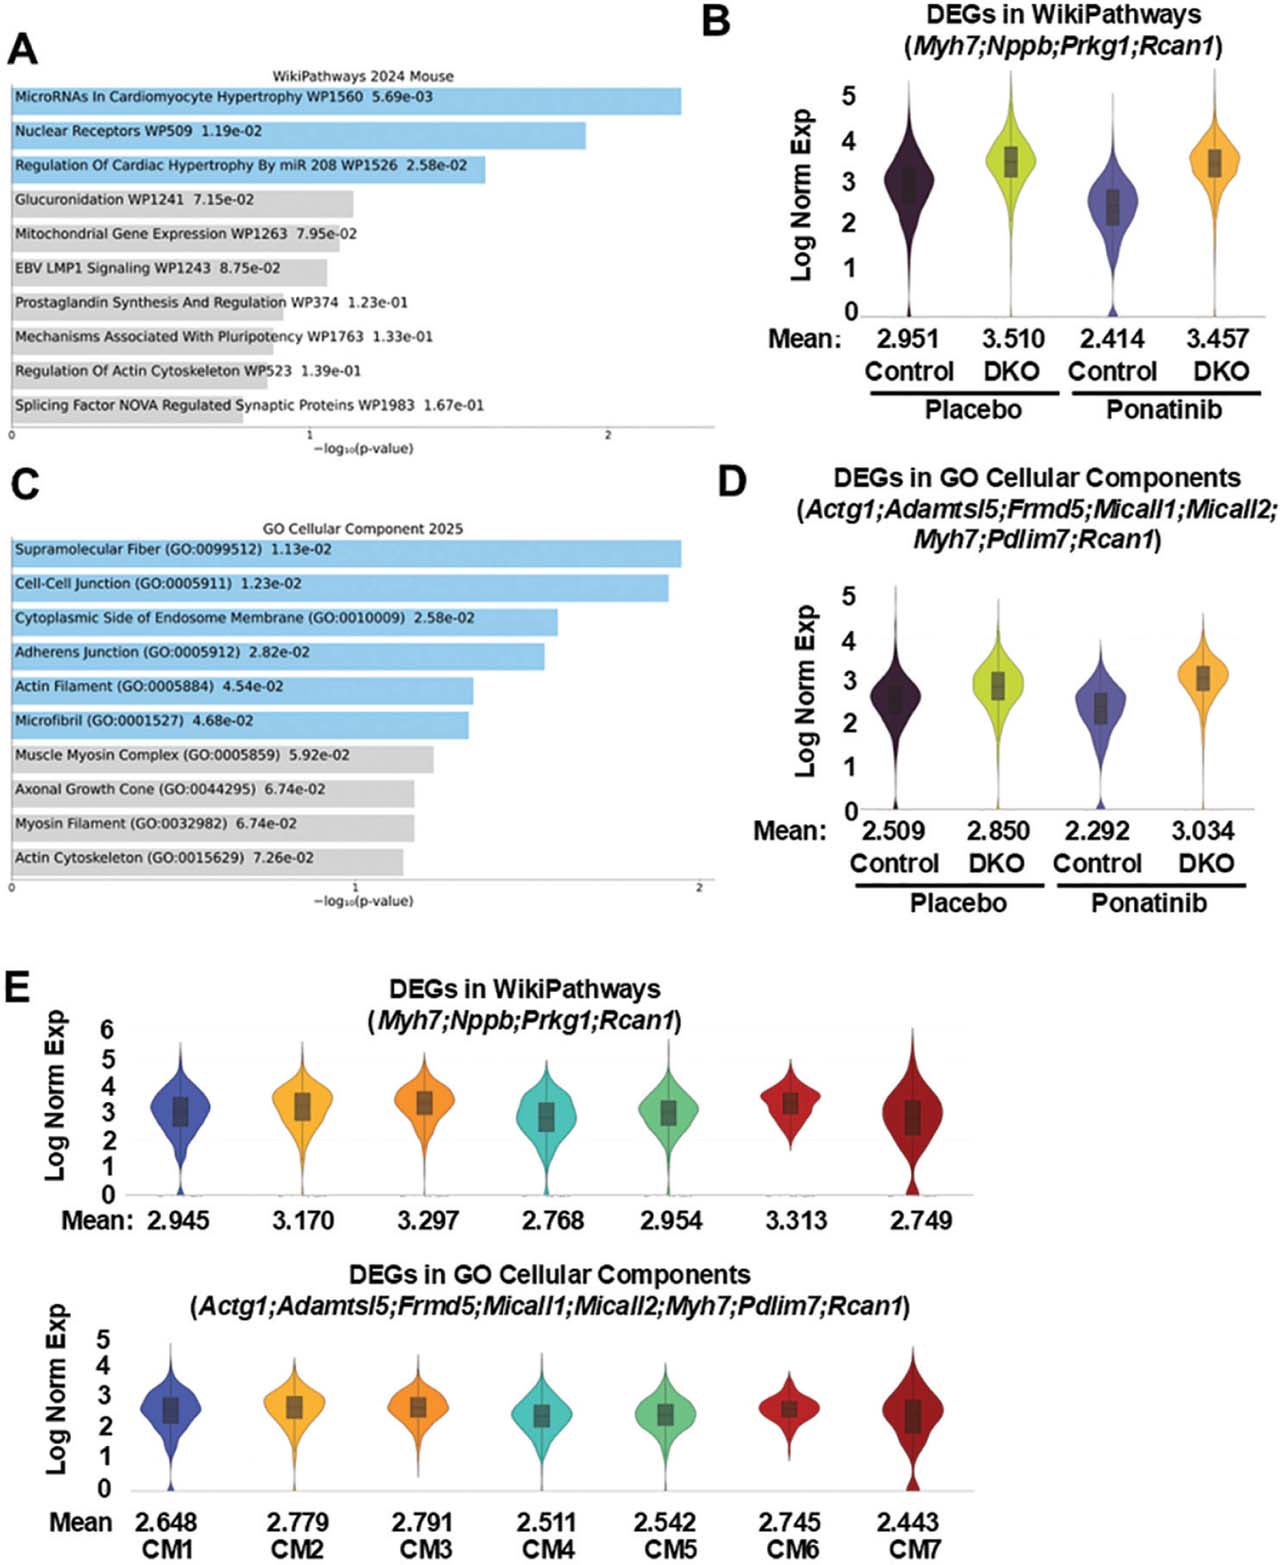
Fig 6.
Increased cardiomyocyte hypertrophy and cytoskeleton-related gene expression in ponatinib-treated DKO cardiomyocyte clusters. (A) Top 10 pathways by WikiPathways analysis of 87 DEGs were generated by Loupe Browser (p < 0.05; p-values are adjusted using the Benjamini–Hochberg correction for multiple test; p-values are listed in Supplementary Table S2) that were upregulated in the cardiomyocyte cluster of DKO-ponatinib vs. control-ponatinib groups. Pathway enrichment analyses were conducted using FET with false discovery rate control by the Benjamini-Hochberg method (p-values are listed in Supplementary Table S5). (B) Violin plots visualizing the distribution of DEGs related to cardiomyocyte hypertrophy in four groups of cardiomyocyte clusters. (C) Top 10 enriched terms (p-values are listed in Supplementary Table S6) by GO Cellular Component analysis of 87 upregulated DEGs (p < 0.05). (D) Violin plots visualizing the distribution of DEGs related to cardiomyocyte cytoskeleton in four groups of cardiomyocyte clusters. (E) Violin plots showing the distribution of DEGs related to cardiomyocyte hypertrophy and cytoskeleton among seven subclusters. DEGs, differentially expressed genes; DKO, inducible cardiomyocyte-specific ROCK1 and ROCK2 double knockout; GO, gene ontology; ROCK, Rho-associated coiled-coil containing kinase.
3.5. Differential gene expressions and pathway analyses of cardiomyocyte clusters revealed increased cardiomyocyte hypertrophy and cytoskeleton-related gene expressions in ponatinib-treated DKO cardiomyocytes
Pathway analysis was performed on 87 DEGs upregulated in DKO-ponatinib cardiomyocyte cluster, and comparison was made with control-ponatinib. The outcome returned 29 enriched WikiPathways and 61 enriched GO terms. Among the top 10 WikiPathways, only three showed p-values computed from FET reaching significance (Figure 6a and Supplementary Table S5) with four DEGs related to cardiomyocyte hypertrophy (Figure 6b). The upregulation of the Nuclear Receptors WP509 (Ror1, Esr1) could be related to the expression of MCM in DKO cardiomyocytes, so not included in following analysis. We examined the combined expression of the four DEGs related to cardiomyocyte hypertrophy, the values were higher in the DKO group vs. control with or without ponatinib treatment (Figure 6b), in addition, they were highly expressed across seven cardiomyocyte subclusters (Figure 6e). Among the top 10 GO-enriched terms, six showed p-values computed from FET reaching significance (Figure 6c and Supplementary Table S6), with eight DEGs related to cytoskeleton (Figure 6d). Their combined expression values were higher in the DKO group vs. control group with or without ponatinib treatment (Figure 6d), in addition, they were highly expressed across seven cardiomyocyte subclusters (Figure 6e).
Although these enriched terms (Figure 6a,c) didn’t reach global significance, their collective enrichment in the DKO cardiomyocytes at baseline and after ponatinib treatment could suggest that double ROCK deletion in cardiomyocytes may induce a compensatory response with enhanced expression of both sarcomeric and non-sarcomeric cytoskeleton-related genes. Of note, no significant cardiac hypertrophy was observed in the DKO mice under baseline condition and at advanced age (Shi et al. 2019) or under ponatinib treatment in the present study, suggesting that the enhanced expression of both sarcomeric and non-sarcomeric cytoskeleton-related genes in DKO cardiomyocytes don’t result in pathological cardiac hypertrophy; in contrast, they may help to preserve sarcomeric and non-sarcomeric cytoskeleton stability under stressed conditions.
3.6. Differential gene expressions and pathway analyses of fibroblast clusters revealed reduced expression of genes associated with the extracellular matrix, basement membrane, and blood coagulation pathways, as well as a decrease in myofibroblast subcluster abundance in ponatinib-treated DKO fibroblasts
Besides the cardiomyocytes where double ROCK deletion was accomplished by cardiomyocyte-specific inducible Cre recombinase, other four major cell types (fibroblasts, EC, macrophages and SM) were included in our investigation; it is worth mentioning that both ROCK1 and ROCK2 remain and function in these cell types. Fibroblasts, EC and macrophages can interact with cardiomyocytes through both direct cell-to-cell coupling and indirect paracrine signaling. Although SM do not directly connect to cardiomyocytes, they are in proximity to each other, such as in the walls of the heart’s blood vessels.
We started with analysis of fibroblast clusters focused on the DEGs between control-ponatinib (4554 nuclei) and DKO-ponatinib groups (3879 nuclei). Differential expression testing revealed a total of 59 DEGs downregulated (Supplementary Table S7) and 17 DEGs upregulated (Supplementary Table S8) in DKO-ponatinib fibroblasts. Pathway analyses based on the 59 downregulated DEGs returned 18 enriched WikiPathways and 64 enriched GO terms. Among the top 10 WikiPathways, none of them showed p-values computed from FET reaching significance (Supplementary Tables S9); therefore, they were not further analyzed. Among the top 10 GO enriched terms, all terms showed FET reaching significance with p-values <0.05, five of them reached global significance with adjusted p-values <0.05 (Figure 7a and Supplementary Table S10). We then analyzed three of these five globally significant terms, which were associated with extracellular matrix (Figure 7b), basement membrane (Figure 7c) and blood coagulation, respectively (Figure 7d). Their combined expression mean values were the highest in the control-ponatinib group vs. all other groups (Figure 7b–d). Like the cardiomyocyte clusters, the downregulations of these GO-enriched terms in the DKO-ponatinib fibroblast clusters suggest the reduced thrombogenesis and extracellular matrix remodeling.
We next explored the composition of the fibroblast subclusters. UMAP emphasized the fibroblast cluster from the aggregation of four samples; there were seven distinct subclusters (numbered FB1-7) all expressing similar levels of fibroblast markers Col1a1 and Col3a1 (Figure 7e). We analyzed the subcluster distributions of the 11 DEGs involved in the 3 globally significant enriched GO terms (Figure 7b–d). Violin plots were used to illustrate the distribution of gene expression levels of seven fibroblast subclusters. The plots showed enrichment of Postn, a marker of myofibroblasts, in FB5 subcluster, as well as some other DEGs (Figure 7f). In addition, among the seven FB sub-clusters, three GO-enriched terms showed remarkable enrichment in FB5 subcluster (Figure 7g). Strikingly, the relative nuclei distribution of FB5 subcluster was reduced in the DKO-ponatinib group (2.29% of its total fibroblasts) vs. control-ponatinib group (7.00% of its total fibroblasts) (Figure 7h), indicating a reduced frequency of myofibroblast/activated fibroblast subcluster in the DKO-ponatinib group. Noteworthy, we found that ponatinib treatment increased the relative nuclei distribution of subclusters FB5, FB6, and FB7 (Figure 7h), and three enriched GO terms typified the highest expressions in these subclusters (Figure 7g). Briefly, their combined distribution increased from 13.02% in the control-placebo group to 16.93% in the control-ponatinib group, while the combined distribution was less (11.52%) in the DKO-ponatinib group. These results suggest that ROCK1 and ROCK2 deficient cardiomyocytes bearing the prospect of reducing abundance of the myofibroblasts/activated fibroblasts would provide a beneficial microenvironment where cardiac fibroblasts were able to lessen their activation while facing stress.
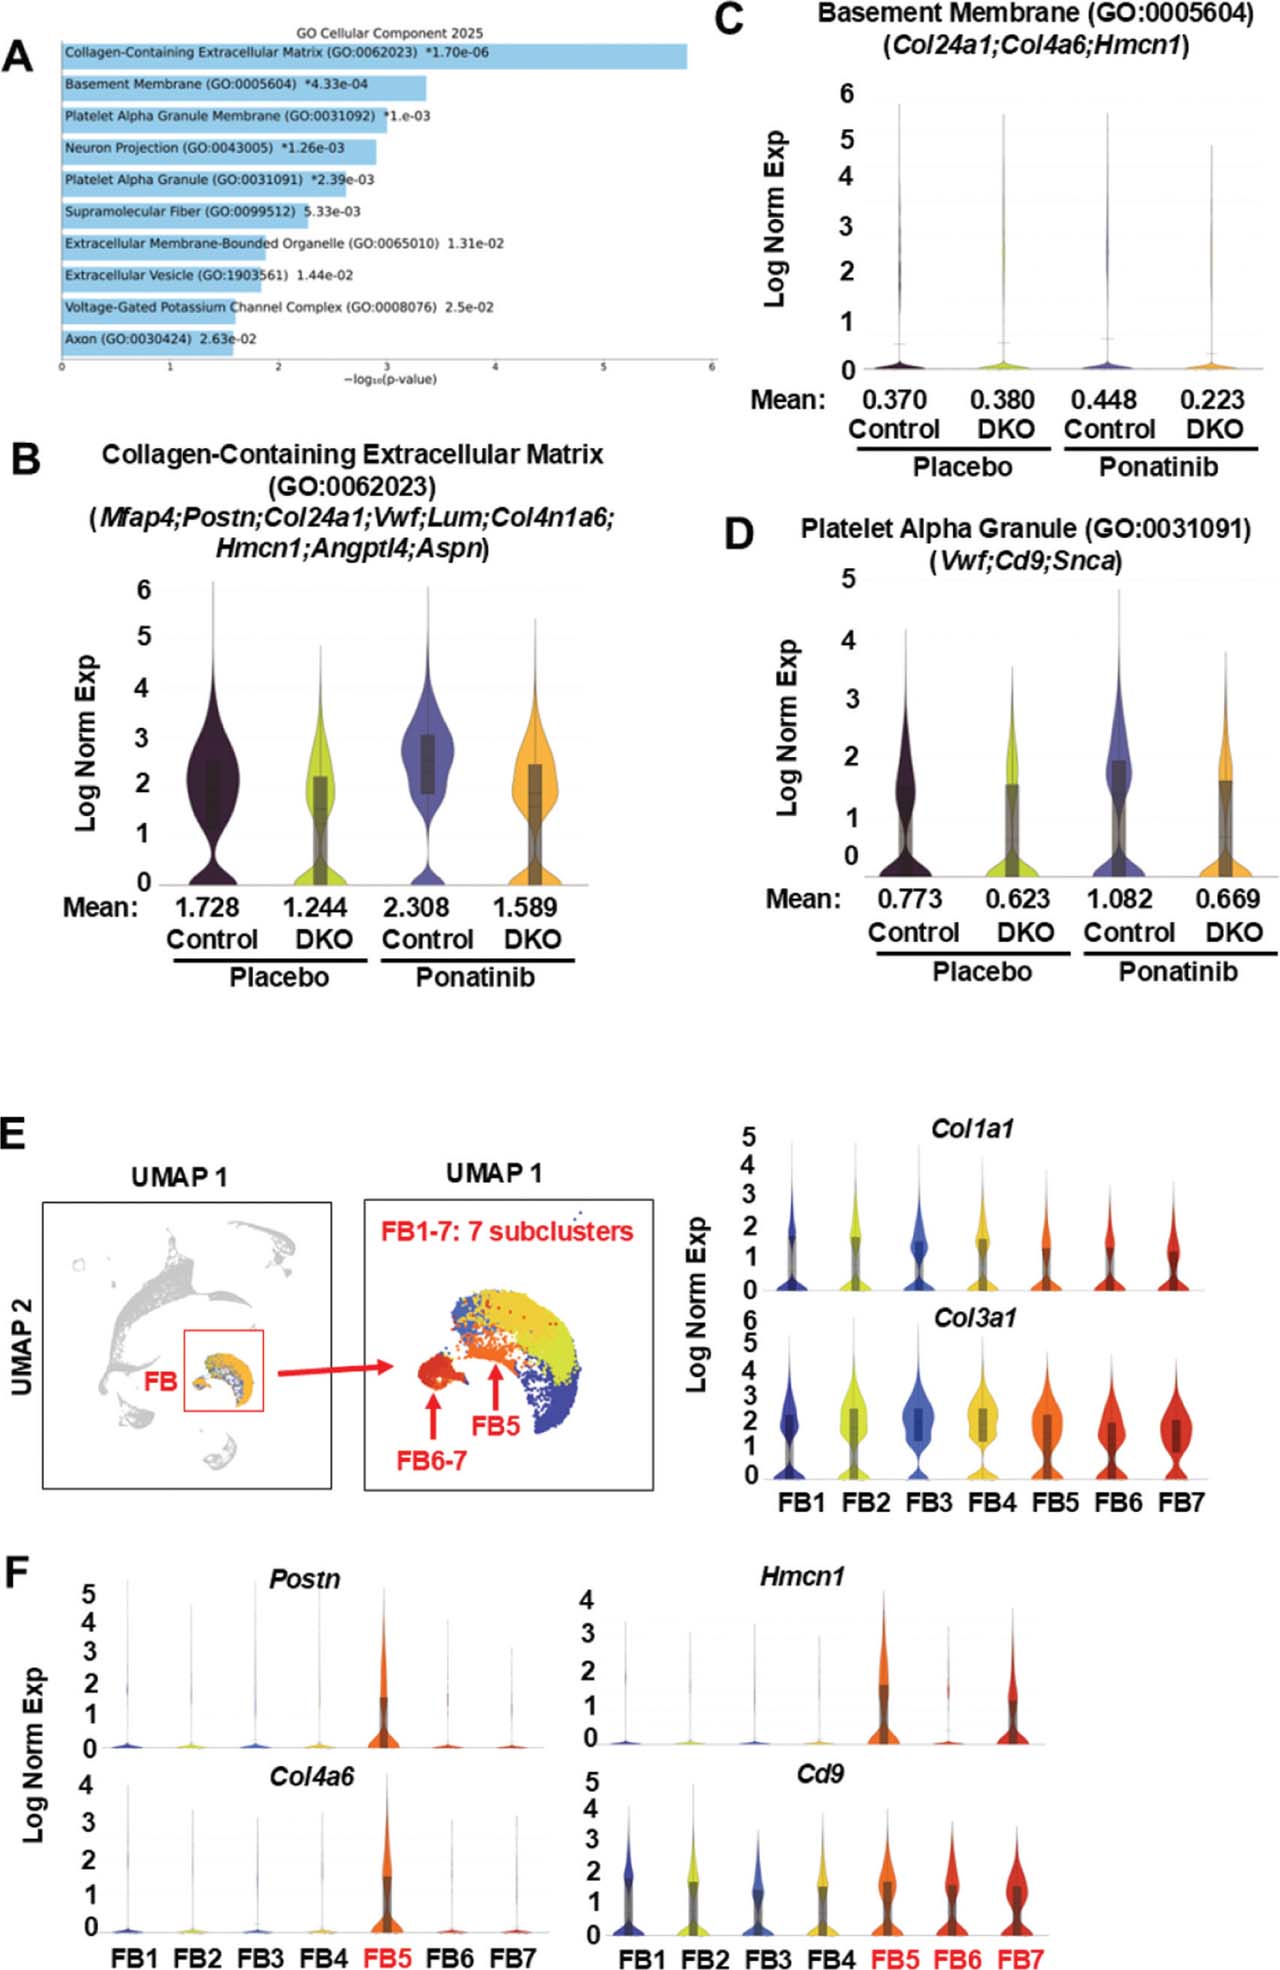
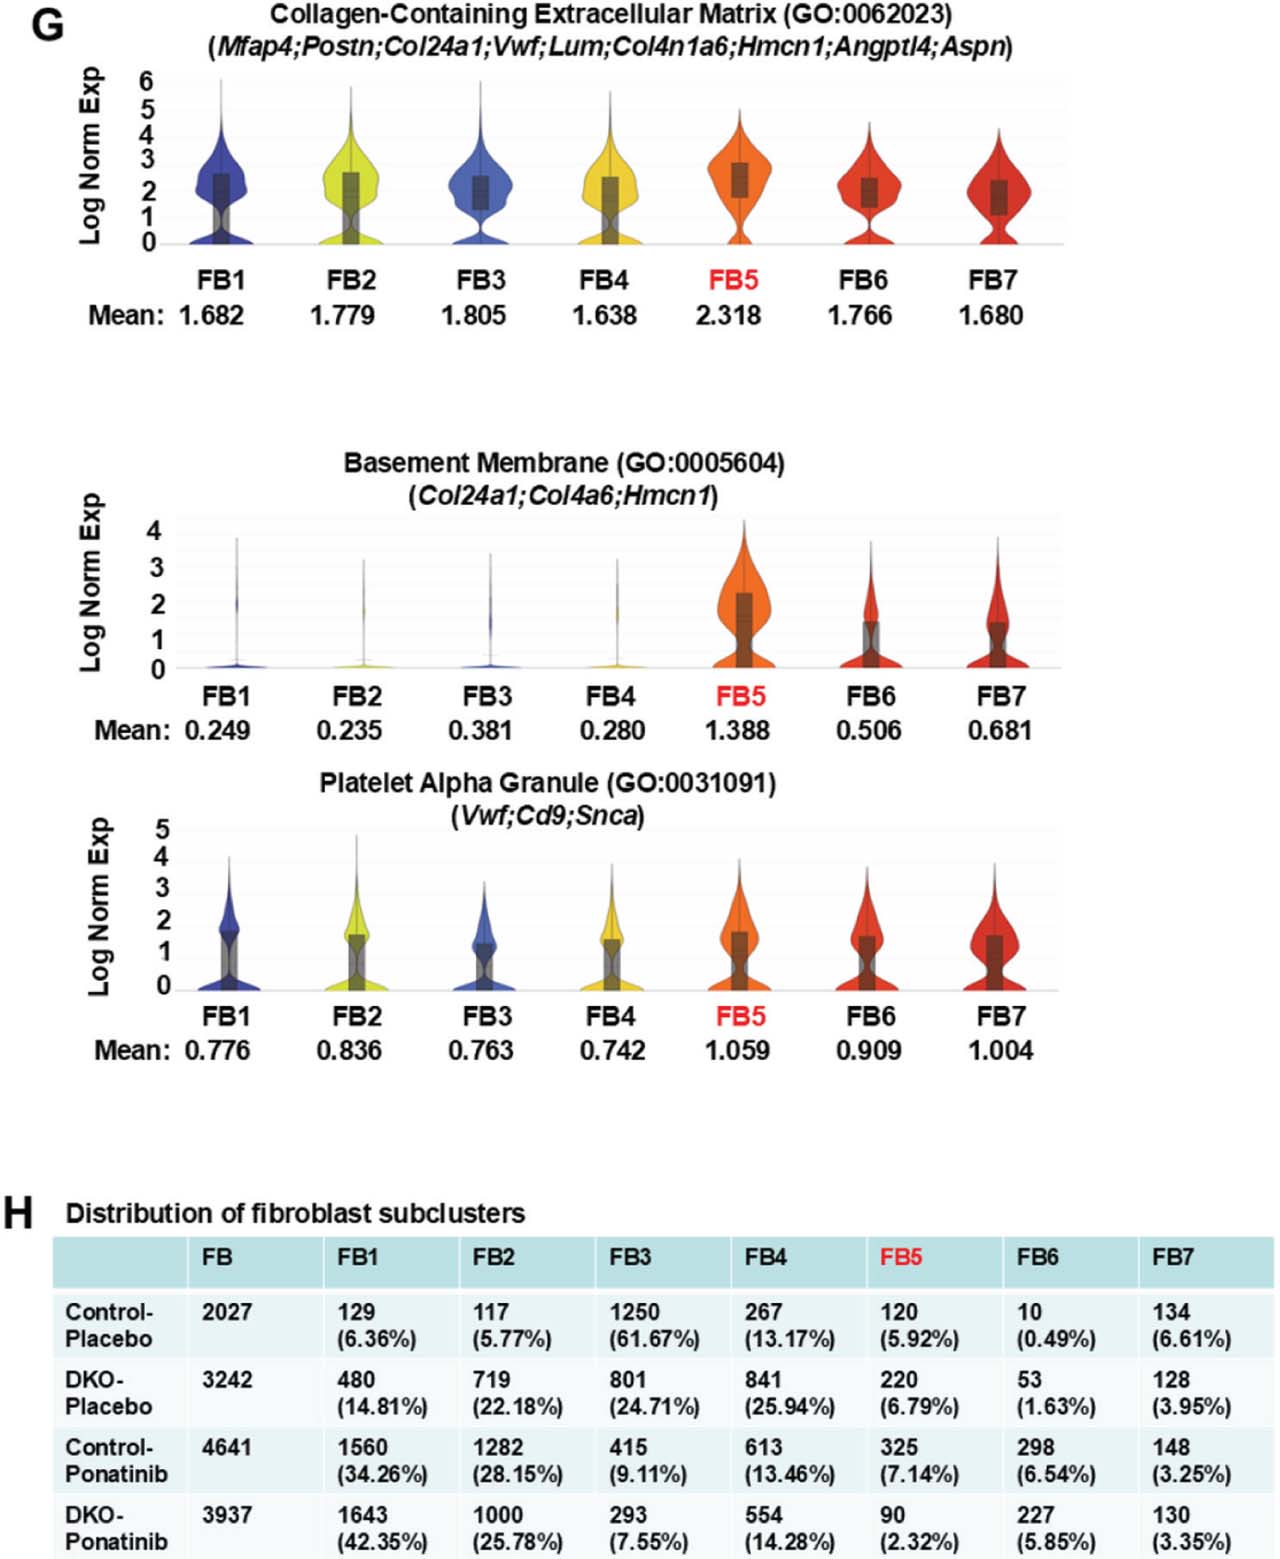
Fig 7.
Reduced extracellular matrix, basement membrane, blood coagulation and myofibroblast activation-related gene expressions in ponatinib-treated DKO fibroblast clusters. (A) Top 10 enriched terms by GO Cellular Component analysis of 59 DEGs generated by Loupe Browser (p < 0.05; p-values are adjusted using the Benjamini-Hochberg correction for multiple test; p-values are listed in Supplementary Table S7) that were downregulated in fibroblast clusters of DKO-ponatinib vs. control-ponatinib groups. GO Cellular Component analysis was conducted using FET with false discovery rate control by the Benjamini–Hochberg method (p-values are listed in Supplementary Table S10). (B–D) Violin plots visualizing the distribution of gene expression levels of three enriched terms with global significance in four groups of fibroblast clusters. (E) UMAP highlighting the fibroblast cluster from the aggregation of four samples containing seven distinct subclusters (numbered FB1-7). Fibroblast markers, Col1a1 and Col3a1, are expressed across all seven subclusters. (F) Violin plots showing, among seven subclusters, enrichment of Postn, a marker of myofibroblast, in FB5. In addition, some DEGs (e.g., Col4a6, Hmcn1, Cd9) were enriched in FB5, FB6, and FB7. (G) Violin plots visualizing the distribution of gene expression levels of three enriched GO terms among seven subclusters and showing their remarkable enrichment in FB5. (H) Relative nuclei distribution of seven subclusters in each sample. The numbers and ratios of nuclei in each subcluster of each sample were listed. FB5 was reduced in the DKO-ponatinib vs. control-ponatinib groups. DEGs, differentially expressed genes; DKO, inducible cardiomyocyte-specific ROCK1 and ROCK2 double knockout; FET, Fisher exact test; GO, gene ontology; ROCK, Rho-associated coiled-coil containing kinase; UMAP, uniform manifold approximation and projection.
Moreover, pathway analyses on 17 DEGs upregulated in DKO-ponatinib fibroblasts cluster returned seven enriched WikiPathways and 16 enriched GO terms. Three WikiPathways and 6 GO enriched terms showed p-values computed from FET <0.05 (Supplementary Tables S11 and S12) with five-related DEGs (Acta2, Esr1, Myh7, Nr4a3, Slc15a2). Three DEGs, Acta2, Esr1, and Myh7 were also enriched in DKO cardiomyocyte, the finding suggested that ambient RNA contamination could exist. Ambient RNA contamination in heart tissue snRNA-seq is caused by more abundant gene expressions in cardiomyocyte and cardiomyocytes marker bleeding (e.g. Acta2, Myh7) into non-cardiomyocyte clusters. Abundant Esr1 expressions are attributable to MCM in DKO group. Therefore, cardiomyocytes-enriched DEGs identified in non-cardiomyocyte clusters (e.g. fibroblasts, EC, SM, microphages) were not further analyzed in these non-cardiomyocyte clusters. Both Nr4a3 and Slc15a2 were expressed at low levels across the 5 major cell types; however, the relevance of their upregulation in DKO fibroblasts was unclear.
3.7. Differential gene expressions and pathway analyses of EC clusters revealed reduced extracellular matrix and cell proliferation associated gene expressions, and reduced abundance of activated EC subclusters in ponatinib-treated DKO endothelial population
We started the analysis of EC clusters with a focus on DEGs between control-ponatinib (7632 nuclei) and DKO-ponatinib groups (5329 nuclei). Differential expression testing revealed a total of 130 DEGs downregulated (Supplementary Table S13) and 22 DEGs upregulated (Supplementary Table S14) in DKO-ponatinib. Pathway analyses based on the 130 downregulated DEGs returned 34 enriched WikiPathways and 83 enriched GO terms. Among the top 10 WikiPathways, five showed p-values <0.05 (Supplementary Table S15). Because they did not reach global significance (adjusted p-values computed using the Benjamini–Hochberg method for correction for multiple hypotheses testing >0.05), further analyses were stopped. Among the GO enriched terms, top 14 reached global significance with their adjusted p-values <0.05 (Figure 8a and Supplementary Table S16), most of them are related to cell division and cytoskeleton reorganization in which ROCK-related cytoskeleton reorganization has established roles (Shi and Wei 2013; Wei et al. 2016). We subsequently analyzed three enriched terms which were representative of the 14 globally significant enriched terms (Figure 8b–d). The combined expression mean values for each enriched term were the highest in the control-ponatinib group compared to all other groups (Figure 8b–d). Upregulations of these enriched terms in ponatinib-treated control hearts are strong indicators of active proliferation and cell cycle engagement, and of endothelial-to-mesenchymal transition associated with a pathological endothelial phenotype. The downregulations of these GO-enriched terms in the DKO-ponatinib endothelial clusters suggest reduced pathological remodeling and activation of EC.
We later explored the composition of the EC subclusters. UMAP emphasized the endothelial cluster from the aggregation of four samples; there were nine distinct subclusters (numbered EC1-9) expressing high levels of EC marker Pecam1 (Figure 8e). We thus examined the subcluster distributions of the 37 DEGs involved in the three enriched GO terms (Figure 8b–d). Violin plots were used to illustrate the distribution of their gene expression levels among nine endothelial subclusters. The plots showed enrichment of cell proliferation related DEGs (e.g. Cdk1, Kif11, Top2a) in EC9 subcluster and extracellular matrix-related DEGs (e.g. Col4a4, Ctsh, Lum) in EC4 and EC5 (Figure 8f). In addition, the outcome from analyses of the three globally significant enriched GO terms showed that the enrichment was remarkable in EC9 for cell proliferation related components and in EC4 and EC5 for extracellular matrix-related components (Figure 8g). Strikingly, the relative nuclei distributions of EC4, EC5, and EC9 subclusters were reduced in the DKO-ponatinib group (5.92%, 5.69%, and 2.79% of its total EC) rather than that in control-ponatinib group (7.01%, 12.61%, and 6.73%, respectively) (Figure 8h), indicating reduced percentage of activated EC in the DKO-ponatinib group. Of note, the combined distribution of EC4, EC5, and EC9 increased from 14.64% in the control-placebo group to 26.35% in the control-ponatinib group, while this combined distribution was less (14.4%) in the DKO-ponatinib group. These results suggest that double ROCK deletion in cardiomyocytes reduces the abundance of the activated EC, and ROCK1 and ROCK2 deficient cardiomyocytes would provide a favorable microenvironment where cardiac EC were able to lessen their activation while facing stress.
Moreover, pathway analyses were performed on 22 DEGs upregulated in DKO-ponatinib endothelial cluster vs. control-ponatinib, the results returned 13 enriched WikiPathways and 22 enriched GO terms. Five WikiPathways and 5 GO enriched terms showed p-values computed from the FET <0.05 (Supplementary Tables S17 and S18) with four related DEGs (Esr1, Hspb1, Myh7, Uchl1). Two DEGs, Esr1 and Myh7, were also enriched in DKO cardiomyocytes, possibly was attributed to ambient RNA contamination. Increased Hspb1 and Uchl1 may play a protective role in inhibiting the endothelial-to-mesenchymal transition and inflammation.
3.8. Differential gene expressions and pathway analyses of macrophage and SM clusters
We were focused on the DEGs between control-ponatinib (1473 nuclei) and DKO-ponatinib groups (1050 nuclei). Differential expression testing revealed a total of 14 DEGs downregulated (Supplementary Table S19) and 16 DEGs upregulated (Supplementary Table S20) in DKO-ponatinib group. Pathway analysis based on 14 DEGs downregulated in DKO-ponatinib macrophage cluster returned 15 enriched WikiPathways and 25 enriched GO terms; none of them reached global significance (Supplementary Tables S21 and S22). Among the top 10, there were 6 WikiPathways and 4 GO enriched terms showed p-values computed from FET <0.05 (Supplementary Tables S21 and S22). Among 8 DEGs related to these enrichments (Ccr2, Cd207, Clec12a, Cytl1, Gpr155, Myl4, Pkib, Vwf), some were macrophage enriched genes, including Ccr2, Cd207, Clec12a, Gpr155, and Pkib, which have diverse functions, primarily in the immune system, cell signaling, and disease development. Their collective downregulations in DKO-ponatinib macrophage cluster suggest the reduction of immune responses and inflammation compared to the control-ponatinib group. Moreover, the macrophage cluster contains two subclusters, but there is no detectable difference in the composition of the subclusters between the two groups.
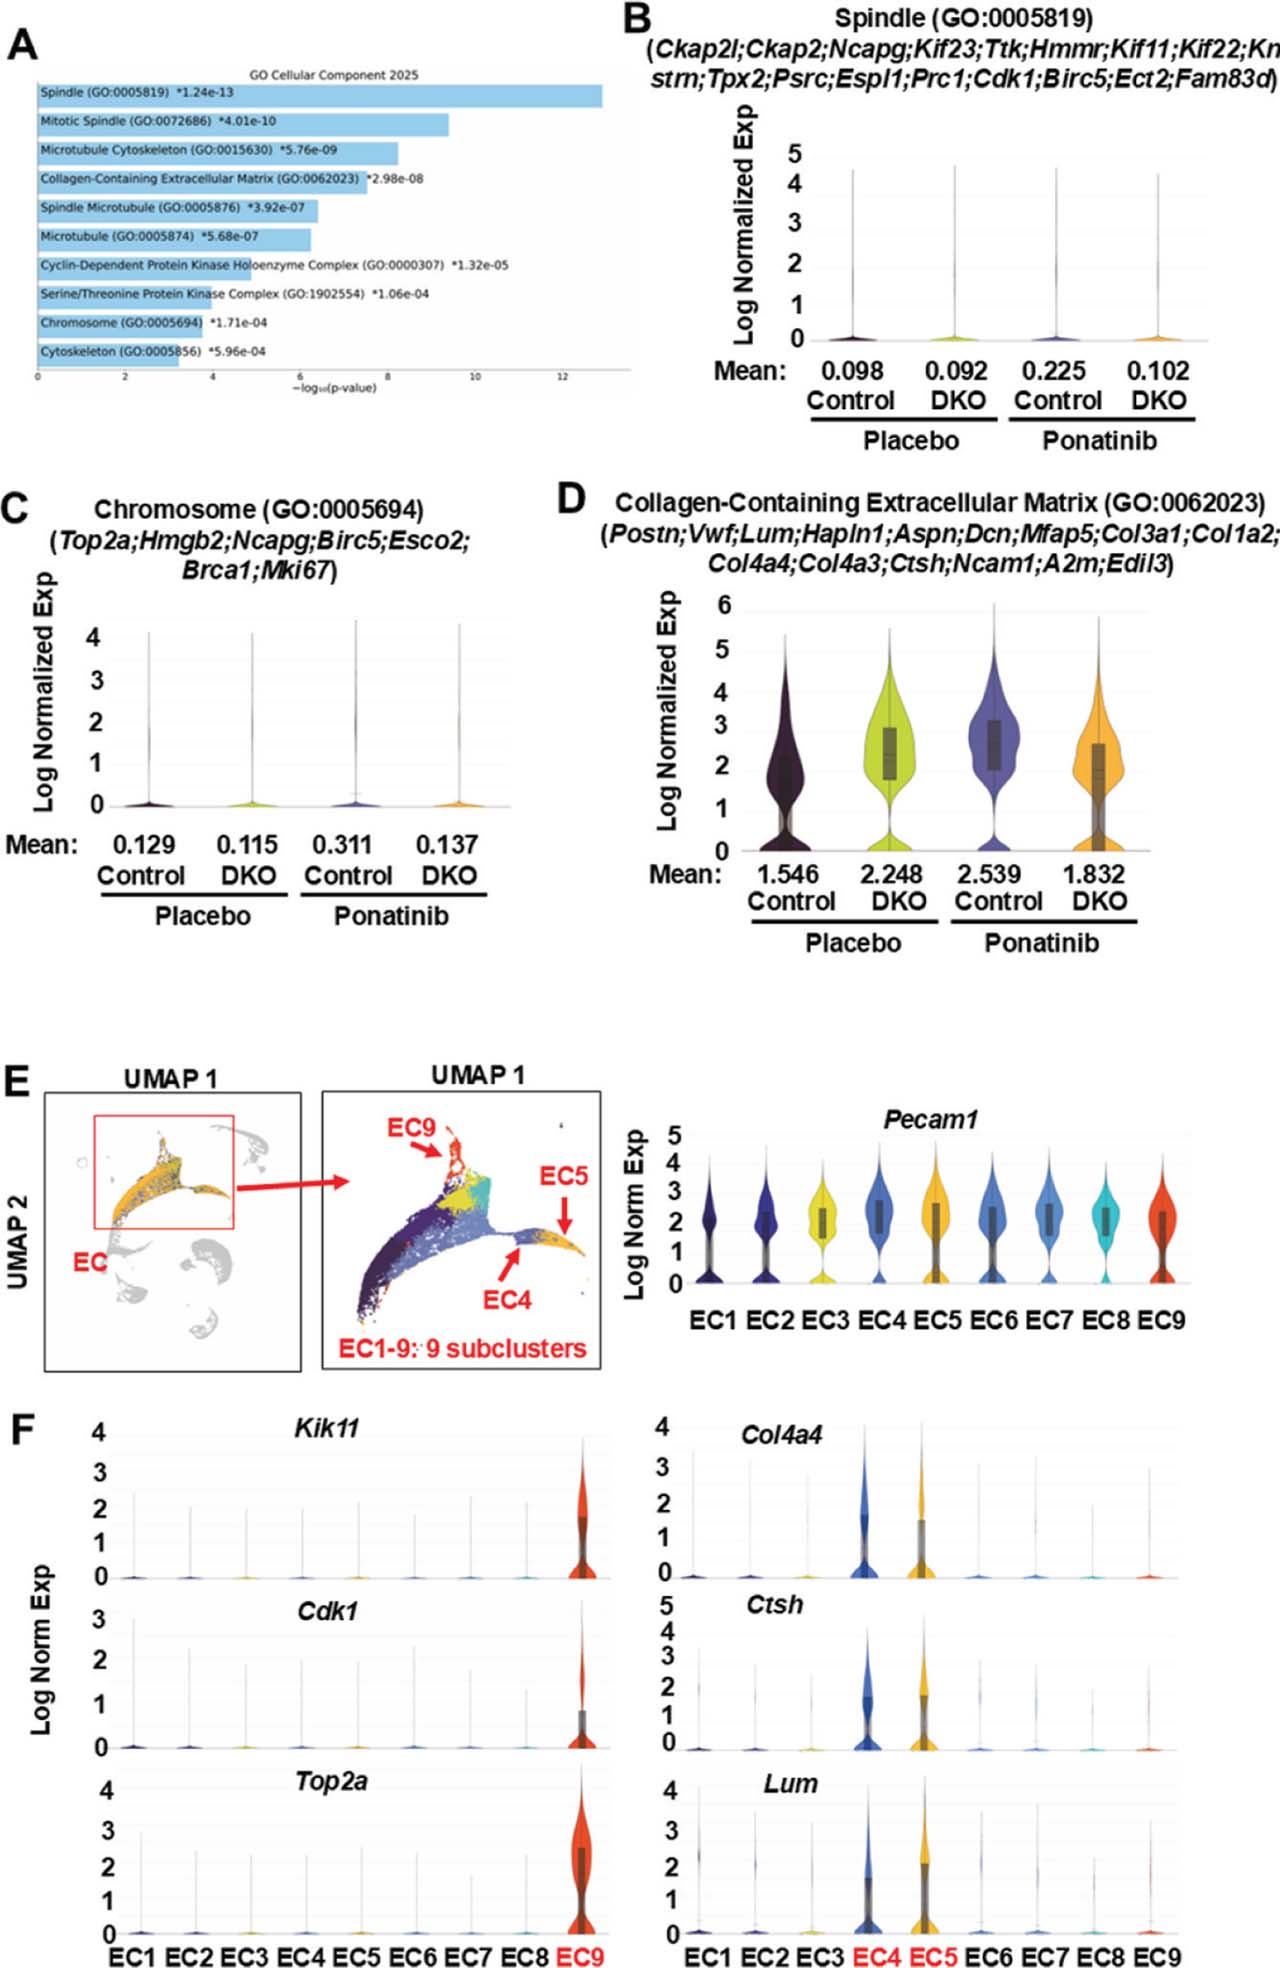
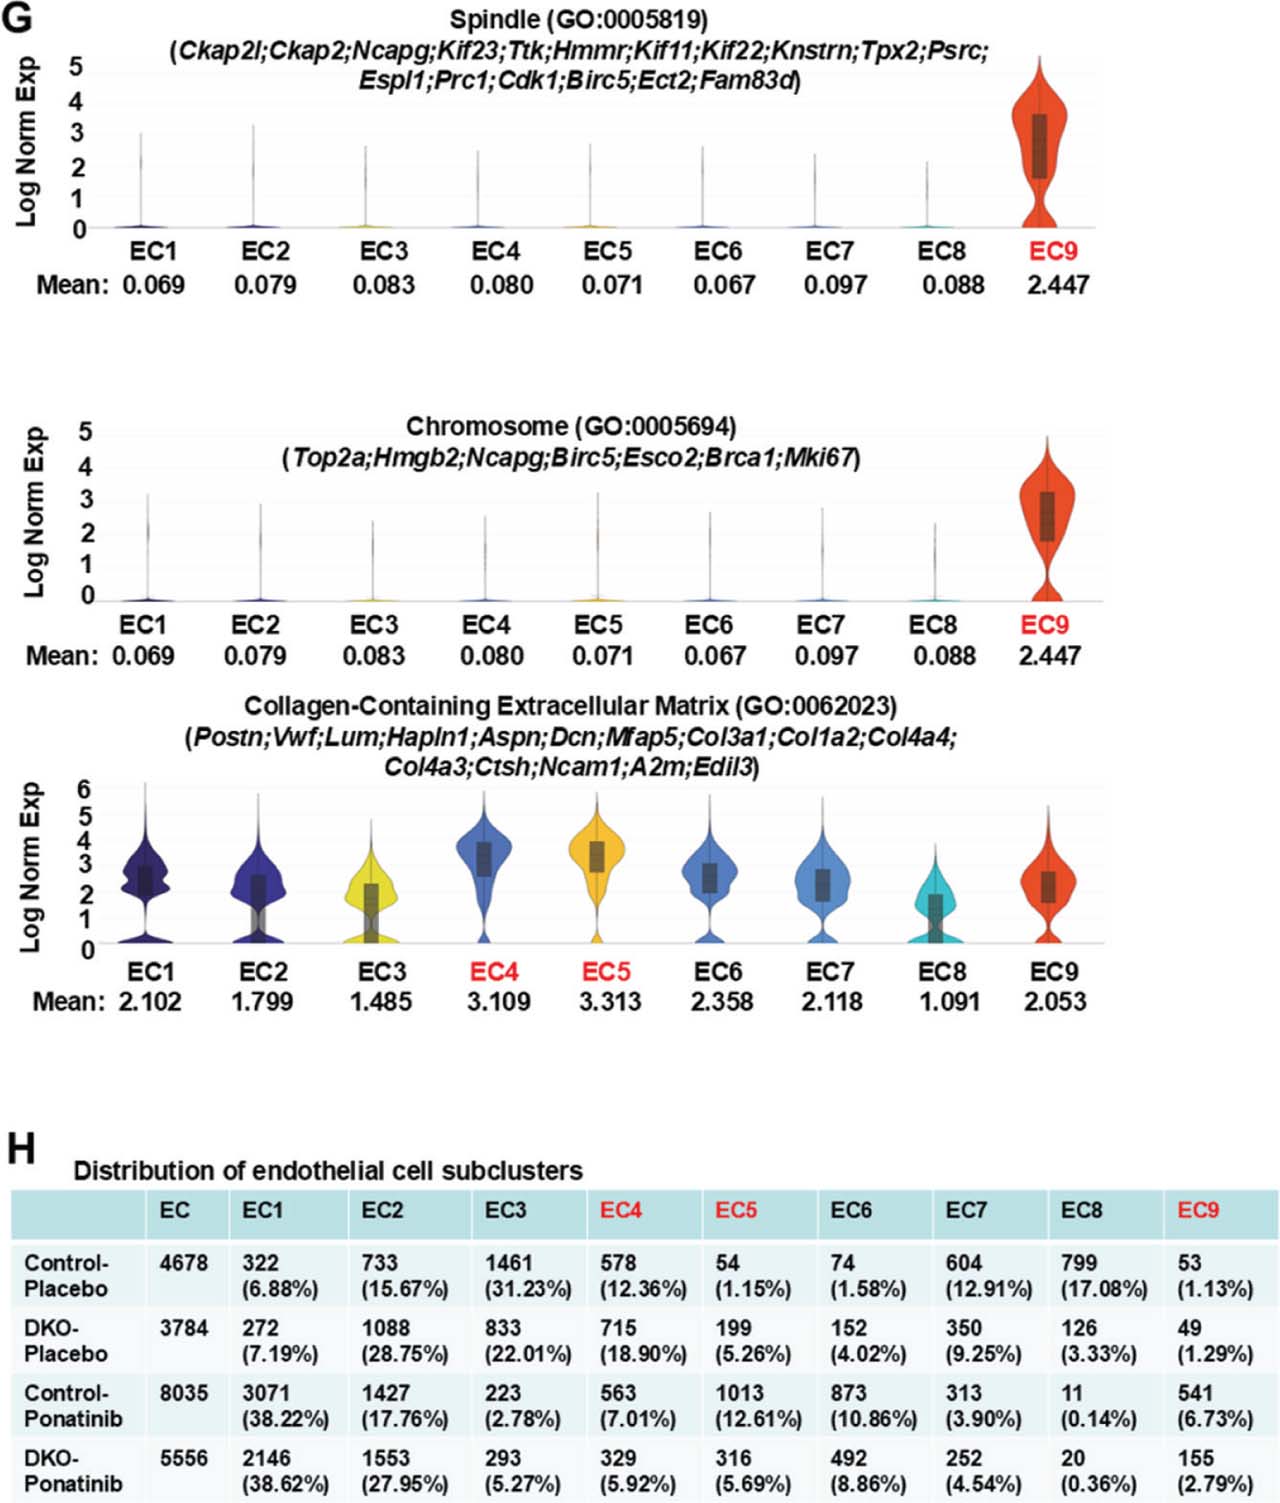
Fig 8.
Reduced extracellular matrix and cell proliferation related gene expression in ponatinib-treated DKO EC clusters. (A) Top 10 enriched terms by GO Cellular Component analysis of 130 DEGs generated by Loupe Browser (p < 0.05; p-values are adjusted using the Benjamini–Hochberg correction for multiple test; p-values are listed in Supplementary Table S13) that were downregulated in EC clusters of DKO-ponatinib vs.control-ponatinib groups. GO Cellular Component analysis was conducted using FET with false discovery rate control by the Benjamini-Hochberg method (p-values are listed in Supplementary Table S16). (B–D) Violin plots visualizing the distribution of gene expression levels of three enriched terms with global significance in four groups of EC clusters. (E) UMAP highlighting the EC cluster from the aggregation of four samples containing nine distinct subclusters (numbered EC1-9). Endothelial marker, Pecam1, expressed across all nine subclusters. (F) Violin plots showing enrichment of cell proliferation-related DEGs in EC9. Some DEGs related to extracellular matrix were enriched in two subclusters, EC4 and EC5. (G) Violin plots showing remarkable enrichment in EC9 for cell proliferation related components and in EC4 and EC5 for extracellular matrix related components. (H) Relative nuclei distribution of nine subclusters in each sample. The numbers and ratios of nuclei in each subcluster of each sample were listed. The relative nuclei distributions of EC4, EC5, and EC9 were all reduced in the DKO-ponatinib vs. control-ponatinib groups. DEGs, differentially expressed genes; DKO, inducible cardiomyocyte-specific ROCK1 and ROCK2 double knockout; EC, endothelial cells; FET, Fisher exact test; GO, gene ontology; ROCK, Rho-associated coiled-coil containing kinase; UMAP, uniform manifold approximation and projection.
Furthermore, pathway analysis was performed on 16 DEGs upregulated in DKO-ponatinib macrophage cluster and comparison was made with control-ponatinib, the results returned three enriched WikiPathways and nine enriched GO terms. Two WikiPathways and 4 GO enriched terms showed p-values computed from FET <0.05 (Supplementary Tables S23 and S24); meanwhile, both the related DEGs, Myh7 and Esr1 were cardiomyocyte-enriched genes; thus, it may be ascribed to ambient RNA contamination.
Looking into SM clusters, we analyzed differential gene expressions and various pathways with a focus on the DEGs between control-ponatinib (1316 nuclei) and DKO-ponatinib (949 nuclei) groups. Differential expression testing revealed a total of six DEGs downregulated (Supplementary Table S25) and nine DEGs upregulated (Supplementary Table S26) in DKO-ponatinib. Pathway analysis was performed on six down-regulated DEGs, which returned three enriched WikiPathways and two enriched GO terms. Among them, three WikiPathways showed p-values computed from FET <0.05 with two related DEGs (Hdac9, Myl4) (Supplementary Tables S27 and S28). Of note, as increased HDAC can promote SM dysfunction, including enhanced proliferation, migration, and apoptosis, the reduced Hdac9 observed in DKO-ponatinib SM (not in other cell types) suggests that deletion of ROCKs in cardiomyocytes may have protective effects on SM. Moreover, the SM cluster contains six subclusters, and no difference in the composition was detected between the two groups.
In addition, pathway analysis was performed on nine DEGs upregulated in DKO-ponatinib SM cluster; the results yielded five enriched WikiPathways and 12 enriched GO terms. Four WikiPathways and 6 GO enriched terms showed p-values computed from FET <0.05 (Supplementary Tables S29 and S30), with four related DEGs (Esr1, Myh7, Nppb, Slc15a2). Esr1, Myh7 and Nppb were cardiomyocyte-enriched genes, therefore possibly attributed to ambient RNA contamination. Briefly, from the analysis of macrophages and SM, we identified less transcriptomic shifts than in fibroblasts and EC, with fewer downregulated DEGs associated with inflammation and immune responses in the DKO-ponatinib group and no detectable changes in their subcluster composition between control-ponatinib and DKO-ponatinib groups.
4. Discussion
4.1. Both ROCK1 and ROCK2 expressions and activity are triggered in ponatinib-induced CTX
We established a ponatinib-induced CTX mouse model (35 mg/kg/day by oral gavage for 4 weeks) which was successfully used in this study for evaluating long-term effects of ponatinib on cardiac structure and function. Pre-clinical studies of ponatinib-induced CTX in mouse models have recently been increasingly reported (Madonna et al. 2021, 2022; Hnatiuk et al. 2022; Tousif et al. 2023). In some studies, lower dosages of ponatinib, compared to the dosages used in healthy mice in our study, were able to induce CTX in experimental mice, either 24-month-old or with cardiovascular comorbidities (Tousif et al. 2023; Stepanian et al. 2025). In general, the recommended ponatinib dosages to induce CTX are 15 mg/kg/day for cardiovascular comorbidity mouse models, whereas 30 mg/kg/day for mice with advanced age and 35 mg/kg/day for middle-aged healthy mice are appropriate. We take note of the dosage of ponatinib used in healthy mice (35 mg/kg/day) is higher than 15 mg/kg/day, which could raise ponatinib levels in mouse blood to a comparable level detected in patients (Tousif et al. 2023; Stepanian et al. 2025). However, cardiovascular adverse events, including arterial occlusive events, occurred in 9.6% of patients who received the highest approved starting dose of ponatinib (Cortes et al. 2021). Thus, if confining dosage in our present study to 15 mg/kg/day, CTX occurrence in healthy study mice would not yield a desired result. It has been previously reported that to induce CTX with the dosage of 15 mg/kg/day, mice must have cardiovascular comorbidities as a prerequisite (Tousif et al. 2023; Stepanian et al. 2025). Shaped by prior studies, healthy mice were used in current ponatinib CTX study, and the drug dosage was adjusted based on our pilot studies. Both cardiac and vascular toxicity phenotypes observed in the present study are consistent with previously reported experimental and clinical cardiovascular adverse events (Aghel and Lipton 2025; Sacha and Krawczyk 2025), further validating our mouse model.
The initial important observations include but are not limited to dose-dependent upregulation of Rock1 and Rock2 mRNA in ponatinib-treated mouse hearts. In addition, Rock2 mRNA expression showed a greater sensitivity to increased drug dosage compared to Rock1, implying isoform-specific inhibitors would provide more precisive targeting effects. These observations support the role of increased ROCK expression in ponatinib-induced CTX. These results are not only consistent with the clinical observations reporting increased ROCK activity in the peripheral blood mononuclear cells of Ph+ leukemia patients treated with ponatinib (Yu et al. 2022) but also provide cellular and molecular insights on ROCK-mediated adverse cardiovascular effects using animal models. Increased ROCK activities have also been observed in high-fat diet-fed ApoE−/− mouse hearts (Shi and Wei 2013; Shimokawa et al. 2016), and hyper-trophic mouse hearts induced by pressure overload (Zhang et al. 2006; Shi and Wei 2013). On the note, lower ponatinib doses are required to induce CTX in these models (Tousif et al. 2023; Stepanian et al. 2025).
4.2. Double ROCK deletion in cardiomyocytes is protective against ponatinib-induced CTX and vasculartoxicity
Remarkably, we observed that double ROCK deletion in cardiomyocytes significantly prevented cardiac dilation and improved cardiac function following ponatinib treatment (Figure 1). This cardio-protection is consistent with our previous study that reported reduced cardiac fibrosis during aging in DKO mouse hearts (Shi et al. 2019). In this study, single or double ROCK deletion was conducted in cardiomyocytes, we observed stronger cardio-protective effects in double ROCK deletion group than in single ROCK1 deletion group. The rationale is that single ROCK2 deletion in cardiomyocytes enhances cardiac fibrosis during aging due to compensatory up-regulation of ROCK1 (Shi et al. 2019).
In addition to reduced CTX, double ROCK deletion in cardiomyocytes also partially mitigated ponatinib-induced vascular toxicity. Ponatinib treatment in the control mice substantially increased the serum levels of several circulating vascular toxicity biomarkers, including PAI-1 (Total), sE-selectin, sP-selectin, PECAM-1 and Thrombomodulin, compared to the control-placebo group; however, in ponatinib-treated DKO mice, their serum levels were only slightly increased compared to the DKO-placebo group (Figure 2). These results support that targeted cardiomyocyte protection is traceable to double ROCK deletion, which helps alleviate both cardiac and vascular toxicities of ponatinib (Sacha and Krawczyk 2025). The potential protective mechanism could be attributed to cardiomyocyte DKO preventing cardiac dysfunction, thus promoting healthy blood flow and relieving vascular stress. Moreover, snRNA-seq analyses provide evidence supporting reduced ponatinib-induced transcriptomic signatures that were linked to pathological remodeling of cardiomyocytes, cardiac endothelial cells, and fibroblasts in DKO hearts. Together, less cardiac dysfunction and less pathological remodeling contribute to reduced cardiac and vascular toxicities.
The detection of vascular toxicity biomarkers in study mice yielded solid data. Our findings are consistent with previous scrutiny by others that biomarkers of thrombo-inflammatory response and endothelial dysfunction were altered in patients treated with ponatinib (Aghel et al. 2023) and in mice (Pouwer et al. 2018; Hamadi et al. 2019). Among five significantly increased biomarkers in the present study, the elevation of sE-selectin (Pouwer et al. 2018) and sP-selectin (Hamadi et al. 2019) in the plasma of mice was caused by ponatinib treatment. Both are markers of endothelial activation and leukocyte adhesion molecules on EC, supporting endothelial dysfunction and pro-inflammatory response in the vasculature (Pouwer et al. 2018). Although a direct correlation between ponatinib treatment and serum levels of PECAM-1, PAI-1 and Thrombomodulin has not been previously reported in animal model, their increased serum levels are consistent with a known high thrombotic risk associated with ponatinib treatment (Latifi et al. 2019; Haguet et al. 2020). Therefore, our observation suggests that their circulating serum levels can serve as biomarkers to issue timely warnings for ponatinib-induced vascular toxicity.
4.3. Single-nucleus transcriptomics define cell-type specific ponatinib-induced transcriptomic signatures with potential mechanistic implications
To our knowledge, the current study is among the earliest to take an snRNA-seq approach to assess ponatinib-induced CTX in a mouse model. Using this advanced technology, we could gain novel insights into ponatinib-induced CTX and several cell-type specific transcriptomic signatures: 1) ponatinib-induced upregulation of non-cardiomyocyte gene expressions in cardiomyocytes is connected to extracellular remodeling and thrombogenesis; 2) significant cardiomyocyte composition changes are associated with augmented cardiomyocyte subclusters highly expressing these noncardiomyocyte genes; 3) boosted gene expressions after ponatinib treatment happened in fibroblasts and EC, which are linked to myofibroblast activation, EC proliferation and endothelial-to-mesenchymal transition and are associated with significant composition changes including increased abundance of activated fibroblast subclusters and activated EC subclusters.
The ponatinib-induced upregulation of non-cardiomyocyte gene expressions could easily be detectable in cardiomyocytes; the resulting transcriptomic shift is associated with extracellular remodeling and thrombogenesis. But our data denotes that it does not agree with ambient RNA contamination from other non-cardiomyocyte cell types. The ambient RNA contamination is a ubiquitous and widespread problem; however, the up-regulated non-cardiomyocyte gene expression is featured with highly enrichment in cardiomyocyte subclusters CM4 and CM5 instead of in all seven cardiomyocyte subclusters (Figure 5c). Concurrently, the distribution in combined CM4-5 subclusters increased from 11.66% of the control-placebo cardiomyocytes to 20.58% of the control-ponatinib cardiomyocytes (Figure 5e). This finding was furthermore validated using the CellBender output, which represents the data set after ambient RNA removal (Supplementary Figure S11). In the CellBender output data set, the cardiomyocyte cluster from the aggregation of four samples contained six distinct subclusters (numbered CM1-6) (Supplementary Figure S11a) and these non-cardiomyocyte gene expressions were highly enriched in three sub-clusters CM4-6 instead of in all six cardiomyocyte subclusters (Supplementary Figure 11b). Additionally, ponatinib treatment changed the relative nuclei distribution of these six subclusters, including the combined CM4-6 subclusters from 4.76% of the control-placebo cardiomyocytes to 11.73% of the control-ponatinib cardiomyocytes (Supplementary Figure 11c).
The current high-resolution technology uncovered EC heterogeneity and transcriptomic signatures associated with activated EC. For instance, active proliferation and cell cycle engagement and endothelial-to-mesenchymal transition, which are the two most prominent pathological remodeling processes within the complex heart tissues, increased after receiving ponatinib treatment. Our findings in cardiac EC are also consistent with endothelial activation reported in previous ponatinib cardiovascular toxicity mouse (Stepanian et al. 2025) and clinical studies (Yu et al. 2022). As mentioned earlier, our present study is focused on conducting the comparison on cell heterogeneity and transcriptome between DKO-ponatinib and control-ponatinib groups, and the primary question that we want to answer is what mechanisms support the cardioprotective effects in DKO cardiomyocytes. Further transcriptome and pathway analyses will be performed in other pairwise comparisons that are not discussed in detail in this manuscript, including but not limited to the comparison between control-ponatinib and control-placebo, which are expected to reveal additional ponatinib-induced transcriptomic signatures with potential mechanistic implications.
4.4. The transcriptomic signatures defined in DKO mouse hearts suggest that their cardioprotective effects may mediate through both cell autonomous and non-cell autonomous mechanisms, which are related to ROCK-mediated cytoskeleton reorganization
Conspicuously, double ROCK deletion in cardiomyocytes induced transcriptomics shifts in both cardiomyocytes and non-cardiomyocytes are in agreement with the following potential mechanistic implications: 1) In cardiomyocytes where double ROCK deletion took place, we observed reduction in ponatinib-induced gene expression linked to extracellular matrix remodeling and thrombogenesis, as well as the reduced abundance of cardiomyocyte subclusters actively expressing these genes. Another striking observation is the heightened expression of both sarcomeric and non-sarcomeric cytoskeleton-interacting genes in DKO cardiomyocytes which may support preserved cytoskeleton stability under stressed conditions. 2) In cardiac fibroblasts and EC of the DKO-ponatinib group, we observed reduced gene expressions related to myofibroblast activation, EC proliferation, and endothelial-to-mesenchymal transition, along with a reduction of the fibroblast subclusters and EC subclusters highly expressing these genes. Notably, the cell type-specific signals related to extracellular matrix remodeling, blood coagulation, myofibroblast activation, cell proliferation, and endothelial activation were consistently identified from pathways that remained significant after correction for multiple testing (adjusted p < 0.05) (Supplementary Tables S4, S10 and S16), lending strong support to the biological relevance and robustness of these findings.
A meaningful discovery from our present study is that ponatinib-induced transcriptomic signature associated with extracellular matrix remodeling is simultaneously down-regulated in cardiomyocytes, fibroblasts and EC in DKO hearts (Figures 4, 7 and 8, Supplementary Tables S4, S10 and S16). These results suggest that a common mechanism is implicated in these three major cell types during pathological cardiac remodeling, most likely through reduced ROCK-mediated actin cytoskeleton reorganization. ROCKs are widely acknowledged as master regulators of the extracellular matrix by promoting actin polymerization and cellular contraction to control how cells perceive, assemble, and remodel the extracellular matrix (Shi and Wei 2013; Wei et al. 2016). In addition, ROCK pathways also regulate transcription factors such as SRF, MRTF-A and YAP/TAZ, which are critical for translating mechanical cues from the extra-cellular matrix into changes in gene expression (Shi and Wei 2013; Wei et al. 2016). Moreover, the reduced transcriptomic signature linked to cell division and cytoskeleton organization in DKO EC (Supplementary Table S16) is also consistent with the established role of ROCKs in EC (Shi and Wei 2013; Wei et al. 2016). Together, the simultaneous transcriptomic shifts suggest that ROCK activity and consequently ROCK-mediated cytoskeleton reorganization are down-regulated in cardiomyocytes as well as in fibroblasts and EC of DKO hearts.
It is obvious to see the downregulation of ROCK activity in DKO cardiomyocytes (Supplementary Figure S3) through cell autonomous mechanisms. However, how double ROCK deletion in cardiomyocytes reduces ponatinib-induced transcriptomic signatures in fibroblasts and EC remains unclear as both ROCK proteins are still present in these cells. Our current observations suggest a potential mechanism through direct cell-to-cell coupling endorsed by only modest transcriptomic shifts shown in macrophages and SM in the ponatinib treated DKO hearts, and these two cell types indeed have less cell-to-cell direct contacts with DKO cardiomyocytes than fibroblasts and EC. One point that should be emphasized here is that using snRNA-seq technology has the highest potential in uncovering intercellular interactions within heart tissues, as traditional single cell RNA-seq requires cardiac cell isolation and that process can affect the resulting transcriptomic signatures.
Additionally, our previous study reported increased caveolar density and mechano-protection in ROCK1-deficient cardiomyocytes, adipocytes and mouse embryonic fibroblasts, suggesting a role of ROCKs in regulating submembrane actin cytoskeleton contractility and plasma tension in these cells (Shi and Wei 2024). This also supports downregulation of ponatinib-induced transcriptomic signatures in fibro-blasts and EC through direct cardiomyocytes-to-fibroblast/endothelial cell coupling. It is therefore possible that double ROCK-deficient cardiomyocytes, through decreased plasma membrane tension, provide a microenvironment with lessened stiffness and mechano-transduction to the adjacent fibroblasts and EC, consequently leading to the attenuated ROCK activation in these cells.
Our ongoing understanding of the mechanism of the ponatinib-induced transcriptomics shifts in DKO cardiomyocytes, fibroblasts and EC is derived from the assessment of differential expression patterns and examination of biological pathways of the present study. We then bridged these novel transcriptomic insights from transcriptomic signatures with established roles of ROCKs in actin cytoskeleton reorganization, extracellular matrix remodeling and cell division (Shi and Wei 2013; Wei et al. 2016). The proposed potential intercellular remodeling mechanisms remain to be validated by future in vitro and in vivo experimentations. Nonetheless, our current view could extend our previous insight on the roles of ROCKs in mediating heart failure progression. For example, we mainly focused on cell death mechanisms in cardiomyocytes instead of on the pathological remodeling of multiple cardiac cell types and their intercellular connection (Chang et al. 2006; Zhang et al. 2006; Shi et al. 2008, 2010, 2011, 2018; Shi and Wei 2024). Therefore, the ponatinib-induced transcriptomic signatures identified here will guide subsequent mechanistic studies and experimental validation to deepen our understanding of the roles of ROCKs in cardiovascular diseases.
4.5. Translational implications
Given the facts that many anti-cancer drugs induce ROCK activations in cardiovascular systems and that pre-existing cardiovascular diseases in cancer patients are frequently associated with increased ROCK activations (Shi and Wei 2013; Shimokawa et al. 2016; Cheng et al. 2025), our study supports future clinic studies aimed at testing therapeutic potential of inhibiting ROCK activities during anti-cancer drug treatment to reduce life-threatening cardiovascular complications. ROCK inhibitors have been extensively studied in animal models of cardiovascular diseases (Shi and Wei 2013; Shimokawa et al. 2016; Cheng et al. 2025), including heart failure (Li et al. 2012a), cardiac hypertrophy (Li et al. 2012a), myocardial ischemia/reperfusion injury (Zhang et al. 2010; Li et al. 2012b), vascular dysfunction (Wu et al. 2009; Matsumoto et al. 2012) or anti-cancer drug-induced CTX (Wang et al. 2011). In addition to the extensive preclinical data accumulated from animal models, ROCK inhibitors have been used in clinical settings for nearly three decades (Shi and Wei 2013; Shimokawa et al. 2016; Cheng et al. 2025). Fasudil, a pan-ROCK inhibitor, was the first ROCK-targeting drug approved for clinical use in Japan in 1995 to treat cerebral vasospasm following subarachnoid hemorrhage (Shibuya et al. 1992). The obvious beneficial effects from applications of ROCK inhibitors support the notion that ROCKs are promising therapeutic targets for various cardiovascular diseases. Noteworthy, recent trials of an oral application of fasudil support the feasibility for future trials of fasudil in chronic diseases (Wolff et al. 2024a, b).
4.6. Study limitations
The snRNA-seq experiments were conducted with two pooled samples for each group. The pooled designs could reduce the ability to make robust biological inferences and thus affect the true biological replication, increase false-positive risks, and confound genotype-specific effects with inter-mouse variability. As stated in Materials and Methods, DKO and control mice were littermates from breeding to reduce inter-mouse variability, especially for snRNA-seq samples; any outlier mouse showing abnormal body weight was removed from the experimental groups in the present study. Since this is our nascent attempt to identify major associated cell populations, transcriptional programs, and pathways through snRNA-seq experiments to generate hypothesis of the mechanisms underlying cardiovascular protection against ponatinib-induced CTX in DKO mice, the pooled designs can provide a broad overview at lower cost and minimize batch effects introduced during sample processing. Some reported snRNA-seq or single-cell RNA-seq studies have been conducted with pooled samples (Skelly et al. 2018; Tombor et al. 2021; Miranda et al. 2023; Samuels et al. 2023). A central insight is that the number of nuclei to be analyzed per sample and the depth of sequencing, which influences the number of genes obtained per nucleus, are crucial in the design of the snRNA-seq experiments (Miranda et al. 2023). In our experiments, adequate nucleus counts (>10,000 nuclei per group after quality filtering to remove low-quality nuclei) were obtained, and sequencing quality was high (>20,000 mean reads per nucleus) (Supplementary Figures S8 and S9). Moreover, the transcriptomic shifts identified in cardiomyocytes, cardiac fibroblasts and EC of DKO-ponatinib vs. control-ponatinib groups were from statistically rigorous differential gene expression analysis with enriched pathways reaching global significance (Supplementary Tables S4, S10, and S16), supporting that our findings are reliable. Finally, since our current snRNA-seq study was performed on pooled samples for obtaining sufficient nuclei for profiling, the transcriptomic findings should be considered hypothesis-generating and further validation using independent experimental approaches should be followed.
4.7. Conclusion
This study represents a novel approach to integrate cardio-protective phenotype of double ROCK deletion with snRNA-seq-based cell-type resolution, particularly regarding the comparison of cardiomyocyte, fibroblast, and endothelial transcriptomic signatures. The study provides evidence that double ROCK deletion in cardiomyocytes decreases ponatinib-induced cardiac and vascular toxicities and attenuates cell-type specific ponatinib-induced transcriptomic signatures in cardiomyocytes, cardiac fibroblasts and EC. Identified transcriptomic signatures include extracellular matrix- and blood coagulation-related genes expressions in cardiomyocytes, myofibroblast activation-related gene expressions in fibroblasts, and cell proliferation and endothelial-to-mesenchymal transition-related gene expressions in EC. Significantly, the transcriptomic shifts in these three cell types are linked to reduced ROCK-related cytoskeleton reorganization, suggesting that the ponatinib-induced ROCK activities and concomitant cytoskeleton reorganization in cardiomyocytes, cardiac fibroblasts and EC are interconnected events implicated in CTX induction. These identified cell-type specific transcriptomic signatures may provide a focused basis for subsequent mechanistic and experimental validation in ponatinib-associated cardiovascular toxicity as well as in ROCK contribution to heart failure progression.
Abbreviations
- ABL
Abelson murine leukemia
- ANOVA
analysis of variance
- DAPI
diamidino-2-phenylindole
- DMSO
dimethyl sulfoxide
- EGFP
enhanced green fluorescent protein
- GAPDH
glyceraldehyde-3-phosphate dehydrogenase
- MACS
magnetic-activated cell sorting
- MRTF-A
myocardin-related transcription factor-A
- OCT
optimal cutting temperature
- PAI-1
plasminogen activator inhibitor-1
- PBS
phosphate-buffered saline
- PECAM-1
platelet endothelial cell adhesion molecule-1
- ROSA
reverse orientation splice acceptor
- SEM
standard error of the mean
- SRF
serum response factor
- t-SNE
t-distributed stochastic neighbor embedding
- UMI
unique molecular identifier
- YAP/TAZ
yes-associated protein/transcriptional coactivator with PDZ-binding motif
Acknowledgment
We thank Dr. Reuben Kapur for insightful comments on this study. In snRNA seq data analyses and statistical analyses, R (version 4.5.3) and Microsoft Copilot were used to support part of data analytic workflows. All scientific interpretations, decisions and conclusions were made by the authors.
Notes
[1] Funding
This work was supported by National Institutes of Health [HL151480 to Drs. L.W. and J.S.), CA263470 to Drs. J.S. and Reuben Kapur, HL107537 to Dr. L.W., HL134599 to Dr. L.W.]; Riley Children’s Foundation (to Drs. J.S. and L.W.), and the Indiana Clinical and Translational Sciences Institute (to Dr. J.S.).
[2] Contributed by Author Contributions
Jianjian Shi and Lei Wei contributed to the conception of the study, experimental design, conduct of the research, data analysis and interpretation, and participated in writing and revising the manuscript. Yunjie Huang and Stephanie Shi contributed to the data analysis and interpretation of the snRNA-seq data, and manuscript discussion as well. All authors agreed with the content of this manuscript and have approved the manuscript before submission.
Notes
Supplementary Figures and Results
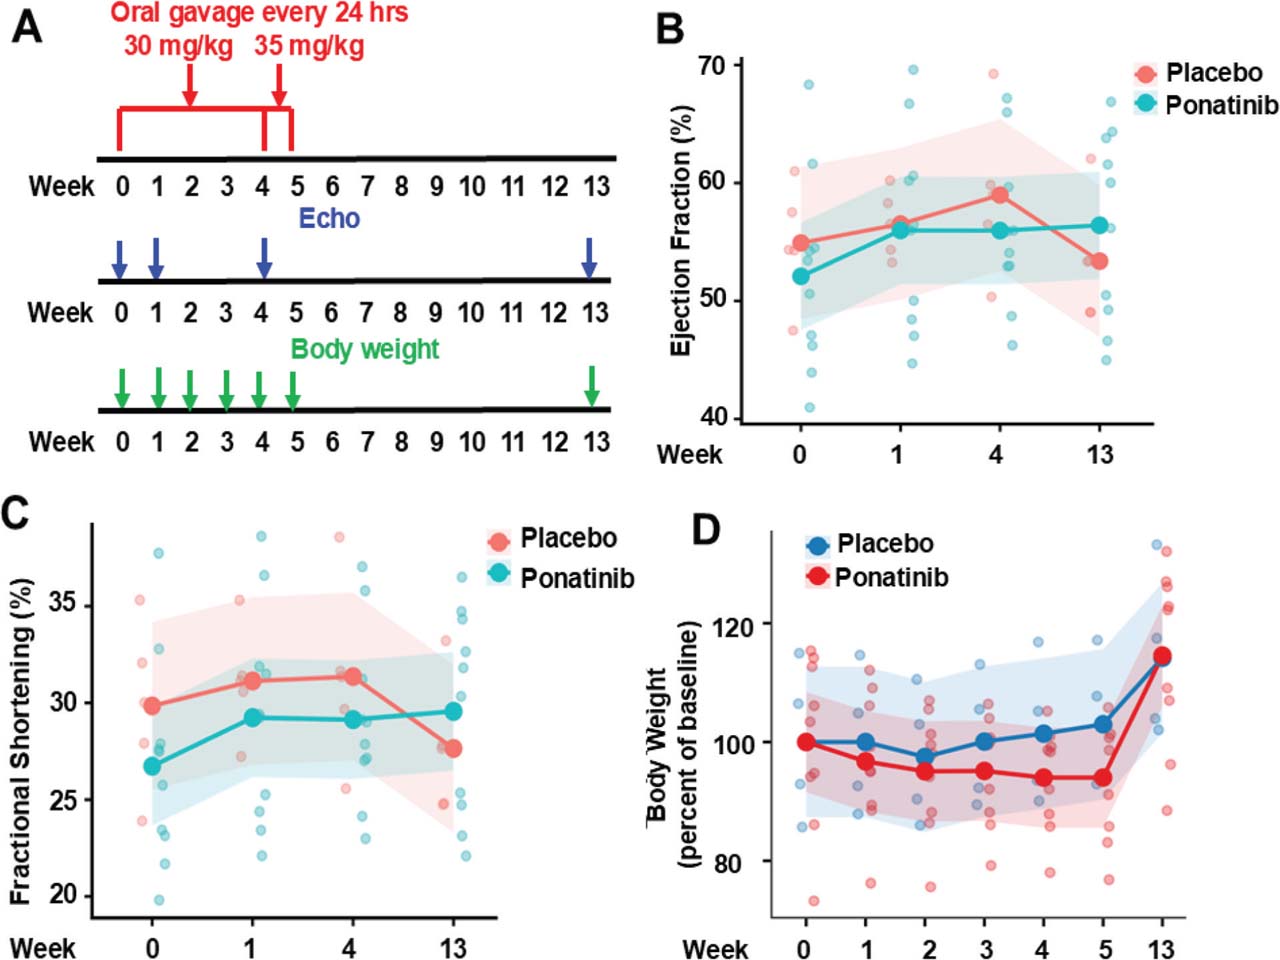
Supplementary Fig. 1.
Ponatinib-induced CTX on lower dose and longtime course. (A) An experimental scheme involving 6–8-month-old male C57BL/6J mice subjected to ponatinib treatment at 30 mg/kg/day for 4 weeks and at 35 mg/kg/day for an additional week. The general drug toxicity was monitored by body weight decline, and cardiac function was monitored by echocardiography (Echo) at indicated time points. (B,C) Measurement of EF and FS at indicated timepoints; the endpoint was at 8 weeks post-treatment. No statistically significant difference was observed in the placebo-treated (received equal volume of DMSO in normal saline) and ponatinib-treated group, p = 0.469 (EF) and p = 0.482 (FS). (D) A trend but not statistically significant reductions in body weight were observed in the ponatinib-treated vs.placebo-treated group during first 4 weeks of treatment at 30 mg/kg/day. After an additional 1 week of treatment was added at 35 mg/kg/day, mouse body weight showed a further decline, but still not significant. The body weight was recovered 8 weeks after stopping treatment. For statistical analysis, two-way repeated-measures ANOVA was used to assess group differences over time for (b–d). N = 8 mice in each group. EF, ejection fraction; FS, fractional shortening.
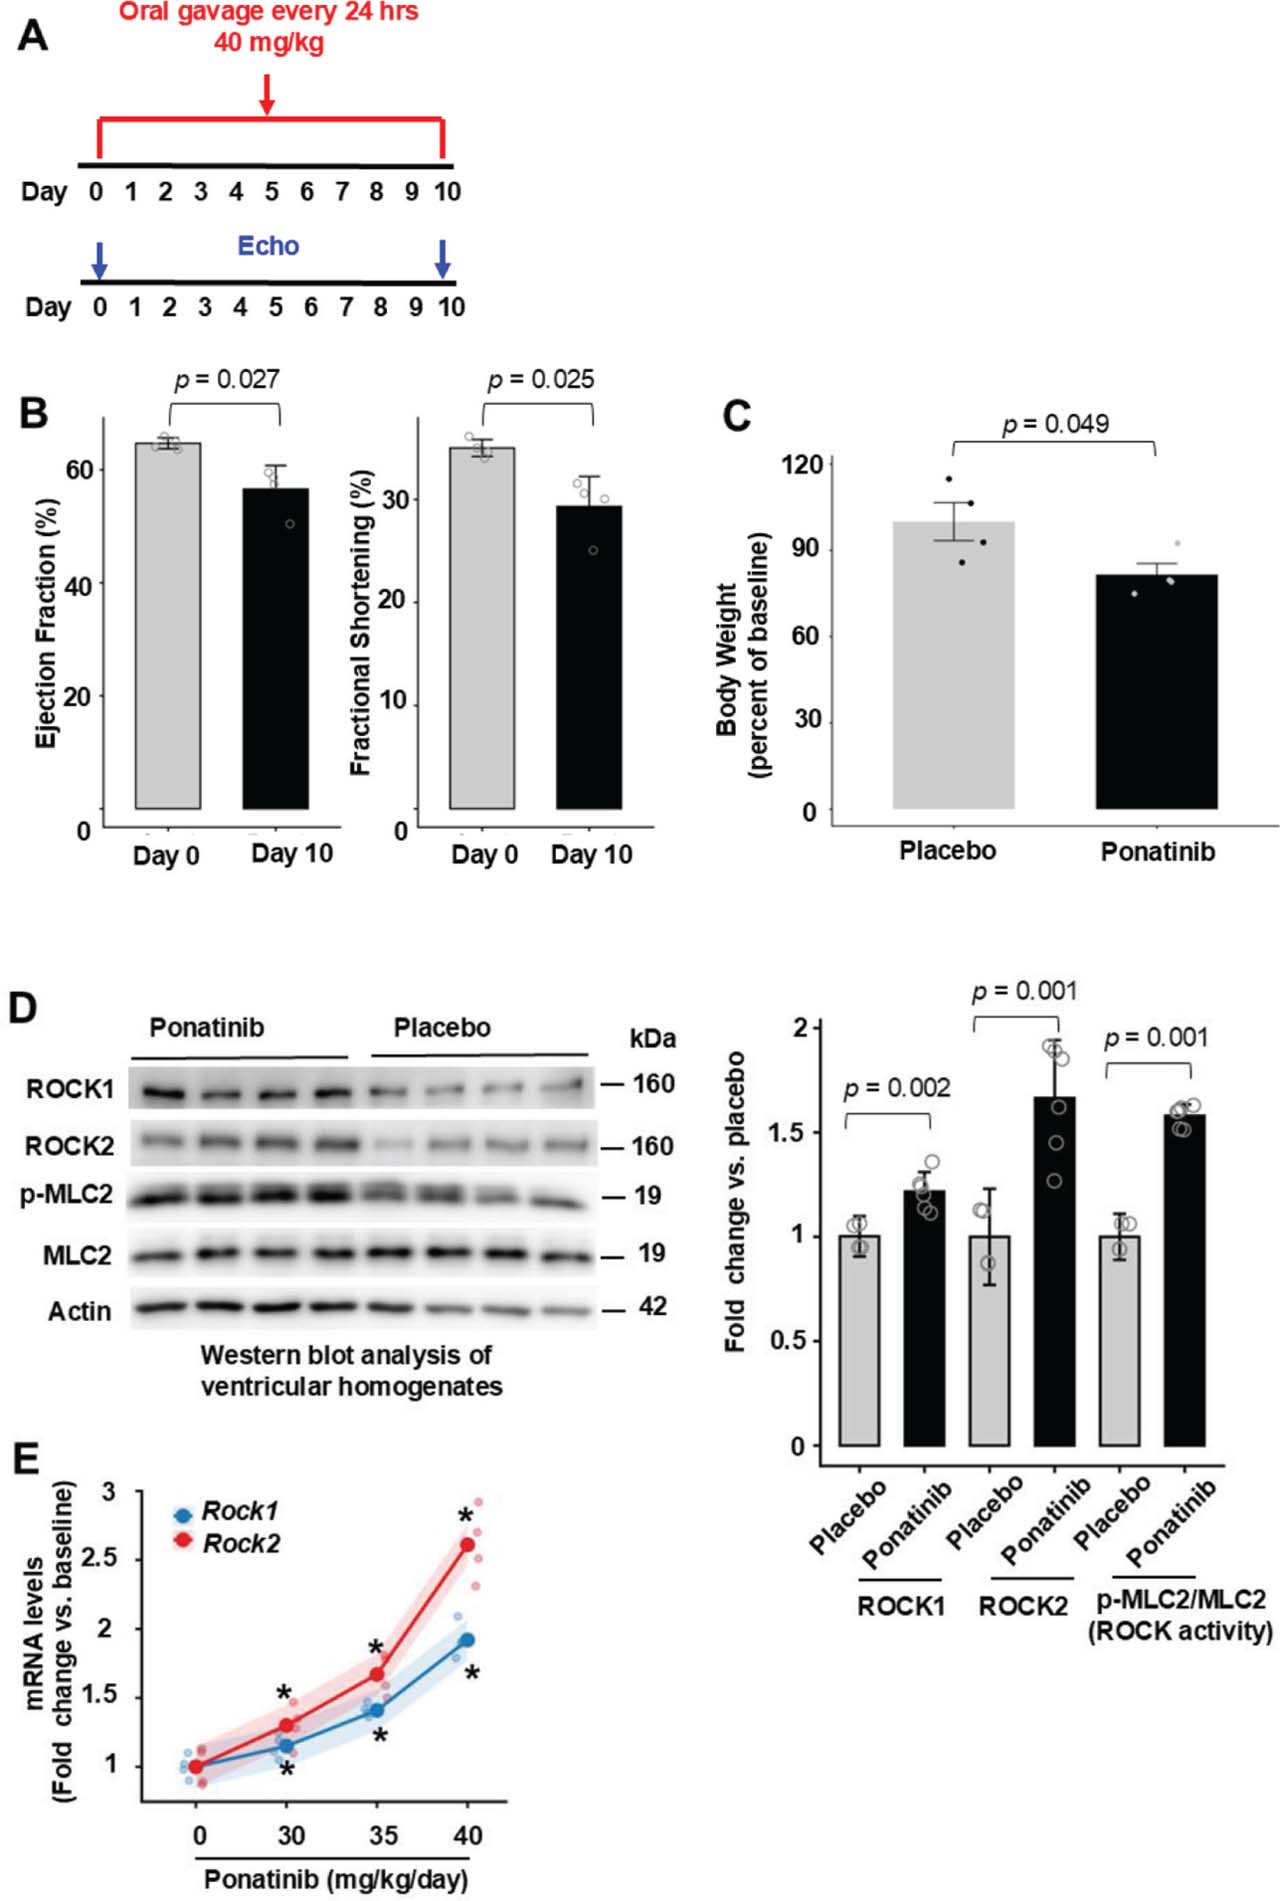
Supplementary Fig. 2.
Ponatinib-induced CTX on higher dose and short time course. (A) The difference from the previous pilot study was at the dose of 40 mg/kg/day and the treatment length was 10 days. The general drug toxicity was monitored as in previous pilot study. (B) EF and FS were significantly different on day 10 of the treatment compared with the baseline. N = 8 mice in each group. (C) Ponatinib significantly reduced body weight after 10 days of treatment by about 18% indicating general drug toxicity. N = 8 mice in each group. (D) Representative image (left) of Western blot analysis in the ventricular homogenates from placebo or ponatinib-treated mice on day 10. Quantitative analysis (right) of immunoreactive bands of ROCK1, ROCK2, p-MLC2, MLC. N = 4–6 mice in each group. (E) Dose-dependent mRNA expression of ROCKs. The study mice subjected to increasing doses of drug treatment for 7 days. The mRNA expression of ROCKs was normalized with GAPDH. Data are shown as model-estimated marginal means ± 95% confidence intervals. Rock1 mRNA increased from baseline to the highest dose: baseline: 1.00 [0.85–1.15]; dose 40 mg/day/kg: 1.92 [1.77–2.07], with statistically significant increases observed from dose 30 mg/kg/day (p ≤6.84e−04) to 40 mg/kg/day (p ≤1.37e−08). Rock2 mRNA expression exhibited a steeper dose–response: baseline: 1.00 [0.85–1.15]; dose 30 mg/kg/day: 1.30 [1.15–1.45] and reaching 2.61 [2.46–2.76] at 40 mg/kg/day, with statistically significant increases observed from dose 30 mg/kg/day (p ≤1.58e−06) to 40 mg/kg/day (p ≤1.20e−12). The changes in Rock2 mRNA levels (defined as fold change vs.baseline) exceeded those of Rock1 at dose 35 mg/kg/day (Δ = 0.26, p = 0.020) and dose 40 mg/kg/day (Δ = 0.69, p = 2.0e−06), indicating greater sensitivity of Rock2 to increasing drug dosage. N = 4–6 mice in each group. For statistical analysis, p-values were calculated using an unpaired two-tailed Student’s t-test for (B–D), and p-values were calculated using two-way repeated-measures ANOVA followed by post hoc multiple-comparison testing for (E). EF, ejection fraction; FS, fractional shortening; ROCKs, Rho-associated coiled-coil containing kinase.
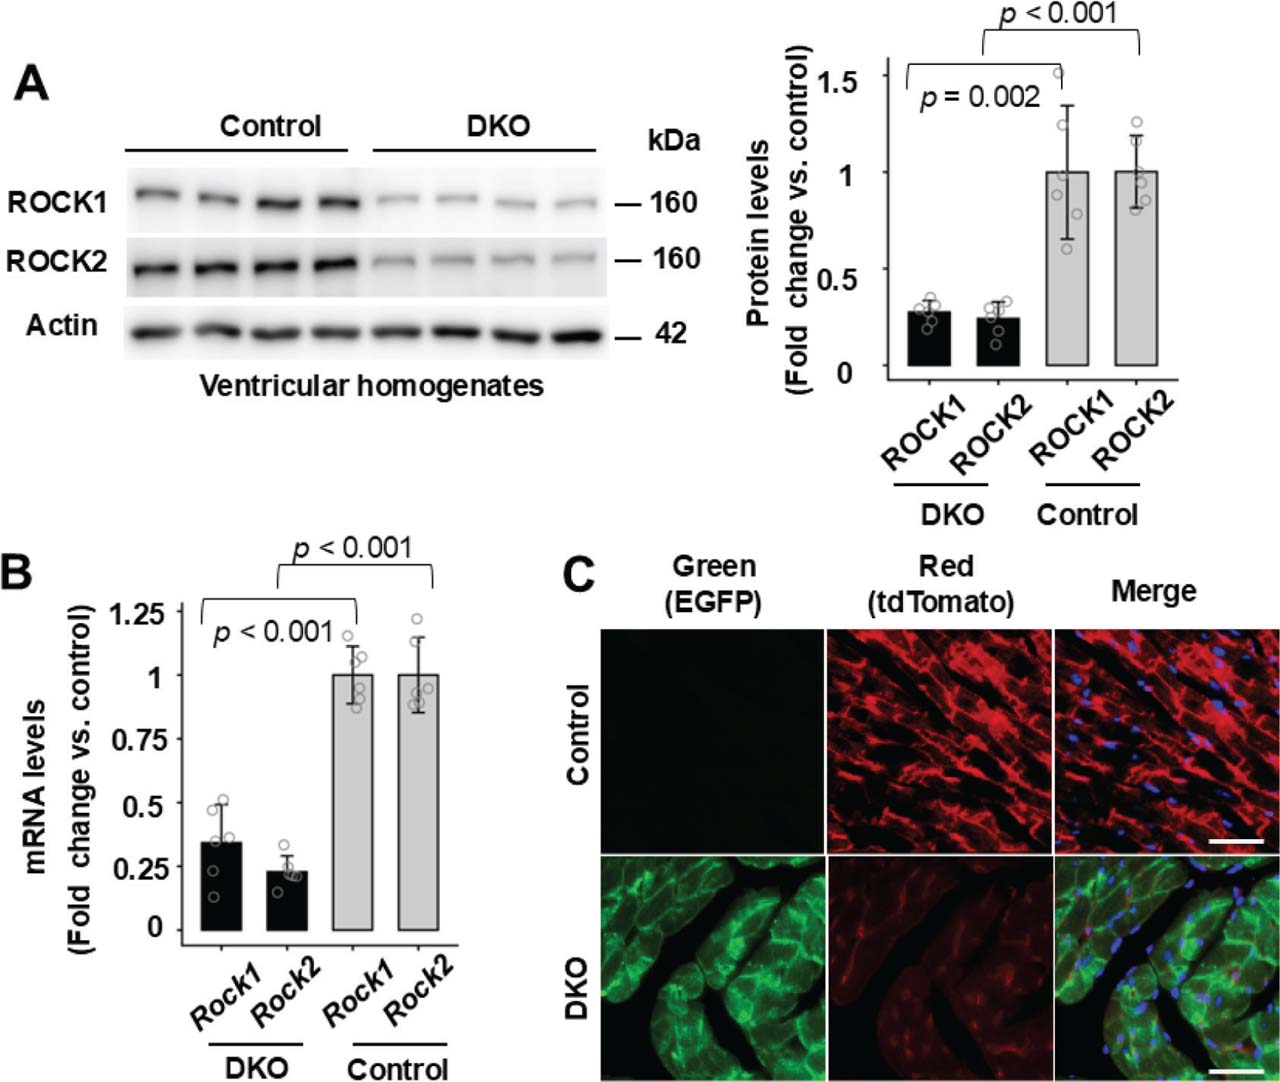
Supplementary Fig. 3.
Reduced ROCK1 and ROCK2 expressions in DKO mouse hearts. (A) and (B), Western blot analysis (A) and real-time quantitative RT-PCR analysis (B) of ROCK1 and ROCK2 expressions in ventricular lysates of 6–8-month-old male DKO and control mice subjected to ponatinib treatment for 4 weeks. Rock1 and Rock2 mRNA levels were normalized with actin for quantitation (B). (C) Representative fluorescent images of control and DKO heart sections showing red (tdTomato), green (EGFP) and blue (DAPI) fluorescence. Bar, 100 mm. The procedure was through imaging freshly cut heart cryosections on fluorescence microscope. Consistent with the expected absence of EGFP protein expression in the control group, fluorescent imaging detected only tdTomato red signal in the control-ponatinib heart sections (upper panel) while DKO-ponatinib heart sections showed EGFP green signal in cardiomyocyte and tdTomato red signal in non-cardiomyocyte cells (lower panel). For statistical analysis, p-values were calculated using an unpaired two-tailed Student’s t-test for (A) and (B). N = 4–6 mice in each group. DKO, inducible cardiomyocyte-specific ROCK1 and ROCK2 double knockout; ROCKs, Rho-associated coiled-coil containing kinase; RT-PCR, reverse transcription polymerase chain reaction.
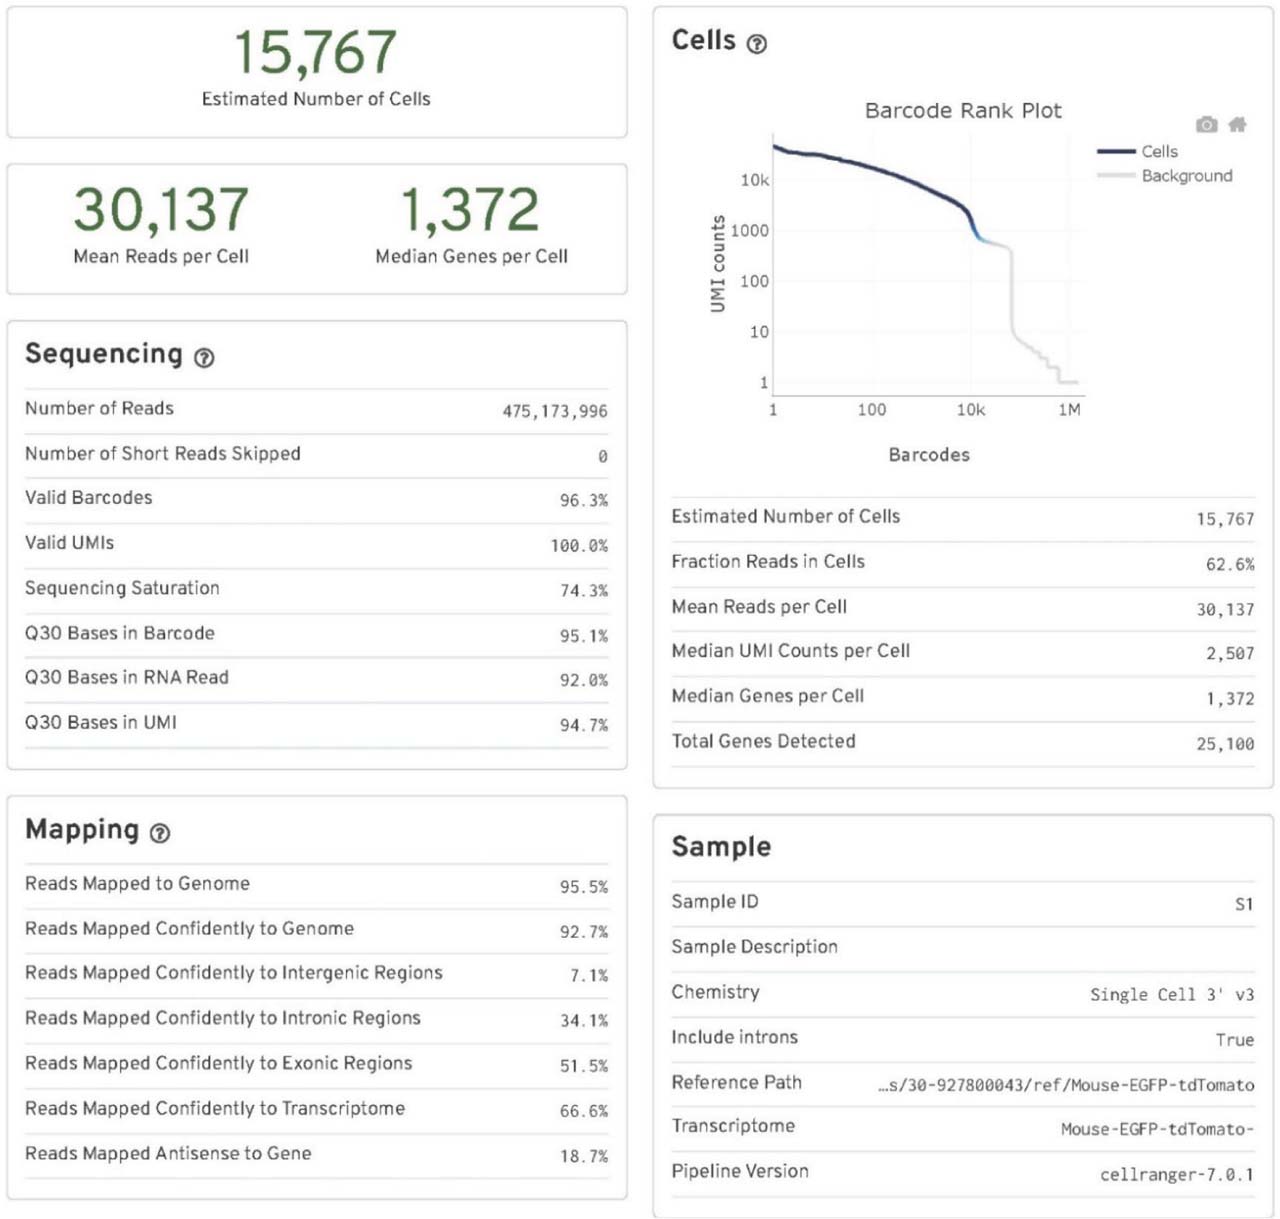
Supplementary Fig. 4.
Cell Ranger output quality control file for the control-placebo group. Key quality control parameters include the number of cells (nuclei) sequenced, mean reads per cell (nucleus), median genes per cell (nucleus), sequencing saturation, fraction reads in cells (nuclei), and reads mapped confidently to the modified Mouse-EGFP-tdTomato genome. N = 2 pooled mouse ventricles.
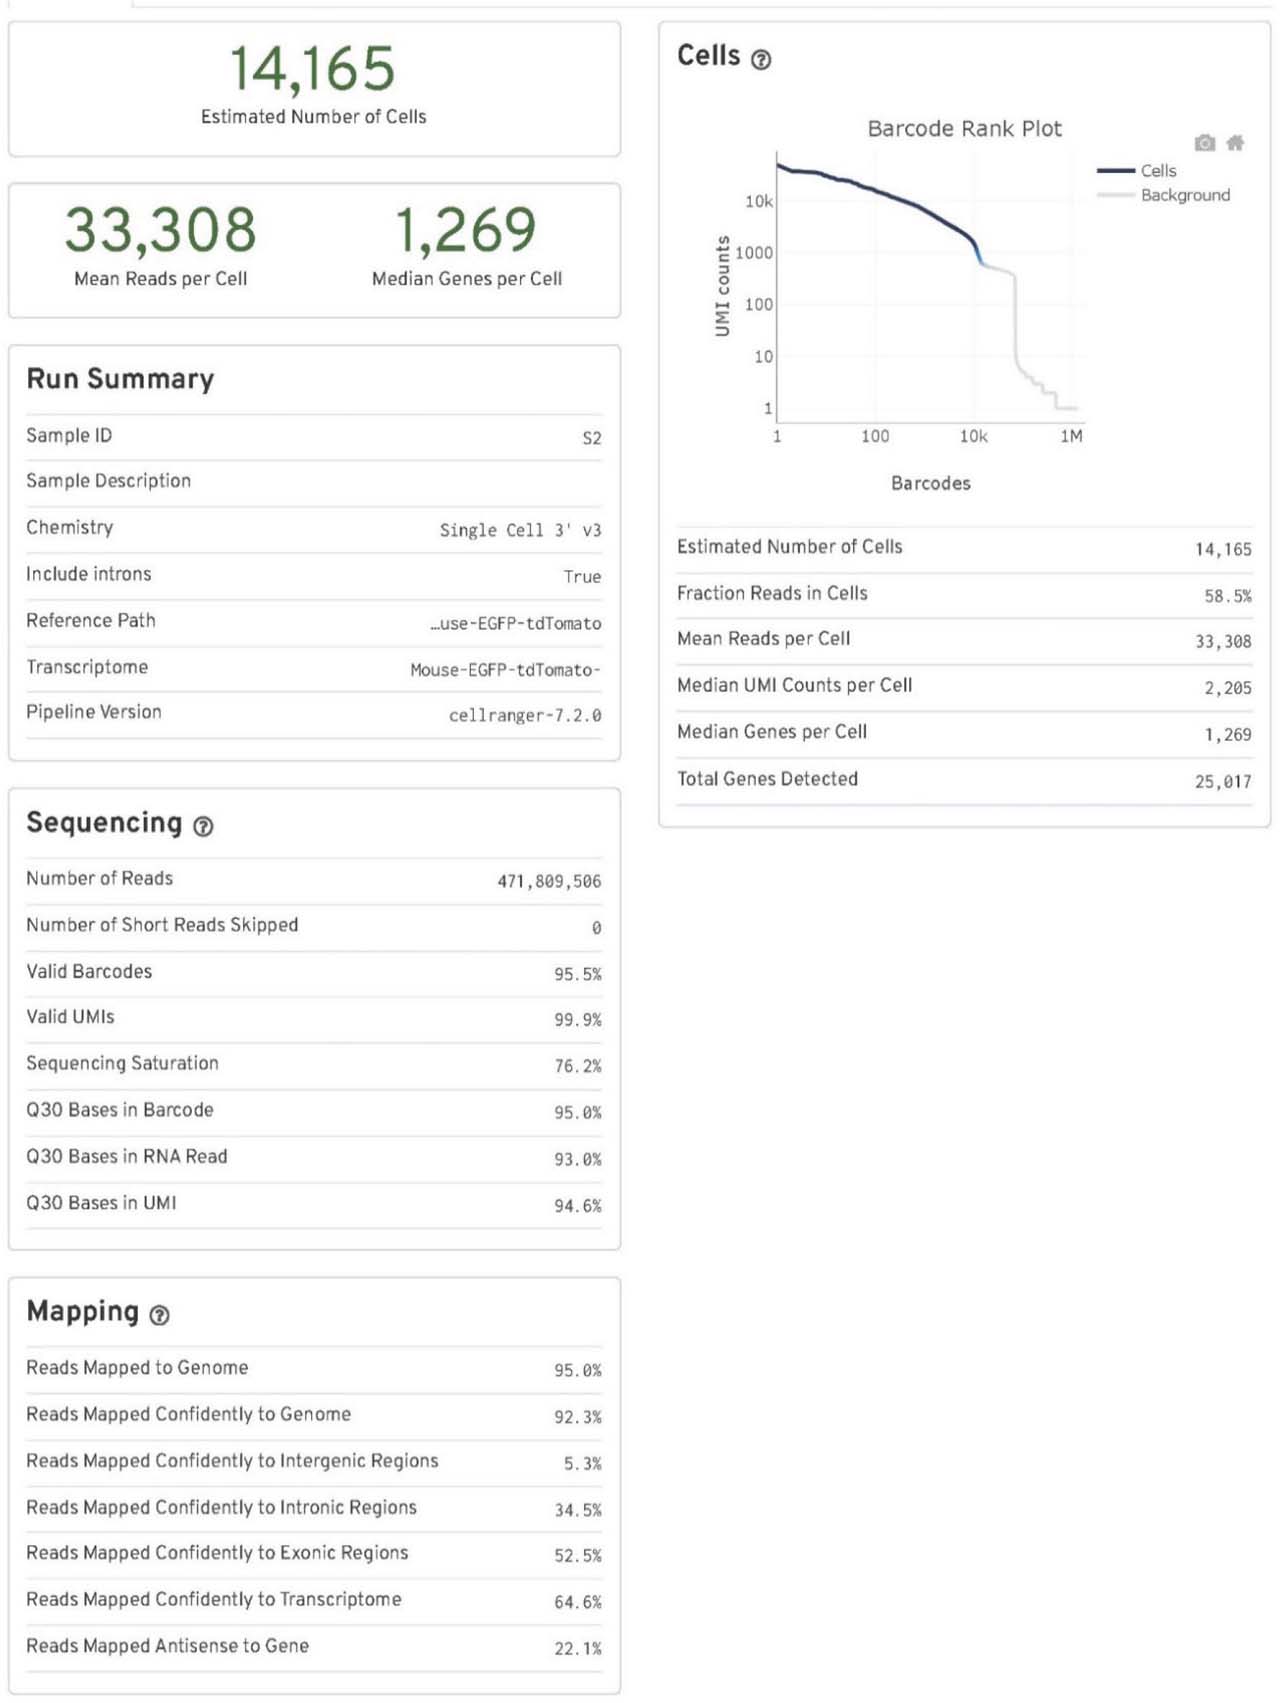
Supplementary Fig. 5.
Cell Ranger output quality control file for the DKO-placebo group. Key quality control parameters include the number of cells (nuclei) sequenced, mean reads per cell (nucleus), median genes per cell (nucleus), sequencing saturation, fraction reads in cells (nuclei), and reads mapped confidently to the modified Mouse-EGFP-tdTomato genome. N = 2 pooled mouse ventricles. DKO, inducible cardiomyocyte-specific ROCK1 and ROCK2 double knockout; ROCKs, Rho-associated coiled-coil containing kinase.
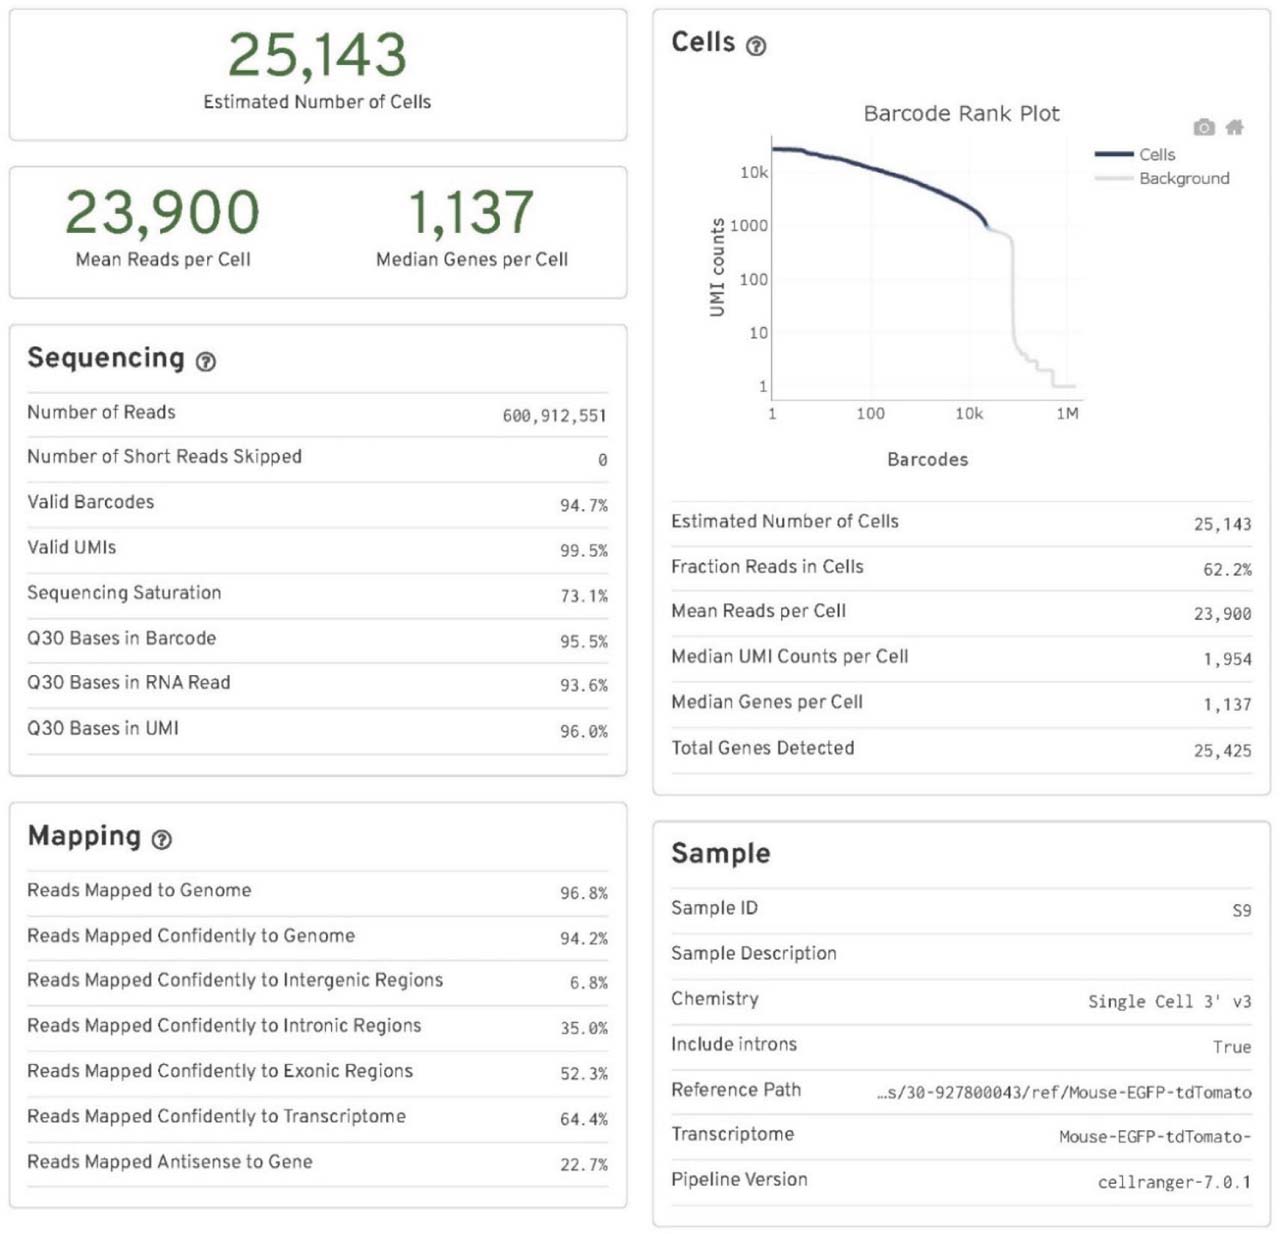
Supplementary Fig. 6.
Cell Ranger output quality control file for the control-ponatinib group. Key quality control parameters include the number of cells (nuclei) sequenced, mean reads per cell (nucleus), median genes per cell (nucleus), sequencing saturation, fraction reads in cells (nuclei), and reads mapped confidently to the modified Mouse-EGFP-tdTomato genome. N = 2 pooled mouse ventricles.
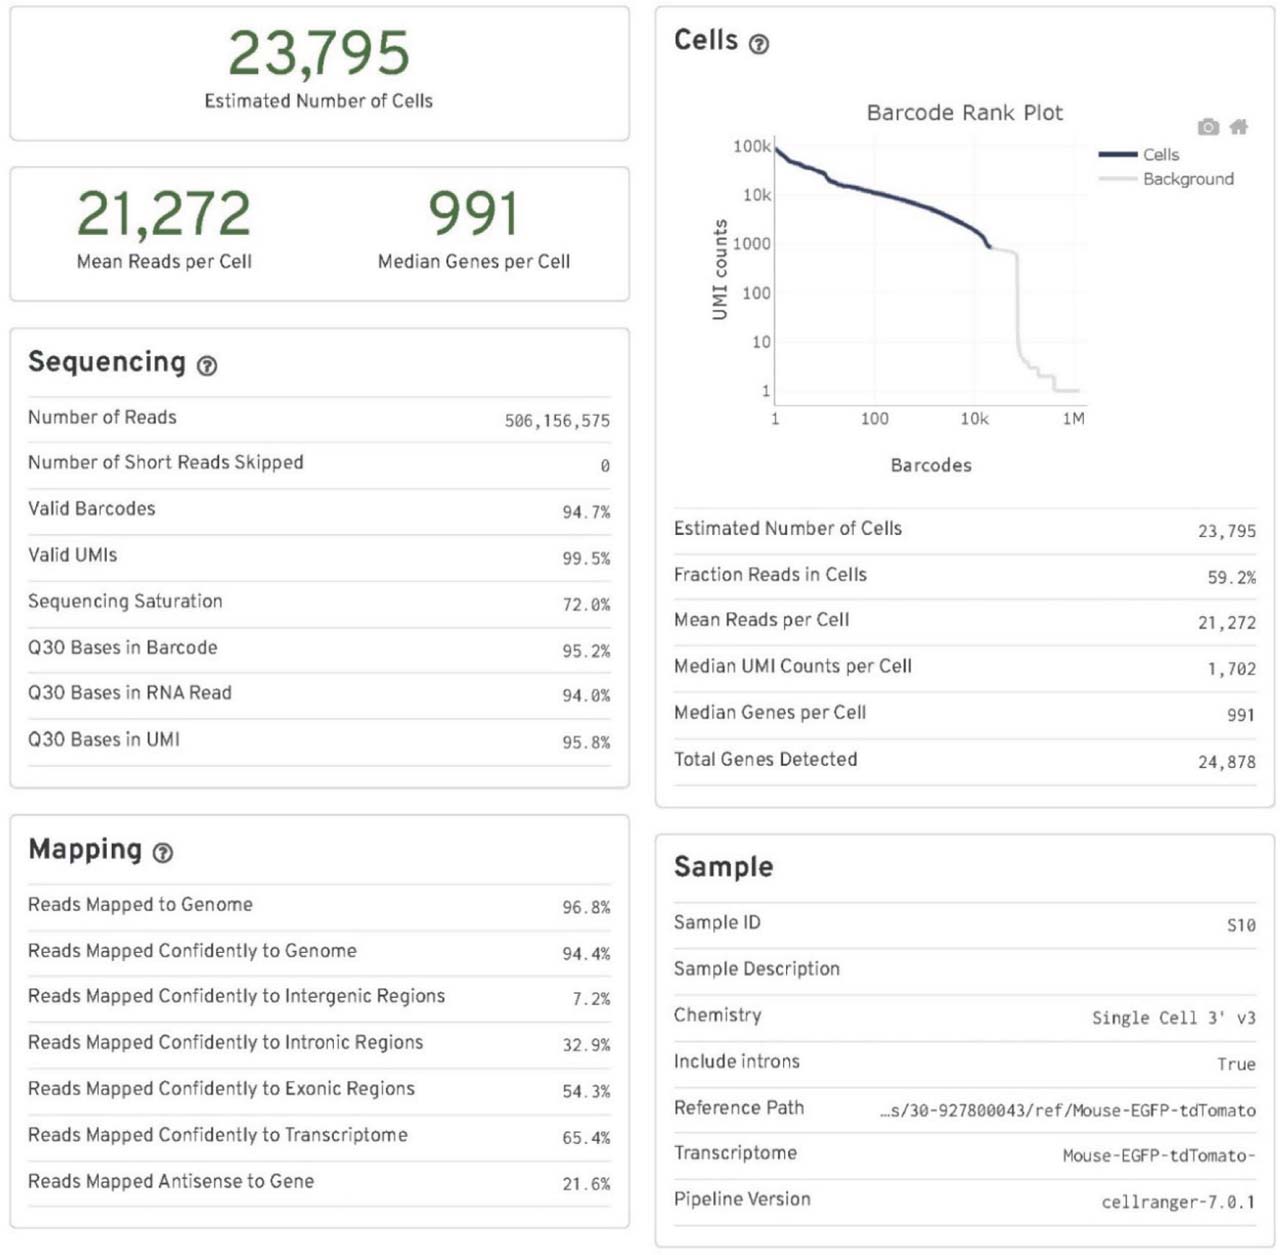
Supplementary Fig. 7.
Cell Ranger output quality control file for the DKO-ponatinib group. Key quality control parameters include the number of cells (nuclei) sequenced, mean reads per cell (nucleus), median genes per cell (nucleus), sequencing saturation, fraction reads in cells (nuclei), and reads mapped confidently to the modified Mouse-EGFP-tdTomato genome. N = 2 pooled mouse ventricles. DKO, inducible cardiomyocyte-specific ROCK1 and ROCK2 double knockout; ROCKs, Rho-associated coiled-coil containing kinase.
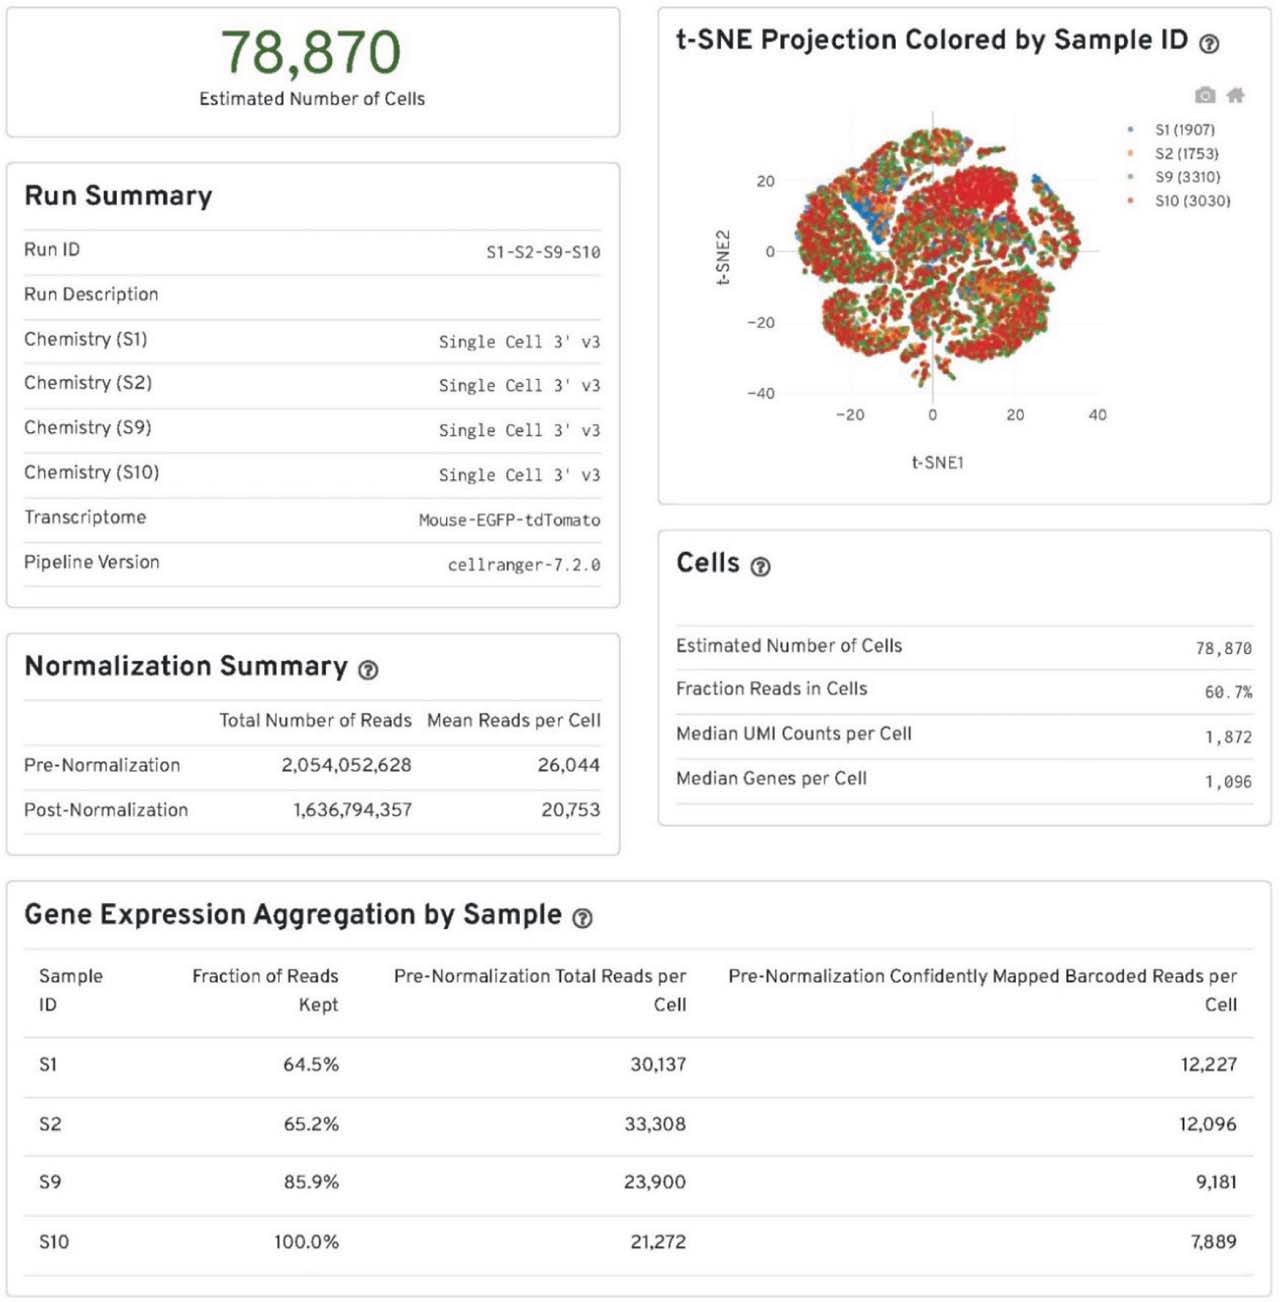
Supplementary Fig. 8.
The summary of data integration by “cellranger aggr.” The outputs from the “cellranger count” of all four groups of the samples were aggregated, normalized to the same sequencing depth and then the feature-barcode matrices were recomputed by “cellranger aggr.” S1, S2, S9 and S10 correspond to the control-placebo, DKO-placebo, control-ponatinib, DKO-ponatinib groups respectively. N = 2 pooled mouse ventricles in each group. DKO, inducible cardiomyocyte-specific ROCK1 and ROCK2 double knockout; ROCKs, Rho-associated coiled-coil containing kinase.
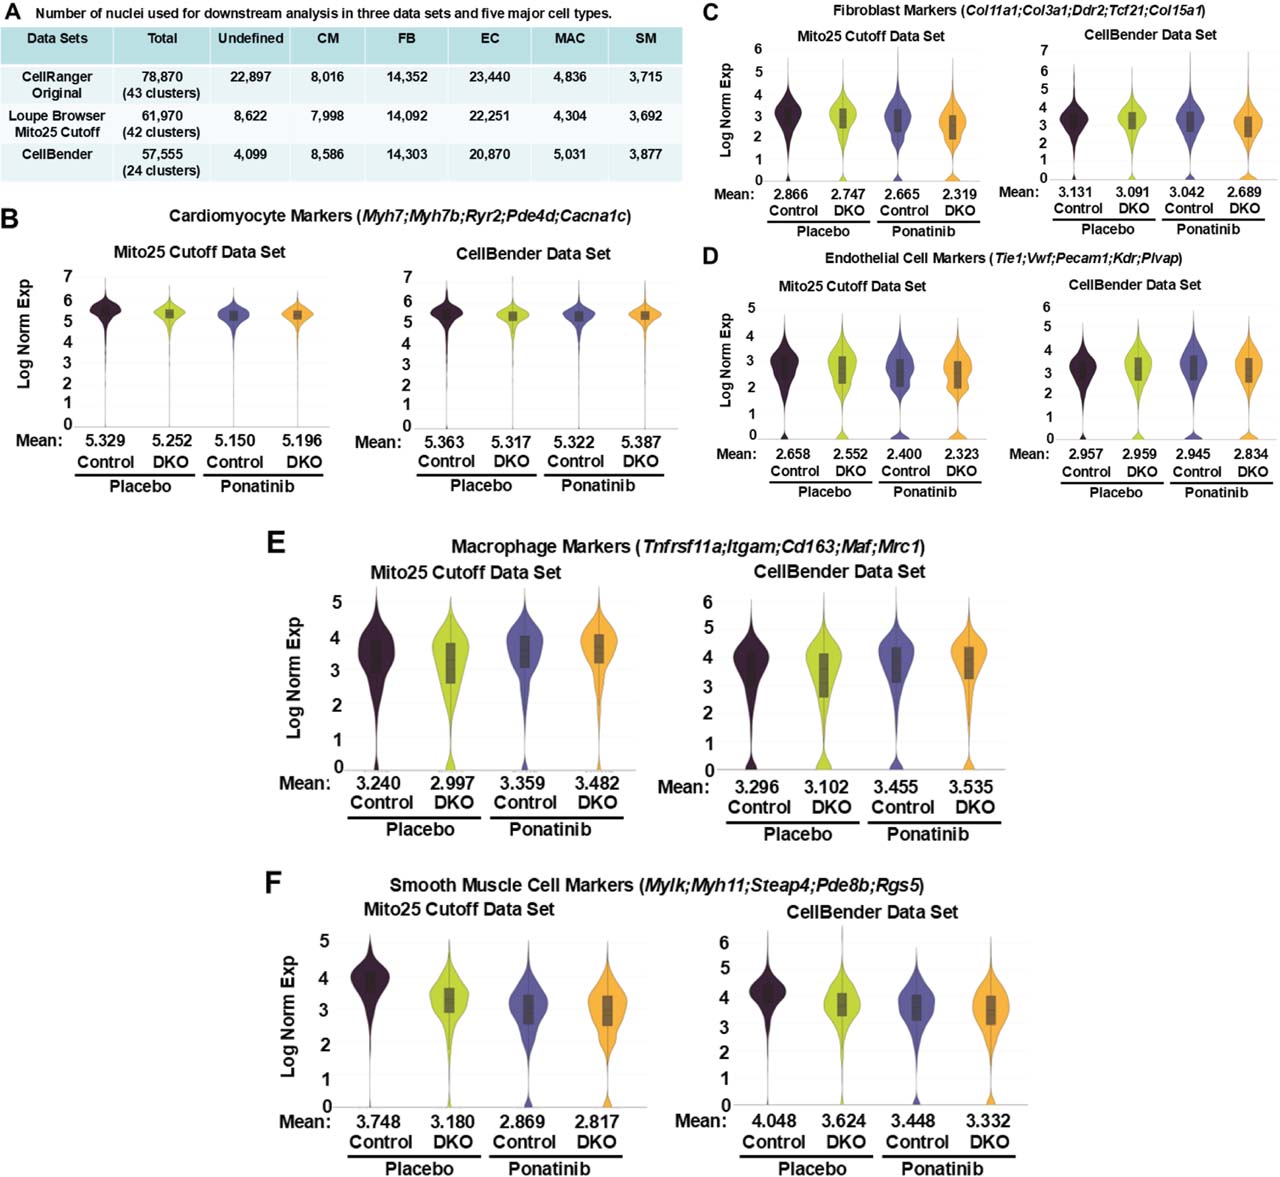
Supplementary Fig. 9.
Comparison of Loupe Browser filtering and CellBender outputs. (A) Number of nuclei in each data set and five major cell types. Three integrated data sets were used for differential gene expressions and pathway analyses performed for four groups of the samples (control-placebo, DKO-placebo, control-ponatinib, DKO-ponatinib) by Loupe Browser. CellRanger Original data set represents the initial CellRanger output without performing filtering procedure therefore containing the highest number of the UNDEF (low-quality nuclei). Loupe Browser Mito25 Cutoff data set represents the filtered and reclustered data set including removing the nuclei with more than 25% of the transcripts coming from mitochondrial genes. CellBender output represents the data set after ambient RNA removal. In both Loupe Browser Mito25 Cutoff data set and CellBender data set, a large part of nuclei in the UNDEF were removed with only minimal effects on the number of five major cell types. In addition, Loupe Browser filtering generated 42 clusters compared to 24 clusters in CellBender output. (B–F) Comparison of the major cell type gene expressions between Loupe Browser Mito25 Cutoff data set and CellBender output data set. Violin plots with the mean expression values of combined expression of five signature genes used to identify cardiomyocyte clusters (B), fibroblast clusters (C), EC clusters (D), macrophage clusters (E), and SM clusters (F) among four groups of the samples, showed similar patterns between these two data sets. DKO, inducible cardiomyocyte-specific ROCK1 and ROCK2 double knockout; EC, endothelial cells; ROCKs, Rho-associated coiled-coil containing kinase; SM, smooth muscle cells; UNDEF, undefined cluster.
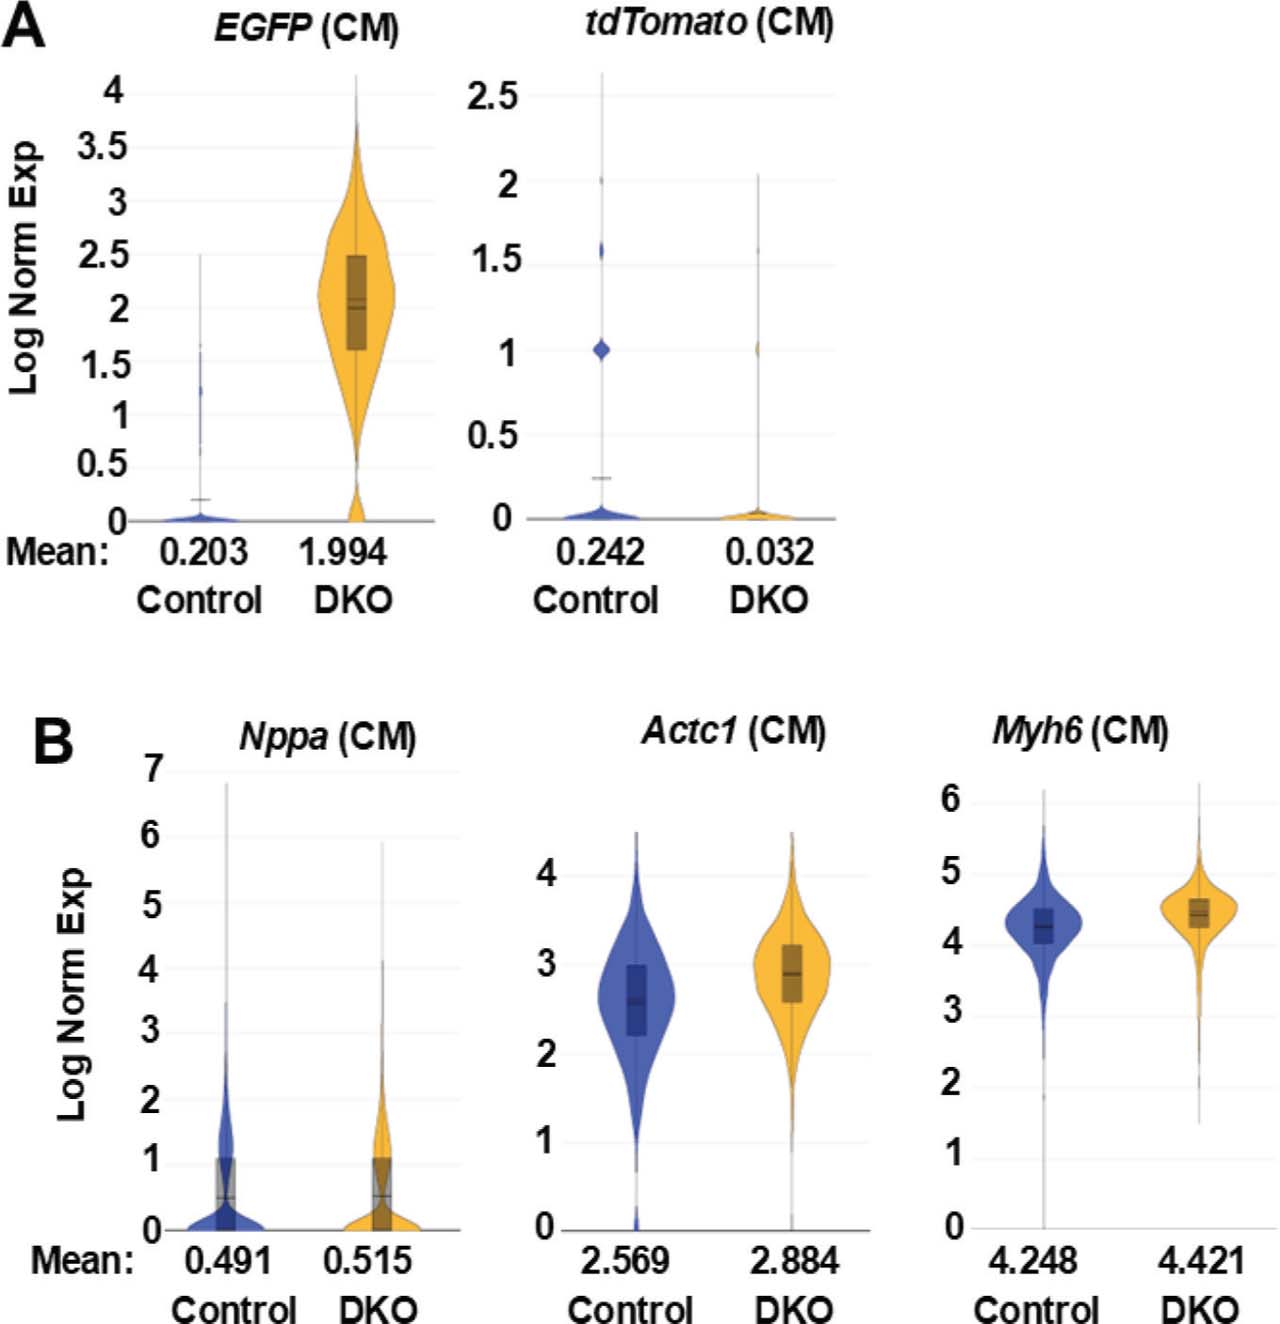
Supplementary Fig. 10.
Differential EGFP and tdTomato gene expressions in the cardiomyocyte clusters of ponatinib-treated control and DKO hearts. (A) Violin plots of EGFP and tdTomato in cardiomyocyte (CM) clusters of control-ponatinib (2946 nuclei) and DKO-ponatinib (2551 nuclei) groups, showing induction of EGFP expression and reduction of tdTomato expression in DKO cardiomyocyte compared to control cardiomyocyte, expressed as Log Normalized Expression Levels (Log Norm Exp). (B) Violin plot of three typical cardiomyocyte markers (Nppa, Actc1, Myh6) which are expressed at comparable levels in the control and DKO CM clusters. DKO, inducible cardiomyocyte-specific ROCK1 and ROCK2 double knockout; ROCKs, Rho-associated coiled-coil containing kinase.
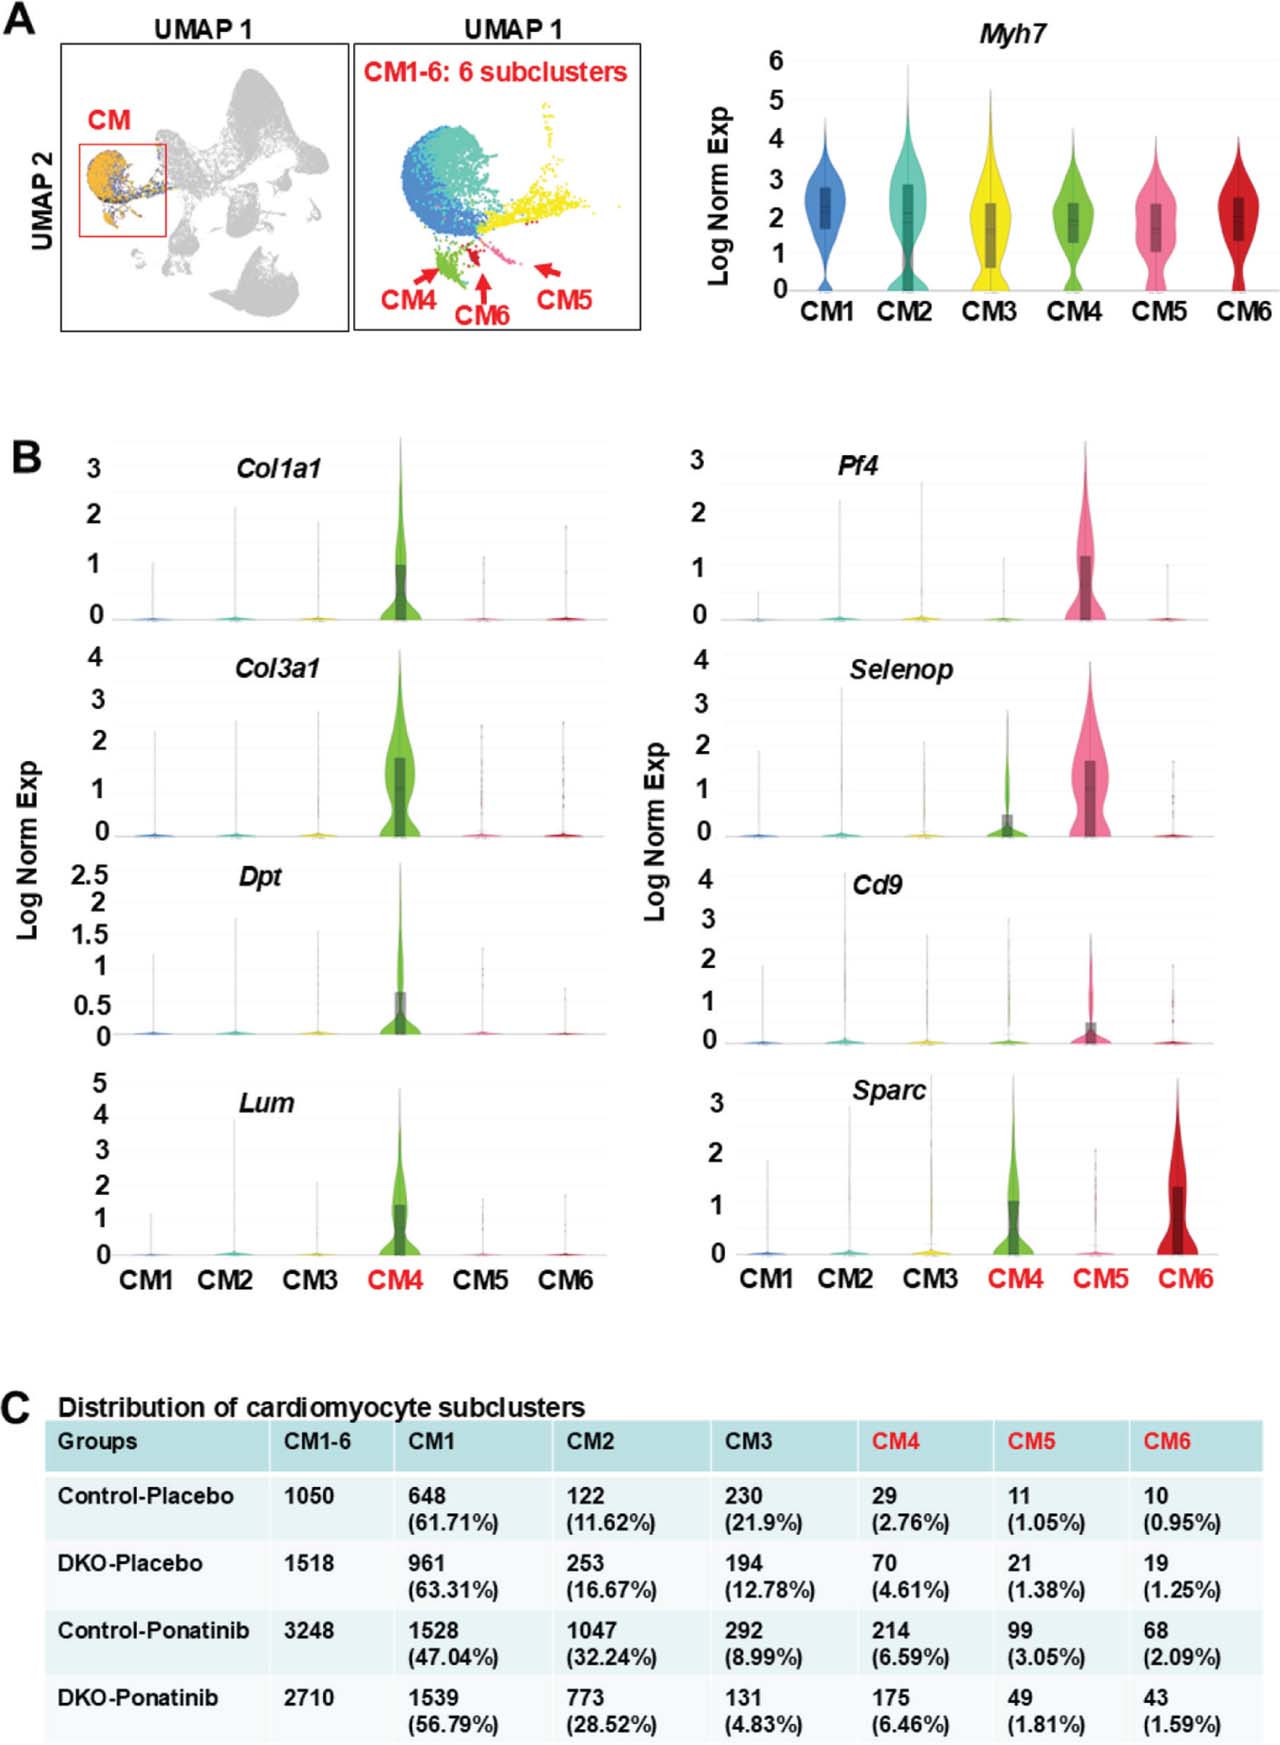
Supplementary Fig. 11.
Analyses of cardiomyocyte subclusters using the CellBender output data set showing the enrichment of ponatinib-induced non-cardiomyocyte gene expressions in individual subclusters. (A) UMAP highlighting the cardiomyocyte cluster from the aggregation of four samples (control-placebo, DKO-placebo, control-ponatinib, DKO-ponatinib) containing six distinct subclusters (CM1-6). cardiomyocyte marker Myh7 was presented across all six subclusters. (B) Violin plots, performed on six subclusters, showing CM4 expressed the highest levels of fibroblast-related DEGs (e.g. Col1a1, Col3a1, Dpt, Lum) and CM4-6 expressed the highest levels of endothelial cell- and macrophage-related DEGs (e.g. Sparc, Selenop, Cd9, Pf4). (C) Relative nuclei distribution of six sub-clusters in each of the four samples. The numbers and ratios of nuclei in each subcluster of each sample were listed. The relative nuclei distributions of CM4-6 were all increased in control-ponatinib vs. control-placebo groups, while the increases for CM5-6 were less in the DKO-ponatinib vs. control-ponatinib groups. DEGs, differentially expressed genes; DKO, inducible cardiomyocyte-specific ROCK1 and ROCK2 double knockout; ROCKs, Rho-associated coiled-coil containing kinase; UMAP, uniform manifold approximation and projection.
Supplementary Results
Establishing a ponatinib-induced CTX mouse model
Ponatinib is a highly potent Tyrosine kinase inhibitors (TKI) which induces possible CTX and vascular adverse events during the treatment of chronic myeloid leukemia (CML) and acute lymphocytic leukemia (ALL). Most pre-clinical studies using mouse models were focused on acute and short-term vascular events. To establish an optimal in vivo CTX mouse model for evaluating cardiac structural and functional damages, we tested several treatment plans including various drug delivery methods, drug dosages and treatment lengths. We first determined general drug toxicity of ponatinib in male C57 mice of 6–8 months of age with 30 mg/kg/day by oral gavage for 1 week (corresponding to the oral dosages showing therapeutic response in murine models of malignancy [O’Hare et al. 2009]) and observed that all mice well tolerated this treatment. Hence, in our subsequent experiment study, the male study mice were given ponatinib at 30 mg/kg/day for 4 weeks, and the placebo group received equal volume of DMSO in normal saline (Supplementary Figure S1a). However, longitudinal cardiac functional evaluation by echocardiography yielded no significant functional change at 4 weeks after initiating treatment (Supplementary Figure S1b,c). A trend but not significant mouse body weight reductions were documented (an index of general drug toxicity) during the 4-week treatment process (Supplementary Figure S1d) and mouse physical activity in either group was normal during the treatment period. These results suggest that although 30 mg/kg/day by oral gavage daily for 4 weeks can demonstrate therapeutic response in murine models of malignancy (O’Hare et al. 2009) with acute and short-term vascular events in mice as previously reported (Latifi et al. 2019), higher dosages (>30 mg/kg/day) or longer periods (> 4 weeks) of treatment might be required to induce CTX. When we added one more week of treatment with ponatinib of 35 mg/kg/day following the 4 weeks of 30 mg/kg/day, mouse body weight showed a small decline, but not significant. The body weight was recovered 8 weeks after stopping treatment (Supplementary Figure S1d), suggesting a mild general drug toxicity for 35 mg/kg/day dosage.
A higher dose of 40 mg/kg/day was also tested in male mice of the same physiologic condition, the placebo group also received equal volume of DMSO (Supplementary Figure S2a). Owing to the increased ponatinib dosage, both left ventricular fractional shortening (FS) and ejection fraction (EF) were significantly reduced after 10 days of treatment (Supplementary Figure S2b), a prompt of CTX ensuing. Mouse body weight showed a significant reduction in ponatinib treated group indicating general drug toxicity (Supplementary Figure S2c). Western blot for protein analysis showed significant increases of protein expression of Rho-associated coiled-coil containing kinases 1 and 2 (ROCK1 and ROCK2) in ponatinib-treated mouse hearts, associated with increased ROCK activity evaluated by the ratio of phosphor-myosin light chain2 to MLC2, a well-established substrate of ROCK (Supplementary Figure S2d).
Generation of data sets for snRNA-seq analyses
We performed single nucleus RNA sequencing (snRNA-seq) analyses on four groups of mouse hearts, control-placebo, inducible cardiomyocyte-specific ROCK1 and ROCK2 double knockout (DKO)-placebo, control-ponatinib and DKO-ponatinib. To this end, we pooled flash frozen mouse ventricles from two individual mice for each group. These samples were submitted to GENEWIZ (Azenta Life Sciences, South Plainfield, NJ, USA) for nuclei extraction, sequencing, and data analyses using the 10x Genomics Cell Ranger platform. The Cell Ranger output quality control files reported 15,767 nuclei, with 30,137 mean reads per nucleus and 1372 median genes per nucleus for the control-placebo group (Supplementary Figure S4); 14,165 nuclei, with 33,308 mean reads per nucleus and 1269 median genes per nucleus for the DKO-placebo group (Supplementary Figure S5); 25,143 nuclei, with 23,900 mean reads per nucleus and 1137 median genes per nucleus for the control-ponatinib group (Supplementary Figure S6); and 23,795 nuclei, with 21,272 mean reads per nucleus and 991 median genes per nucleus for the DKO-ponatinib group (Supplementary Figure S7). To analyze all four groups of samples together, the sample files were pooled together using the 10X Genomic’s “cellranger aggr” pipeline (Supplementary Figure S8). The gene expression from the data of combined four groups of samples were then filtered, normalized and clustered by 10x Genomics Loupe Browser v8.0 for downstream analyses.
Initial analysis by Loupe Browser started with 78,870 nuclei (named CellRanger Original data set) including all nuclei from four groups of the samples (Supplementary Figure S8). Unsupervised clustering in Graph-Based Clustering mode generated 43 clusters (Supplementary Figure S9). In our snRNA data analysis, we removed low-quality nuclei using the “Reanalyze” mode on the Loupe Browser which provides an interactive filtering and reclustering workflow. After quality filtering, the remaining 61,970 nuclei (named Loupe Browser Mito25 Cutoff data set) across four samples were then reclustered. Unsupervised clustering in Graph-Based Clustering mode generated 42 clusters (Supplementary Figure S9).
In addition to performing quality control by Loupe Browser, we also performed a computational procedure to remove ambient RNA and technical artifacts from snRNA-seq data with CellBender. The CellBender output data set with 57,555 nuclei was then compared with Loupe Browser Mito25 Cutoff data set (Supplementary Figure S9). The comparison of the major cell type gene expressions between Loupe Browser Mito25 Cutoff data set and CellBender output data set among four groups of samples showed similar patterns (Supplementary Figure S9). In both data sets, a large part of nuclei in the undefined low-quality cluster were removed with only minimal effects on the number of five major cell types. A major difference is that Loupe Browser Mito25 Cutoff data set contains 42 clusters in Graph-Based Clustering mode compared to 24 clusters in CellBender output. As the overall goals of the downstream analyses involve five major cell type clusters and their subclusters, the subsequent downstream analyses were mainly focused on Loupe Browser Mito25 Cutoff data set which contains more clusters. We used CellBender data set to validate some of the results from Loupe Browser Mito25 Cutoff data set if presenting uncertainties.
Differential gene expression analysis of EGFP and tdTomato in cardiomyocyte clusters supported the fluorescence microscopic imaging data
DKO-ponatinib heart sections showed ubiquitous EGFP green signal in cardiomyocytes and scattered tdTomato red signal in non-cardiomyocyte cells while control-ponatinib heart sections only showed ubiquitous tdTomato red signal (Supplementary Figure S3c). Consistent with the fluorescence microscopic imaging data, expression distribution analysis with Loupe Browser indicates that positive EGFP expression was induced, in contrast, tdTomato expression was suppressed in cardiomyocyte cluster of DKO-ponatinib group ascribed to Cre-mediated recombination (Supplementary Figure S10a), while both control and DKO groups displayed cardiomyocyte markers in comparable expression levels in their cardiomyocyte clusters (Supplementary Figure S10b). To quantitatively count EGFP or tdTomato positive nuclei, we utilized “Advanced Selection” mode on the Loupe Browser. Consistent with the expression distribution results, the number of nuclei expressing EGFP was much higher in the DKO-ponatinib cardiomyocyte cluster (2430 nuclei, 95.26% of its total nuclei) compared to the control-ponatinib cardiomyocyte cluster (505 nuclei, 17.14% of its total nuclei), increasing by 5.56 folds. Meanwhile the number of nuclei expressing tdTomato was much lower in the DKO-ponatinib cardiomyocyte cluster (78 nuclei, 3.06% of its total nuclei) compared to the control-ponatinib cardiomyocyte cluster (615 nuclei, 20.88% of its total nuclei), decreasing by 6.82 folds.
It was noted the following two aspects regarding the outputs of snRNA-seq: 1) in the control group, only 615 nuclei (20.88% of its total nuclei) expressed tdTomato (regardless of EGFP positivity) rather than in all cardiomyocytes of this group as expected, suggesting that the nuclear RNA levels of tdTomato are not high enough to be detected in all cardiomyocytes in the current snRNA-seq experiment; 2) in the control group, 505 nuclei (17.14% of its total nuclei) expressed EGFP (regardless of tdTomato positivity), and this unexpected positivity of EGFP in the absence of Cre-mediated recombination is likely due to the detection of unprocessed nuclear EGFP RNA in the context of snRNA-seq as both tdTomato and EGFP sequences are in tandem under the same promoter in the ROSA26 locus (Muzumdar et al. 2007). Removing tdTomato gene by Cre-mediated recombination in DKO cardiomyocytes resulted in more efficient transcription of EGFP gene and dramatic increases of its unprocessed RNA levels (Supplementary Figure S10a).
Similar analysis was performed with CellBender output data set. DKO-ponatinib cardiomyocyte cluster (2699 nuclei) was compared with control-ponatinib cardiomyocyte cluster (3242 nuclei). The findings are similarly to those from the Loupe Browser Mito25 Cutoff data set, provided evidence of induction of EGFP expression in DKO (mean = 0.227 in control vs. 1.129 in DKO) and reduction of tdTomato expression (mean = 0.265 in control vs. 0.030 in DKO). The number of nuclei expressing EGFP was 61.61% (from 1663 nuclei) in DKO group vs. 17.21% (from 558 nuclei) in control group, increasing in DKO cardiomyocytes by 3.58 folds. In addition, the number of nuclei expressing tdTomato in DKO group was 2.74% (from 74 nuclei), while the number in control group was 20.97% (from 680 nuclei), decreasing in DKO cardiomyocytes by 7.65 folds.
Comparing the CellBender data set with Loupe Browser Mito25 Cutoff, we noted that the induction of EGFP expression (mean = 1.129) and the number of nuclei expressing EGFP (61.61%) in DKO-ponatinib group were lower in CellBender data set compared to the Loupe Browser Mito25 Cutoff (mean = 1.994, 95.26%). CellBender processing removed background RNA counts due to more abundant gene expressions in cardiomyocytes than in other cell types. This procedure appears to remove more cardiomyocytes enriched RNA counts in the DKO group compared to the control group due to elevated level of EGFP and Esr1 expressions attributable to MCM in DKO group. Therefore, for the subsequent differential gene expression and pathway analyses, we focused on those identified in the Loupe Browser Mito25 Cutoff data set, as CellBender data set in most cases generated more differentially expressed genes (DEGs) than the Loupe Browser Mito25 Cutoff data set which may in part due to possible more aggressive background subtraction of the DKO group vs.control group.
References
Latifi Y, Moccetti F, Wu M et al. (2019) Thrombotic microangiopathy as a cause of cardiovascular toxicity from the BCR-ABL1 tyro-sine kinase inhibitor ponatinib. Blood 133:1597–1606. https://doi.org/10.1182/blood-2018-10-881557
Y LatifiF MoccettiM Wu2019Thrombotic microangiopathy as a cause of cardiovascular toxicity from the BCR-ABL1 tyro-sine kinase inhibitor ponatinibBlood13315971606https://doi.org/10.1182/blood-2018-10-881557
Muzumdar MD, Tasic B, Miyamichi K et al. (2007) A global double-fluorescent Cre reporter mouse. Genesis 45:593–605. https://doi.org/10.1002/dvg.20335
MD MuzumdarB TasicK Miyamichi2007A global double-fluorescent Cre reporter mouseGenesis45593605https://doi.org/10.1002/dvg.20335
O’Hare T, Shakespeare WC, Zhu X et al. (2009) AP24534, a pan-BCR-ABL inhibitor for chronic myeloid leukemia, potently inhibits the T315I mutant and overcomes mutation-based resistance. Cancer Cell 16:401–412. https://doi.org/10.1016/j.ccr.2009.09.028
T O’HareWC ShakespeareX Zhu2009AP24534, a pan-BCR-ABL inhibitor for chronic myeloid leukemia, potently inhibits the T315I mutant and overcomes mutation-based resistanceCancer Cell16401412https://doi.org/10.1016/j.ccr.2009.09.028