
Table 1.
Patients'characteristics
| N = 287 | % | |
|---|---|---|
| Recipient sex | ||
| M/F | 167/120 | 58.19/41.81 |
| Donor-Recipient sex match | ||
| Male to male | 127 | 44.25 |
| Male to female | 69 | 24.04 |
| Female to female | 48 | 16.72 |
| Female to male | 39 | 13.59 |
| Donor type | ||
| MUD | 94 | 32.75 |
| MMUD | 16 | 5.58 |
| MSD | 115 | 40.07 |
| Haploidentical | 62 | 21.60 |
| Recipient conditioning | ||
| MAC | 148 | 51.57 |
| RIC | 135 | 47.70 |
| NMA | 3 | 1.04 |
| GvHD prophylaxis | ||
| CSA + MTX | 188 | 65.51 |
| PTCy + TAC + MMF | 50 | 17.42 |
| CSA + MMF | 7 | 2.44 |
| TAC + MTX | 3 | 1.05 |
| TAC + MMF | 3 | 1.05 |
| Other | 36 | 12.54 |
| CMV IgG status | ||
| Recipient positive | 234 | 81.15 |
| Donor positive | 189 | 65.85 |
| Post-transplant complications | ||
| aGvHD | 114 | 39.72 |
| grade I | 54 | 18.82 |
| grade II | 41 | 14.29 |
| grades II-IV | 19 | 6.62 |
| cGvHD | 59 | 20.56 |
| CMV infection | 101 | 35.19 |
| Relapse | 45 | 15.68 |
| Death | 48 | 16.72 |
[i] CMV, cytomegalovirus; CSA, cyclosporine A; MAC, myeloablative conditioning; MMF, mycophenolate mofetil; MMUD, mismatched unrelated donor; MSD, matched sibling donor; MTX, methotrexate; MUD, matched unrelated donor; NMA, non-myeloablative conditioning; PTCy, Post-transplant cyclophosphamide; RIC, reduced intensity conditioning; TAC, tacrolimus.
Table 2.
Characteristics of selected SNPs in NCR genes
| Gene | rs number | Allelic variants | Consequence | Amino acid | MAF | Position |
|---|---|---|---|---|---|---|
| NCR1 | rs2278428 | C > A | Missense variant | Q (Gln) > K (Lys) | 0.08 | chr19:54906696 |
| rs34549987 | C > T | Intron variant (potential TFBS) | N/A | 0.46 | chr19:54905596 | |
| rs1433097 | C > T | Intron variant (potential TFBS) | N/A | 0.16 | chr19:54907100 | |
| NCR2 | rs2236369 | T > C | Missense variant | S (Ser) > P (Pro) | 0.41 | chr6:41341814 |
| rs9394782 | T > C | Initiator codon variant | M (Met) > T (Thr) | 0.33 | chr6:41335854 | |
| rs2273962 | A > G | Missense variant | M (Met) > V (Val) | 0.23 | chr6:41350700 | |
| NCR3 | rs11575836 | A > G | 5'UTR variant (potential TFBS) | N/A | 0.13 | chr6:31592925 |
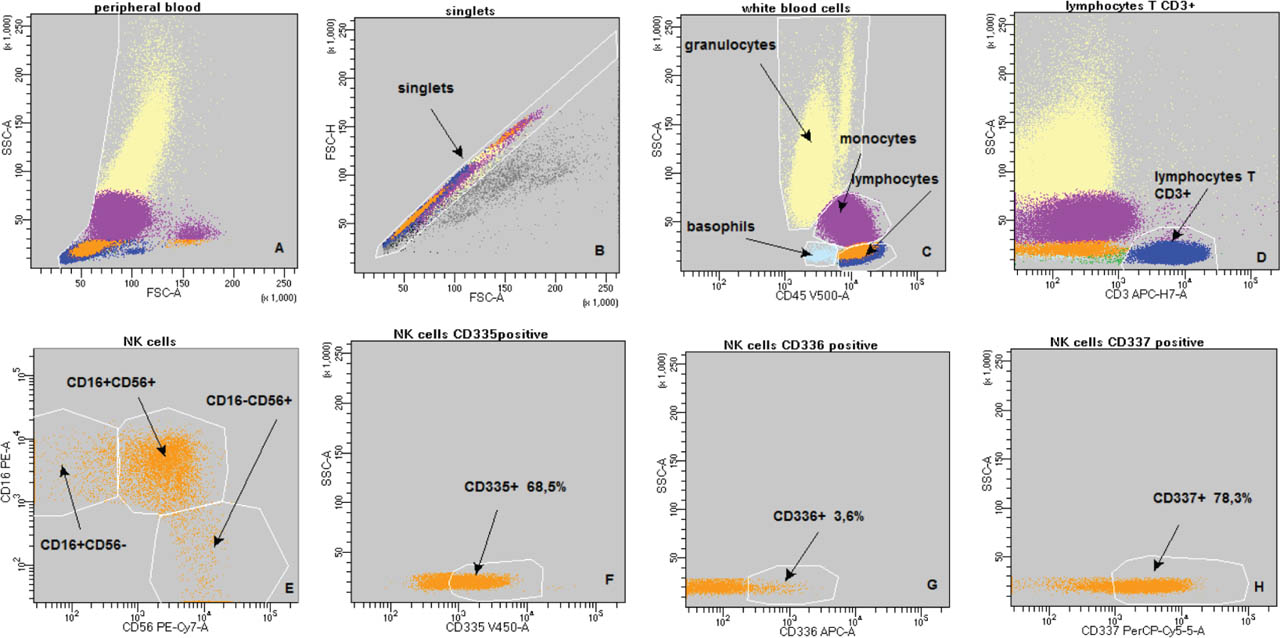
Fig 1.
The gating strategy: (A–H): singlets in peripheral blood after excluding doublets and debris; dark blue—lymphocytes T CD3+; orangeNK cells; pink—monocytes; yellow—granulocytes; blue—basophils. (A) discrimination of debris (FSC-A vs. SSC-A); (B) discrimination of doublets (FSC-A vs. FSC-H); (C) gating of the peripheral blood leukocyte populations (CD45 vs. SSC-A); (D) lymphocytes T CD3+ and NK cells—(CD3 vs. SSc-A); (E) NK cell subpopulations (CD56 vs. CD16); (F) NK cells CD335 positive (CD335 vs. SSc-A); (G) NK cells CD336 positive (CD336 vs. SSc-A); (H) NK cells CD337 positive (CD337 vs. SSc-A).
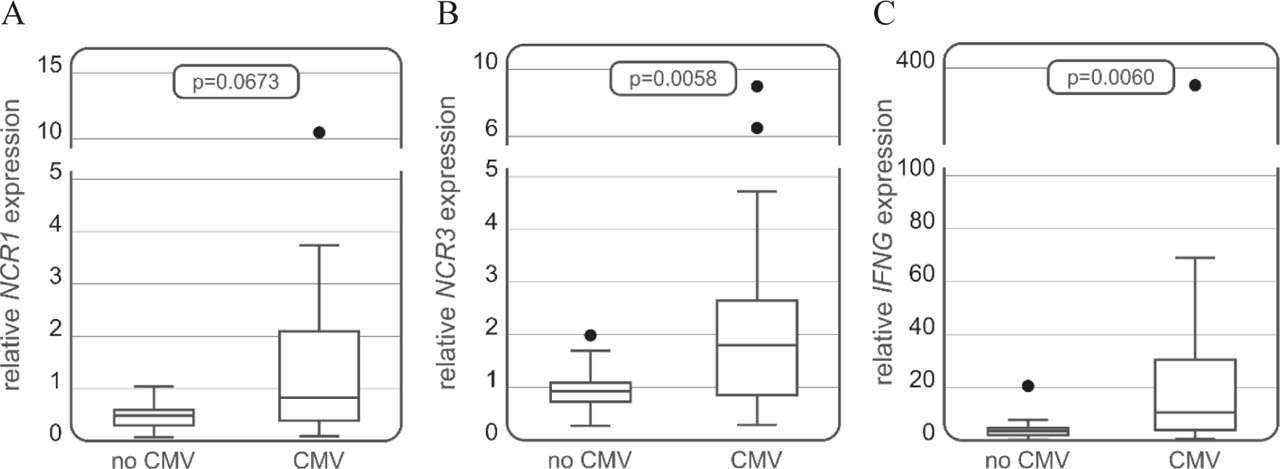
Fig 2.
Differences in the expression of genes encoding NCR1 and NCR3 receptors and IFN-γ (IFNG) in HSCT patients with CMV infection and in patients without complications. (A) NCR1 expression level in CMV-positive patients vs. patients without complications; (B) NCR3 expression level in CMV-positive patients vs. patients without complications; (C) IFNG expression level in CMV-positive patients vs. patients without complications. CMV, cytomegalovirus; HSCT, hematopoietic stem cell transplantation.
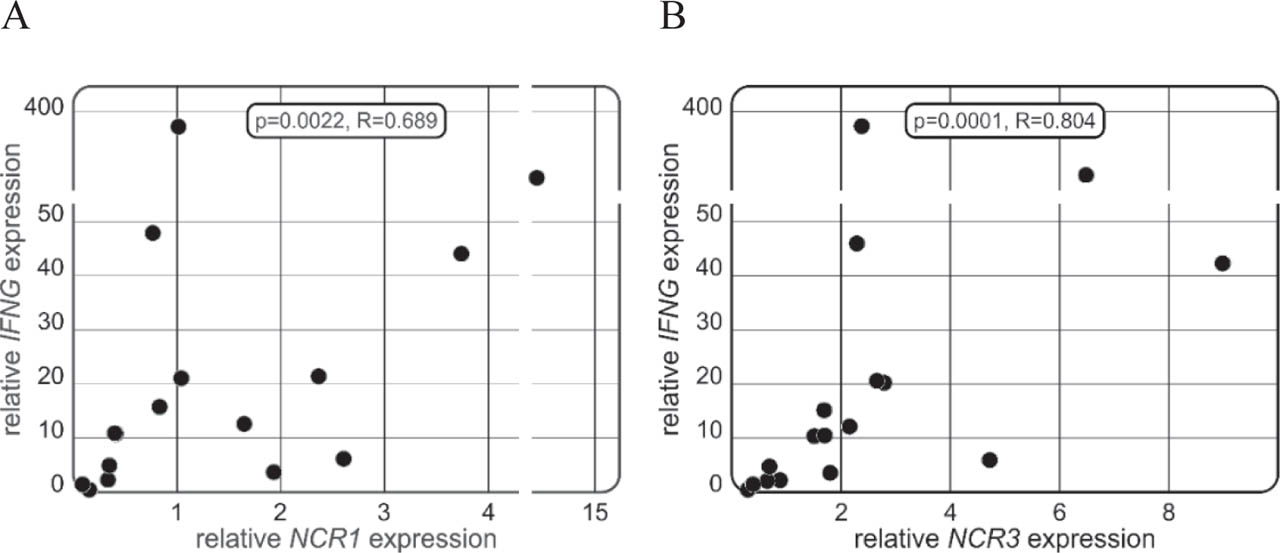
Fig 3.
Correlation between INF-γ (IFNG) expression and NCR1 and NCR3 genes (A,B) in patients with CMV infection after HSCT. A strong correlation between IFNG and both NCR1 and NCR3 can be observed. CMV, cytomegalovirus; HSCT, hematopoietic stem cell transplantation.
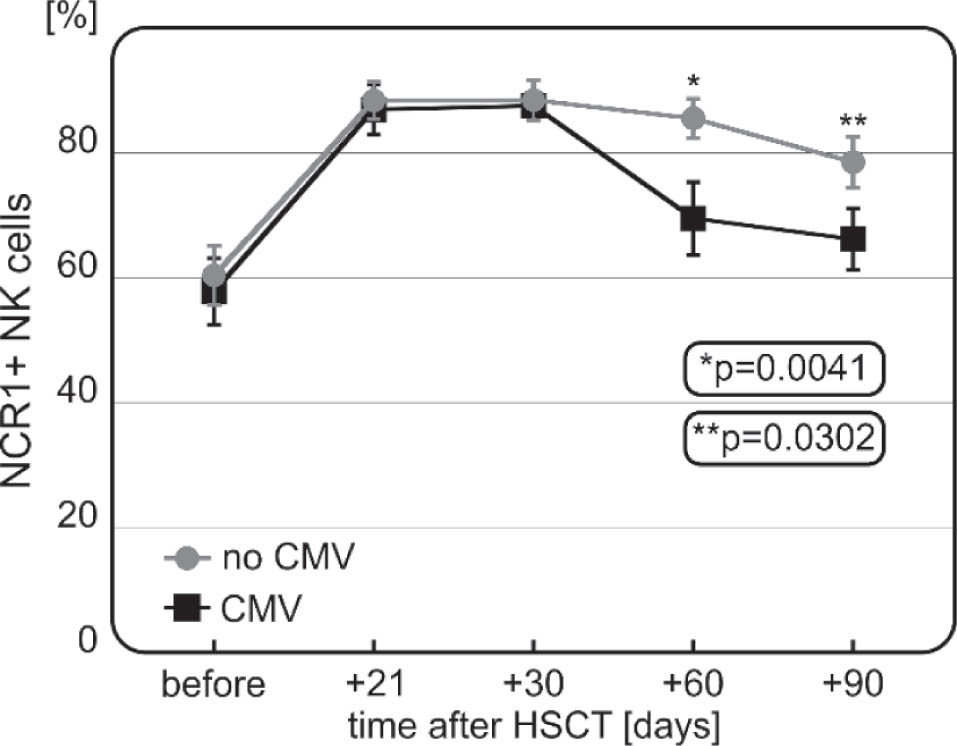
Fig 4.
Change over time in the percentage of NK cells expressing the NCR1 receptor in patients with or without CMV infection post-HSCT. CMV, cytomegalovirus; HSCT, hematopoietic stem cell transplantation; NK, natural killer.
Table 3.
Distribution of genotypes in NCR genes in HSCT recipients and donors
| Gene | rs number | Allel/Genotype | Donors n = 120 [%] | Recipients n = 279 [%] |
|---|---|---|---|---|
| NCR1 | rs2278428 | C | 13 [5.42] | 34 [6.09] |
| A | 227 [94.58] | 524 [93.91] | ||
| CC | 0 [0.00] | 8 [2.87] | ||
| AA | 107 [89.17] | 253 [90.68] | ||
| CA | 13 [10.83] | 18 [6.45] | ||
| rs34549987 | C | 125 [52.08] | 305 [54.66] | |
| T | 115 [47.92] | 253 [45.34] | ||
| CC | 38 [31.67] | 82 [29.39] | ||
| TT | 33 [27.50] | 56 [20.07] | ||
| CT | 49 [40.83] | 141 [50.54] | ||
| rs1433097 | C | 29 [12.39] | 75 [54.35] | |
| T | 205 [87.61] | 63 [45.65] | ||
| CC | 1 [0.85] | 6 [2.19] | ||
| TT | 89 [76.07] | 205 [74.82] | ||
| CT | 27 [23.08] | 63 [22.99] | ||
| NCR2 | rs2236369 | T | 109 [45.42] | 239 [42.83] |
| C | 131 [54.58] | 319 [57.17] | ||
| TT | 19 [15.83] | 46 [16.49] | ||
| CC | 30 [25.00] | 86 [30.82] | ||
| TC | 71 [59.17] | 147 [52.69] | ||
| rs9394782 | T | 91 [37.92] | 202 [36.20] | |
| C | 149 [62.08] | 356 [63.80] | ||
| TT | 13 [10.83] | 34 [12.19] | ||
| CC | 42 [35.00] | 111 [39.78] | ||
| TC | 65 [54.17] | 134 [48.03] | ||
| rs2273962 | A | 80 [33.33] | 159 [28.49] | |
| G | 160 [66.67] | 399 [71.51] | ||
| AA | 10 [8.33] | 26 [9.32] | ||
| GG | 50 [41.67] | 146 [52.33] | ||
| AG | 60 [50.00] | 107 [38.35] | ||
| NCR3 | rs11575836 | A | 207 [86.25] | 502 [89.96] |
| G | 33 [13.75] | 56 [10.04] | ||
| AA | 90 [75.00] | 225 [80.65] | ||
| GG | 3 [2.50] | 2 [0.72] | ||
| AG | 27 [22.50] | 52 [18.64] |
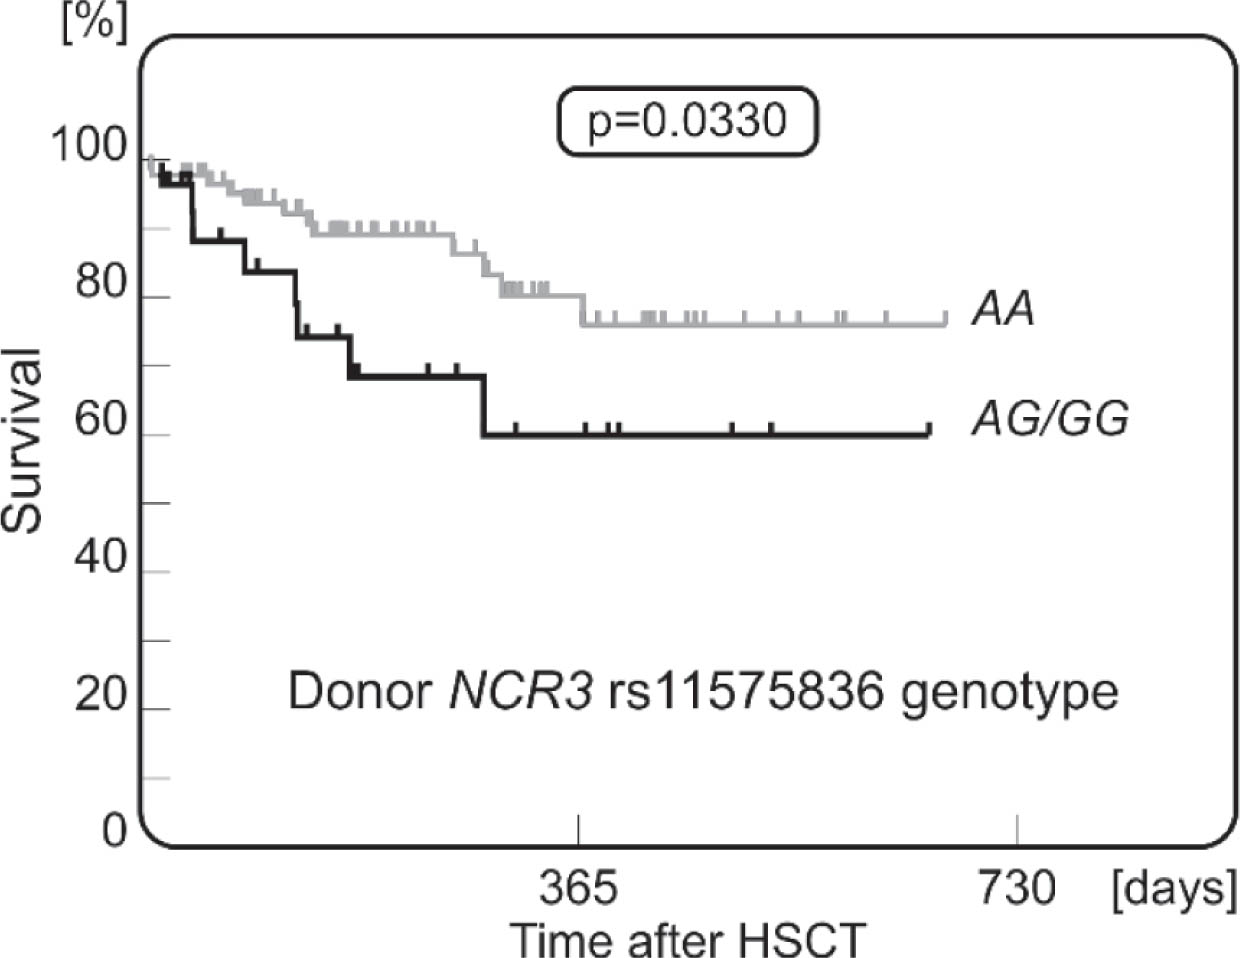
Fig 5.
Kaplan–Meier survival curves of patients post-HSCT stratified by donor NCR3 rs11575836 genotype. Patients transplanted from the NCR3 rs11575836 AA homozygous donors were characterized with better overall survival. HSCT, hematopoietic stem cell transplantation.
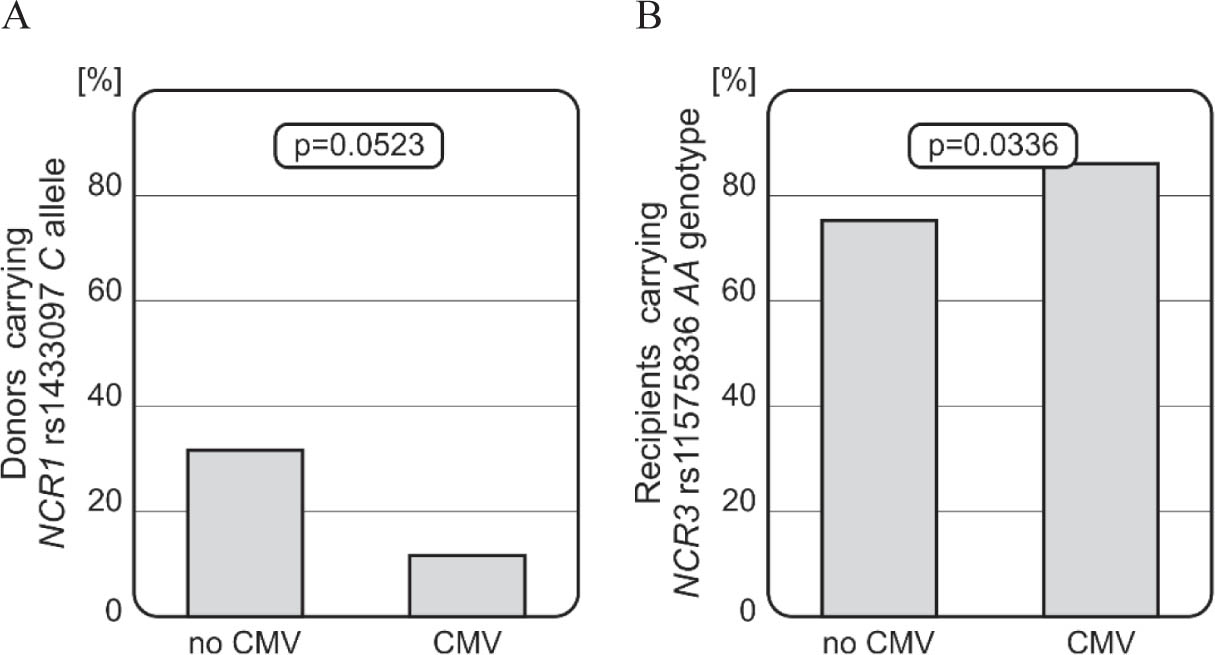
Fig 6.
Relationship between NCR1 rs1433097 donor genotype (A) and NCR3 rs11575836 recipient genotype (B) and risk of CMV infection after HSCT. CMV, cytomegalovirus; HSCT, hematopoietic stem cell transplantation.