
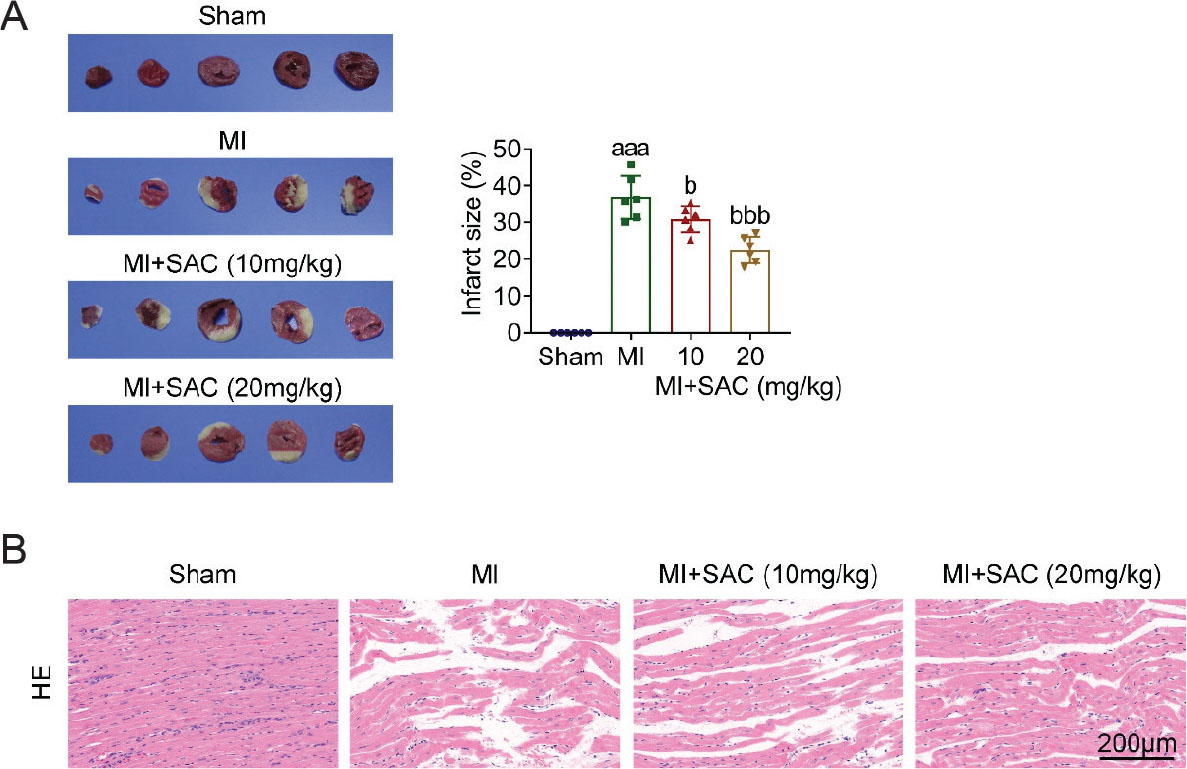
Fig 1.
SAC alleviated the infarct size in MI rats. Groups were separated into the Sham, MI, MI + SAC (10 mg/kg), and MI + SAC (20 mg/kg) groups. (A) The infarct size of the heart in rats was assessed through TTC staining. (B) Myocardial histopathological damage was evaluated by HE staining. aaap < 0.001 vs the Sham group; bp < 0.05, bbbp < 0.001 vs the MI group HE, hematoxylin-eosin; MI, myocardial infarction; SAC, salvianolic acid C; TTC, triphenyltetrazolium chloride.
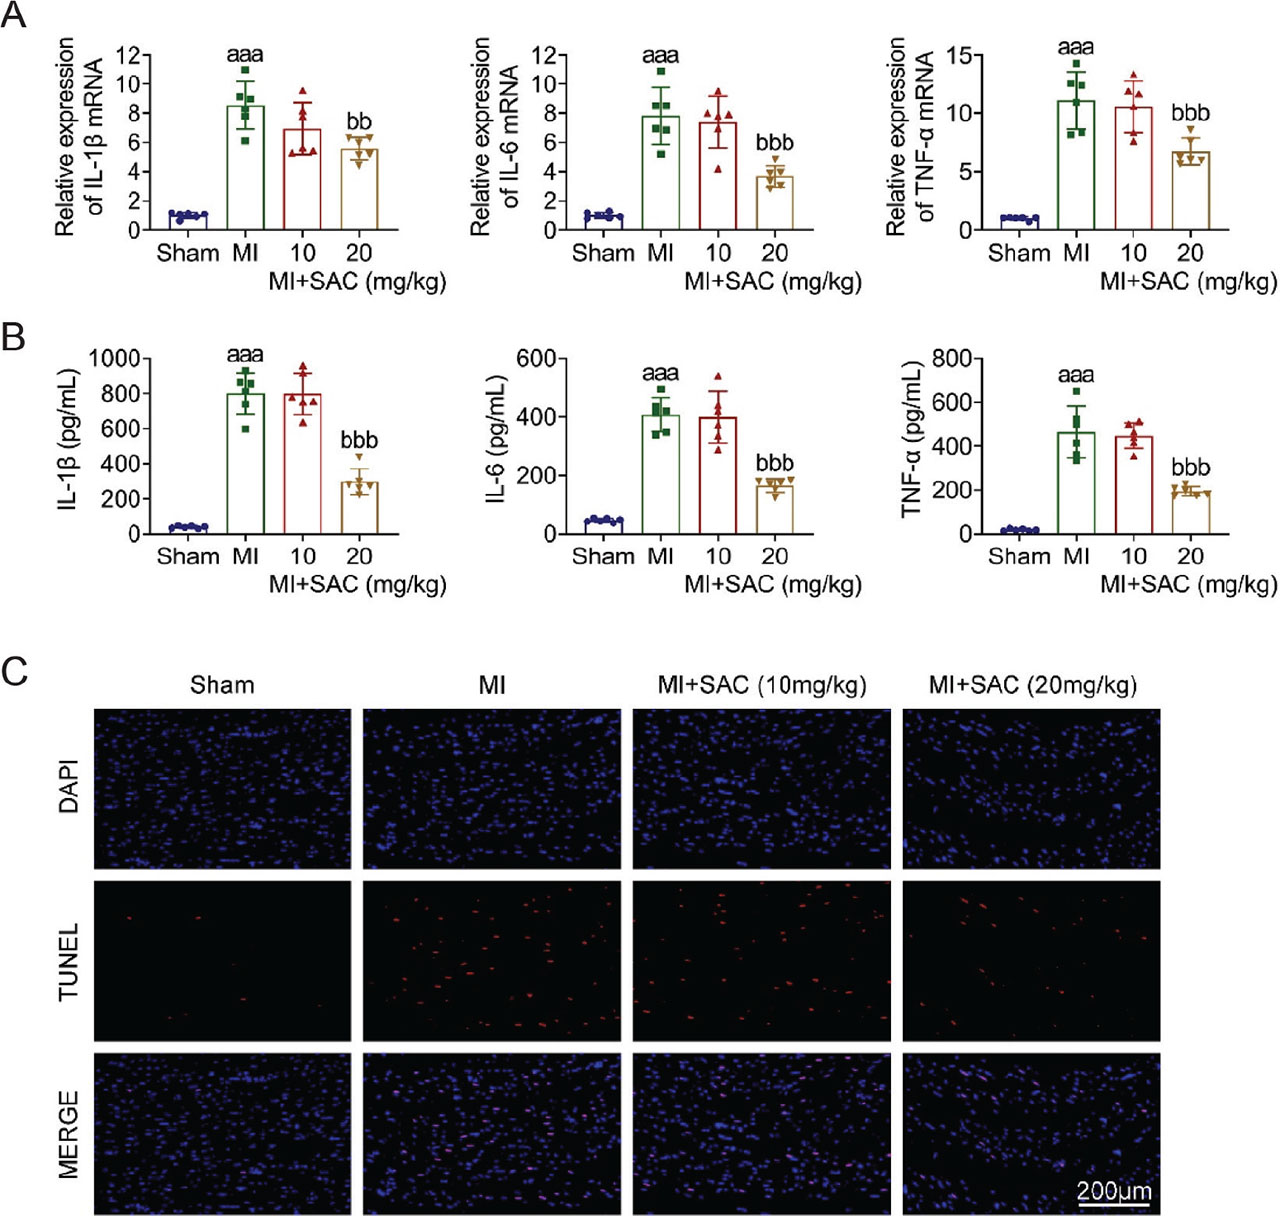
Fig 2.
Groups were separated into the Sham, MI, MI + SAC (10 mg/kg), and MI + SAC (20 mg/kg) groups. (A) mRNA expressions of IL-1β, IL-6, and TNF-α were examined through RT-qPCR. (B) The levels of IL-1β, IL-6, and TNF-α were tested through ELISA. (C) Cardiomyocyte apoptosis in myocardial tissues was evaluated through the TUNEL assay.
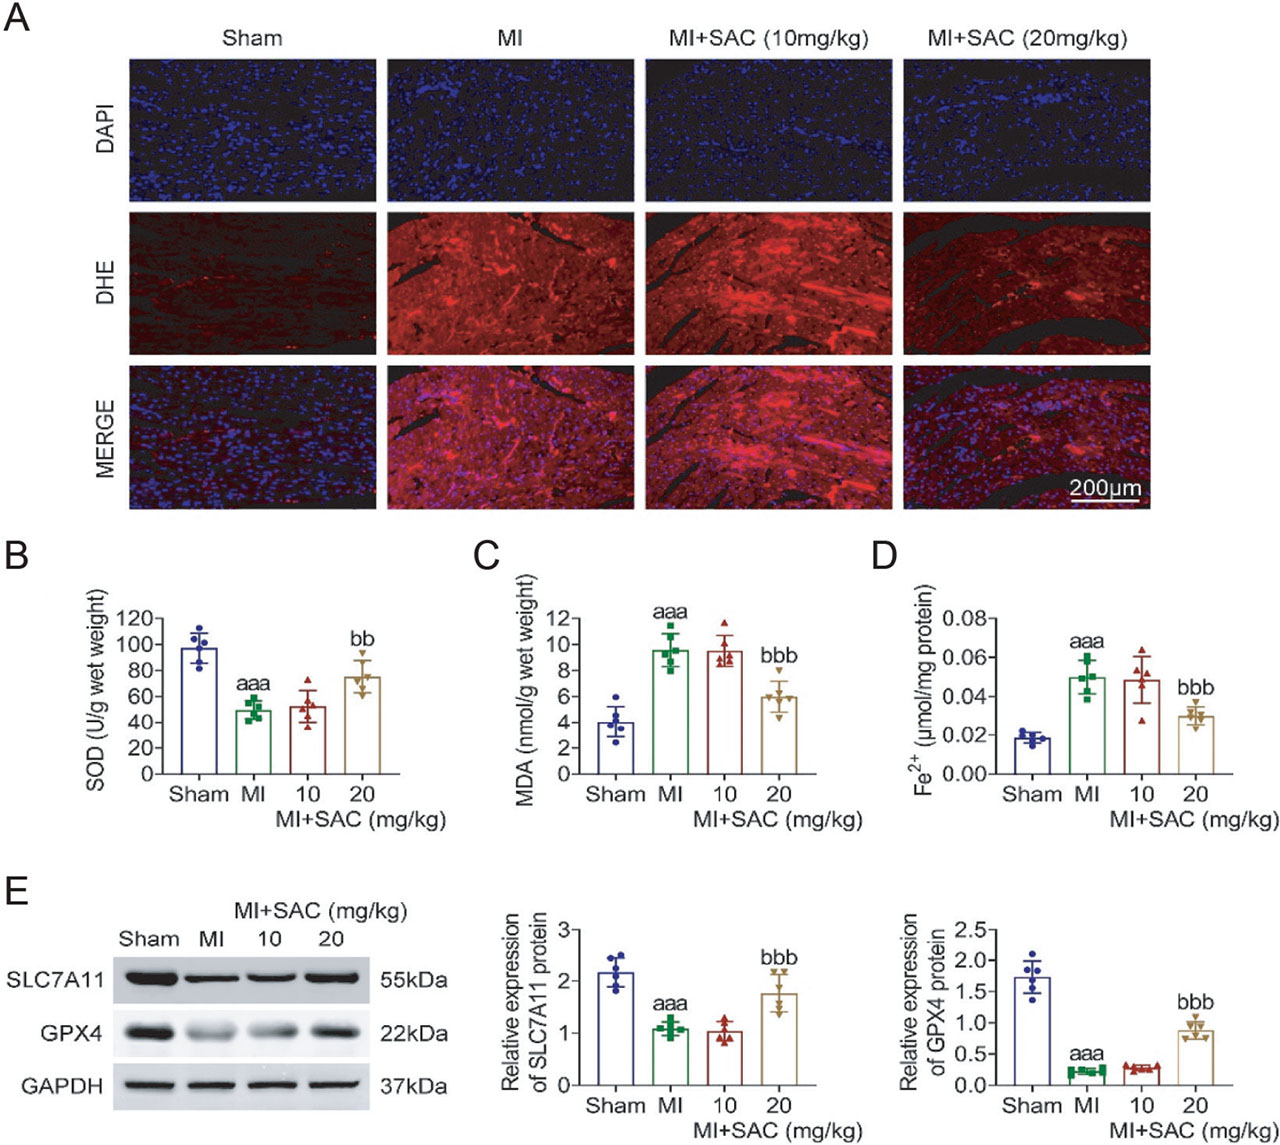
Fig 3.
SAC suppressed ferroptosis in MI rats. Groups were separated into the Sham, MI, MI + SAC (10 mg/kg), and MI + SAC (20 mg/kg) groups. (A) The ROS level was measured through DHE staining. (B–D) The levels of SOD, MDA, and Fe2+ were examined through the corresponding kits. (E) The protein expressions of SLC7A11 and GPX4 were assessed through Western blot. aaap < 0.001 vs the Sham group; bbp < 0.01, bbbp < 0.001 vs the MI group DHE, dihydroethidium; GAPDH, glyceraldehyde-3-phosphate dehydrogenase; MDA, malondialdehyde; MI, myocardial infarction; ROS, reactive oxygen species; SAC, salvianolic acid C; SOD, superoxide dismutase.
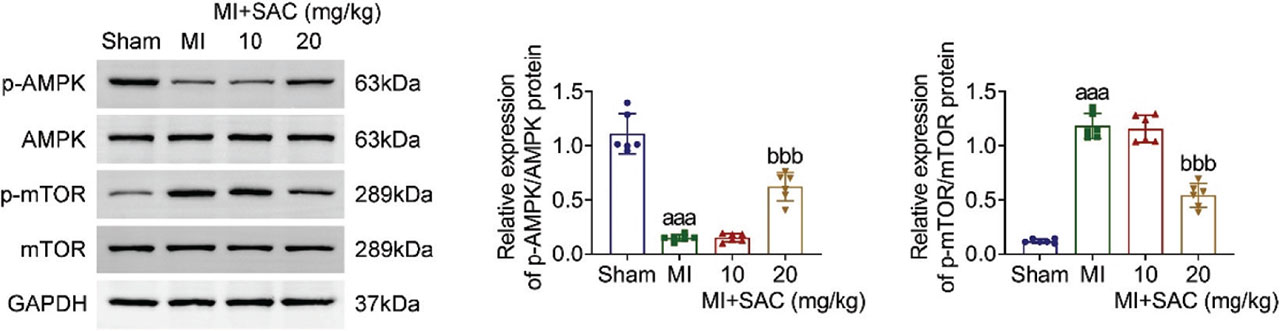
Fig 4.
SAC evoked the AMPK pathway. Groups were separated into the Sham, MI, MI + SAC (10 mg/kg), and MI + SAC (20 mg/kg) groups. The protein expressions of p-AMPK, AMPK, p-mTOR, and mTOR were determined through western blot. aaap < 0.001 vs the Sham group; bbbp < 0.001 vs the MI group GAPDH, glyceraldehyde-3-phosphate dehydrogenase; MI, myocardial infarction; SAC, salvianolic acid C.
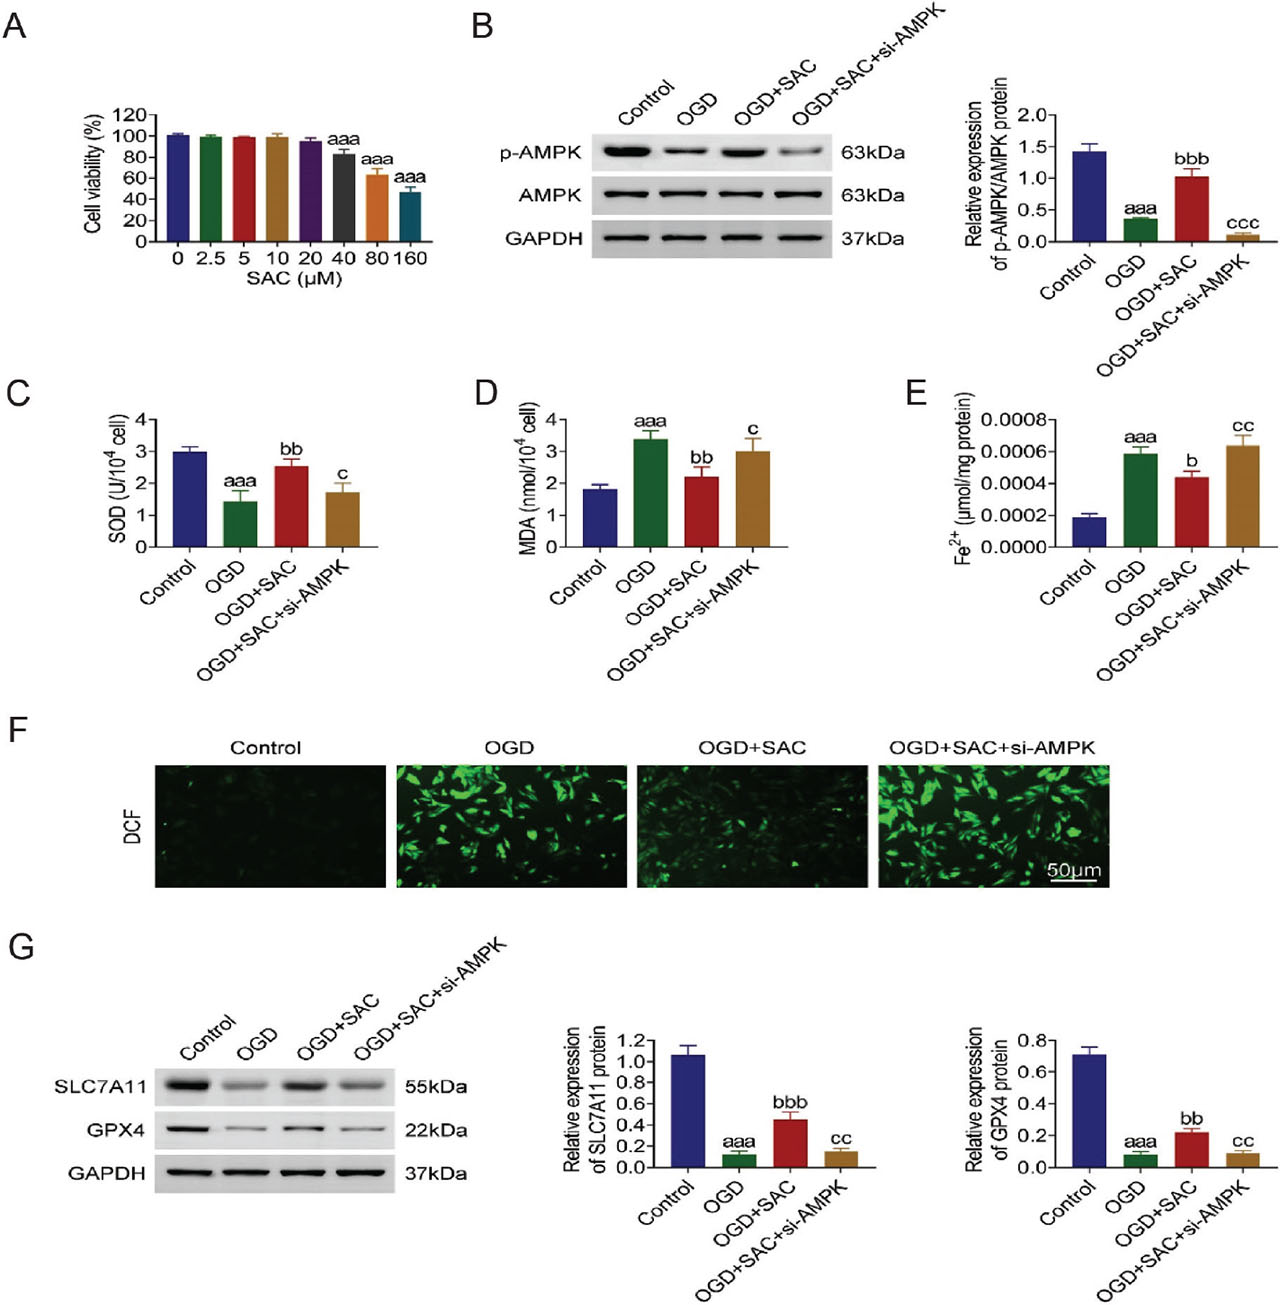
Fig 5.
SAC triggered the AMPK pathway to ameliorate cardiomyocyte damage mediated by OGD. (A) The cell viability was inspected through CCK-8 assay in the 0, 2.5, 5, 10, 20, 40, 80, and 160 μM SAC groups. (B) The protein expressions of p-AMPK and AMPK were assessed through western blot in the control, OGD, OGD + SAC, and OGD + SAC + si-AMPK groups. (C–E) The levels of SOD, MDA, and Fe2+ were examined through the corresponding kits in the control, OGD, OGD + SAC, and OGD + SAC + si-AMPK groups. (F) The ROS level was tested through DCF staining in the control, OGD, OGD + SAC, and OGD + SAC + si-AMPK groups. (G) The protein expressions of SLC7A11 and GPX4 were measured through western blot in the control, OGD, OGD + SAC, and OGD + SAC + si- AMPK groups. aaap < 0.001 vs the control group; bp < 0.05, bbp < 0.01, bbbp < 0.001 vs the OGD group; cp < 0.05, ccp < 0.01, cccp < 0.001 vs the OGD + SAC group CCK-8, cell counting kit-8; DCF, dichlorofluorescein; GAPDH, glyceraldehyde-3-phosphate dehydrogenase; MDA, malondialdehyde; OGD, oxygen-glucose deprivation; ROS, reactive oxygen species; SAC, salvianolic acid C.
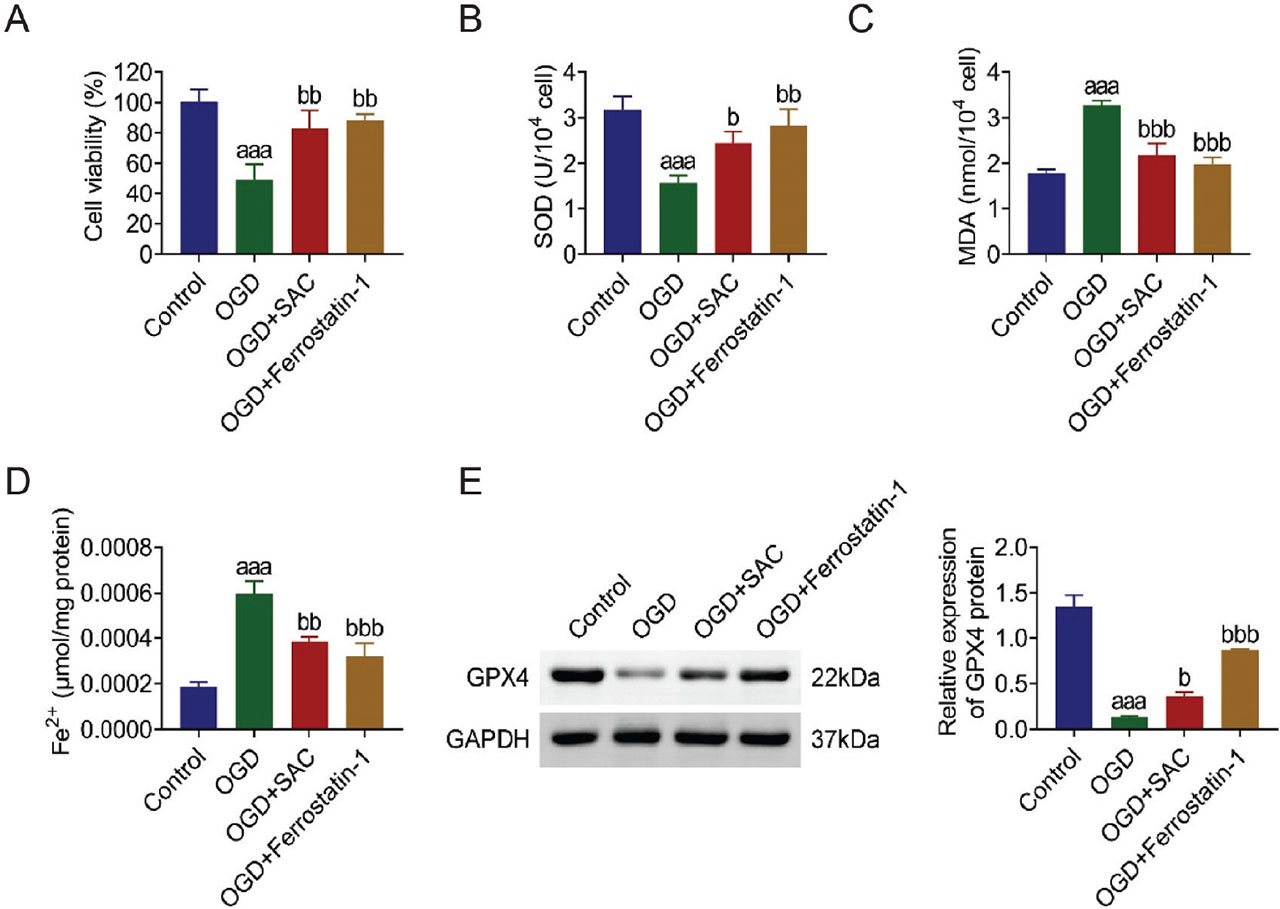
Fig S1.
SAC and Ferrostatin-1 both can affect MI progression. Groups were separated into the control, OGD, OGD + SAC, and OGD + errostatin-1 groups. (A) The cell viability was inspected through the CCK-8 assay. (B–D) The levels of SOD, MDA, and Fe2+ were examined through the corresponding kits. (E) The protein expression of GPX4 was measured through western blot. aaap < 0.001 vs the control group; bp < 0.05, bbp < 0.01, bbbp < 0.001 vs the OGD group CCK-8, cell counting kit-8; GAPDH, glyceraldehyde-3-phosphate dehydrogenase; MDA, malondialdehyde; MI, myocardial infarction; OGD, oxygen-glucose deprivation; SAC, salvianolic acid C; SOD, superoxide dismutase.