
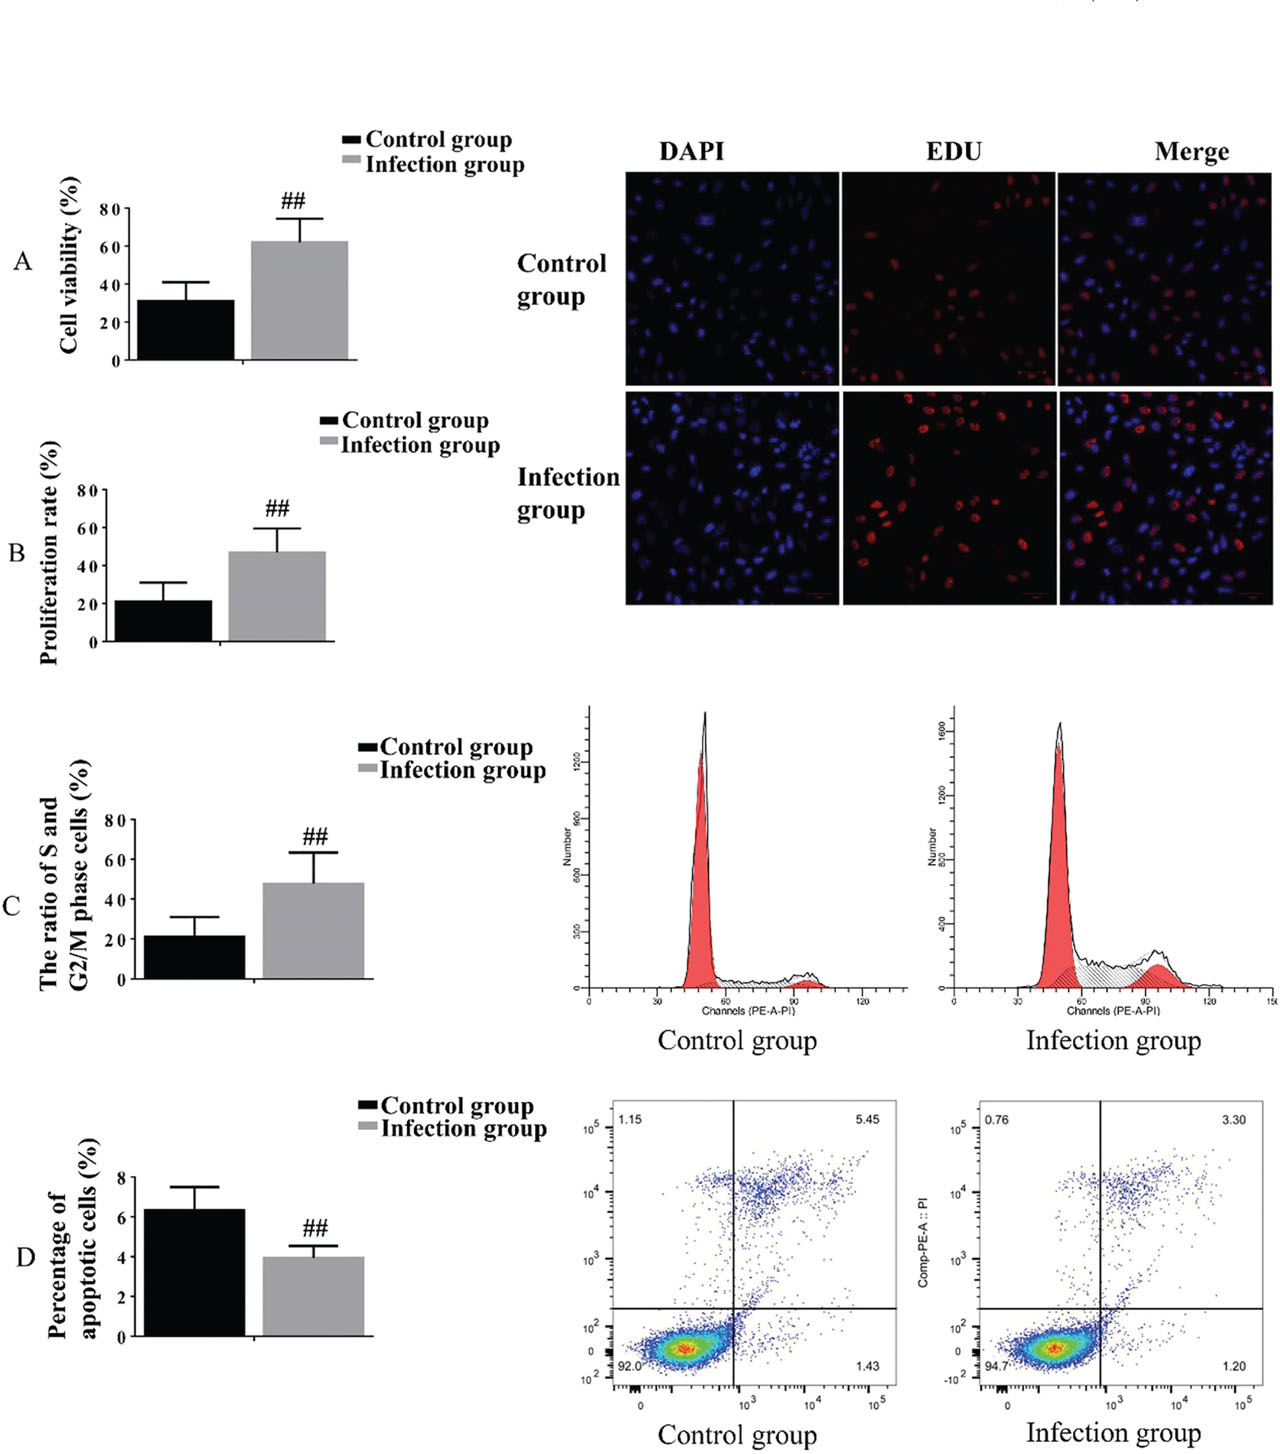
Fig 1.
The effects of FN infection on cell viability, proliferation, cell cycle distribution, and apoptosis. (A) Cell viability detection (CCK8 method); (B) Cell proliferation detection (EDU method); (C) Cell cycle distribution (flow cytometry); (D) Cell apoptosis detection (flow cytometry). ## Compared to the CG, P < 0.01. CG, control group; FN, Fusobacterium nucleatum.
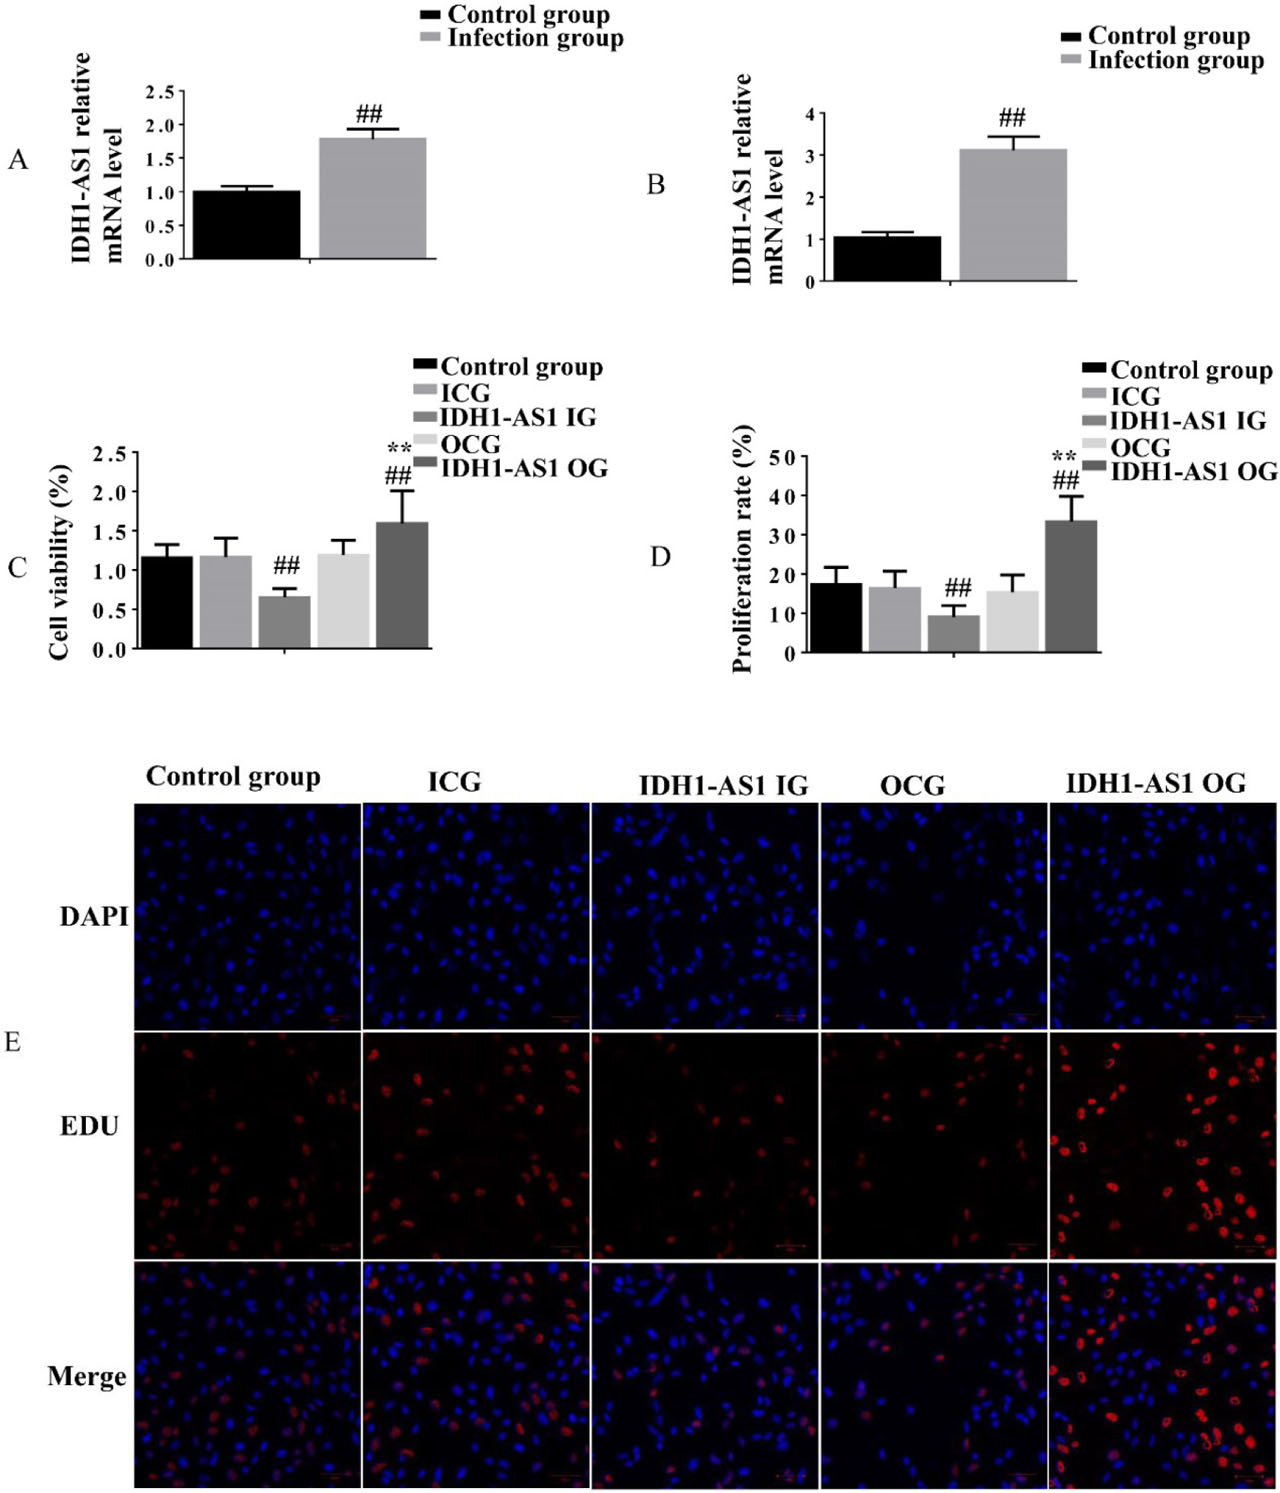
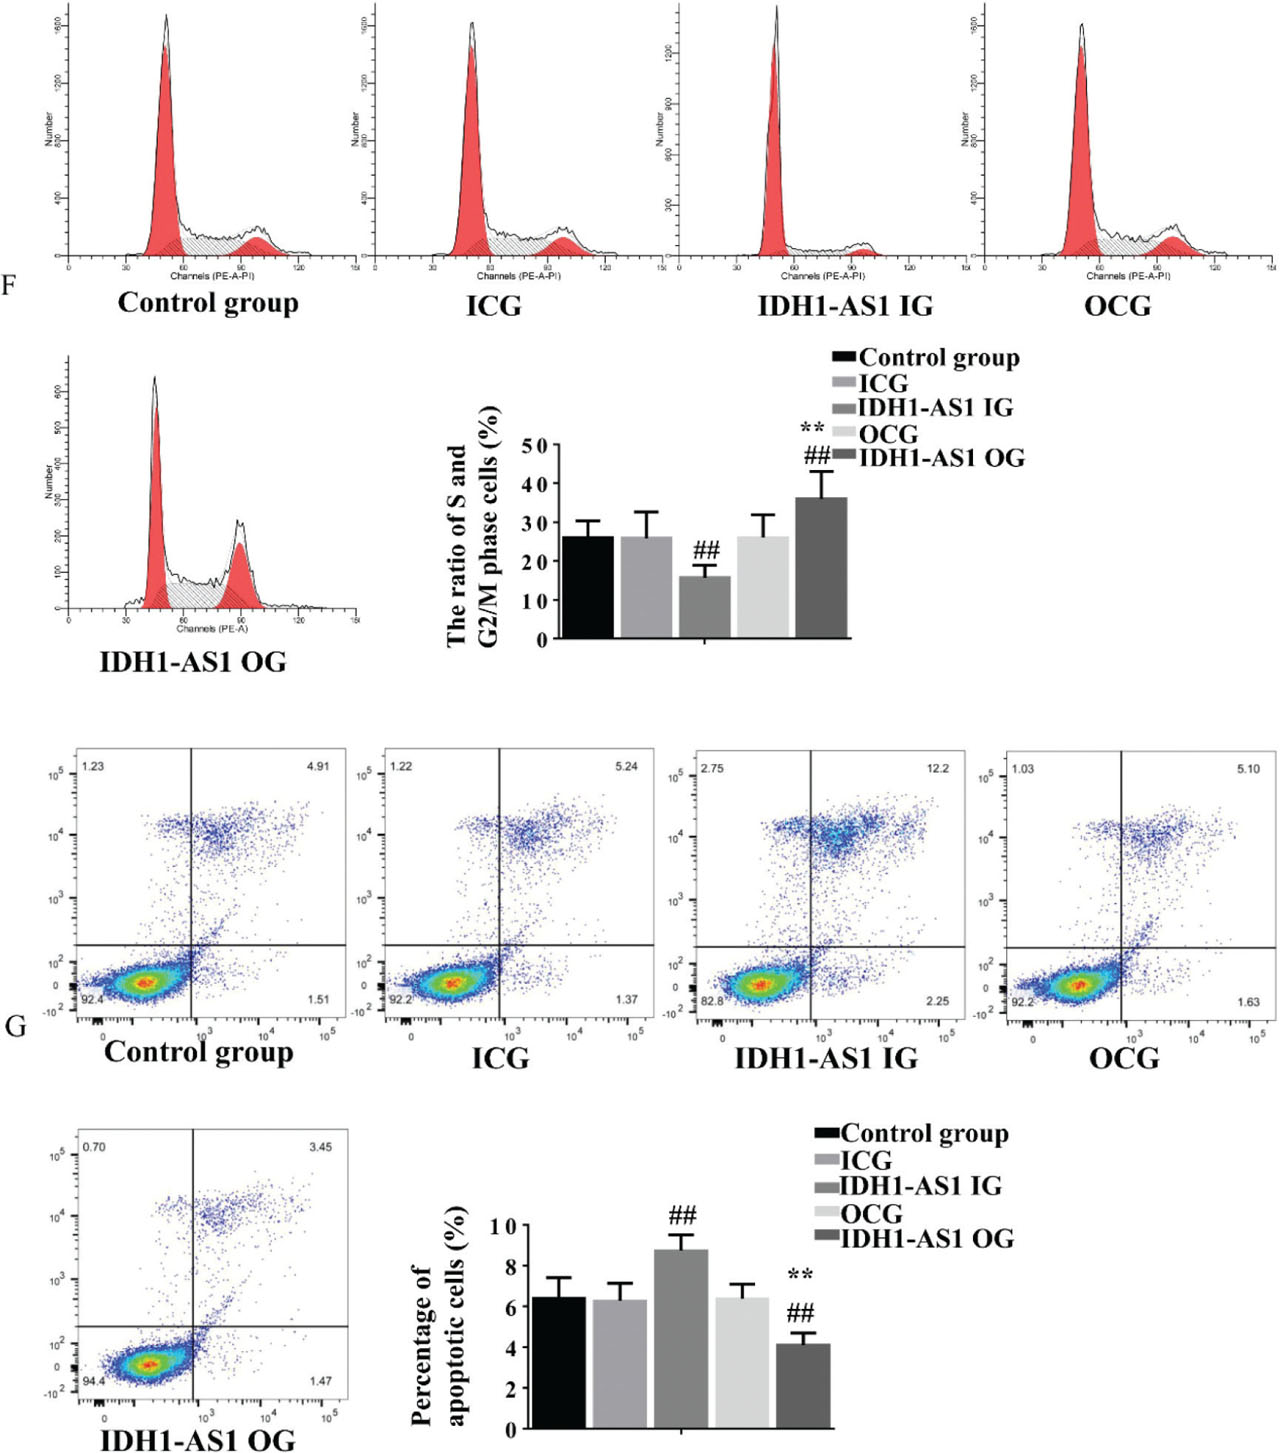
Fig 2.
The expression level and functional role of lncRNA IDH1-AS1 in bladder cancer; (A) Expression level of IDH1-AS1 in tissues; (B) Impact of FN infection on IDH1-AS1 expression; (C) Cell viability assay; (D) EDU proliferation assay (quantitative analysis) and (E) EDU proliferation assay (fluorescence microscopy images); (F) Cell cycle distribution; and (G) Cell apoptosis detection. ## Compared to the CG, P < 0.01. **Compared to the IDH1-AS1 IG group, P < 0.01. CG, control group; FN, Fusobacterium nucleatum; ICG, inhibitor control group; lncRNAs, long noncoding RNAs; OCG, overexpression control group.
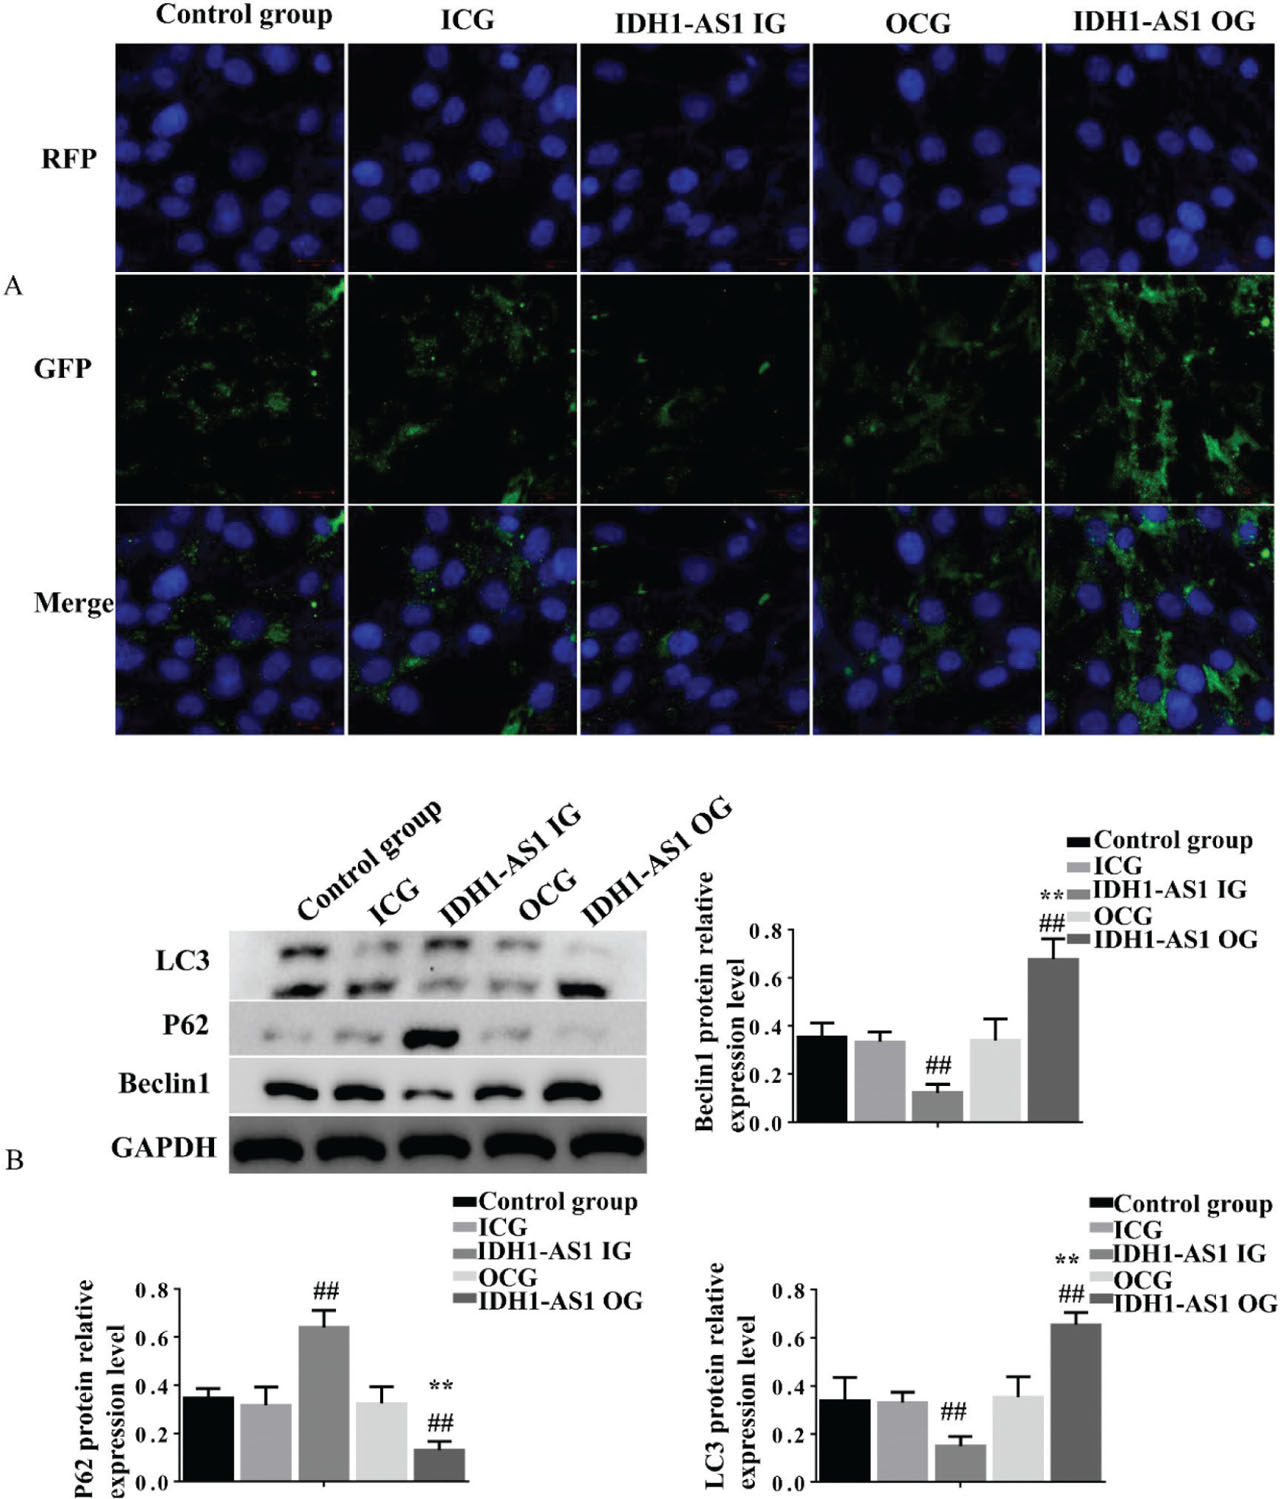
Fig 3.
IDH1-AS1 regulates autophagy in bladder cancer cells. (A) LC3-GFP-RFP autophagy flow analysis; (B) Autophagy-related protein Beclin1, p62 and LC3 expression analysis. ## Compared to the CG, P < 0.01. **Compared to the IDH1-AS1 IG group, P < 0.01. CG, control group; FN, Fusobacterium nucleatum; ICG, inhibitor control group; lncRNAs, long noncoding RNAs; OCG, overexpression control group.
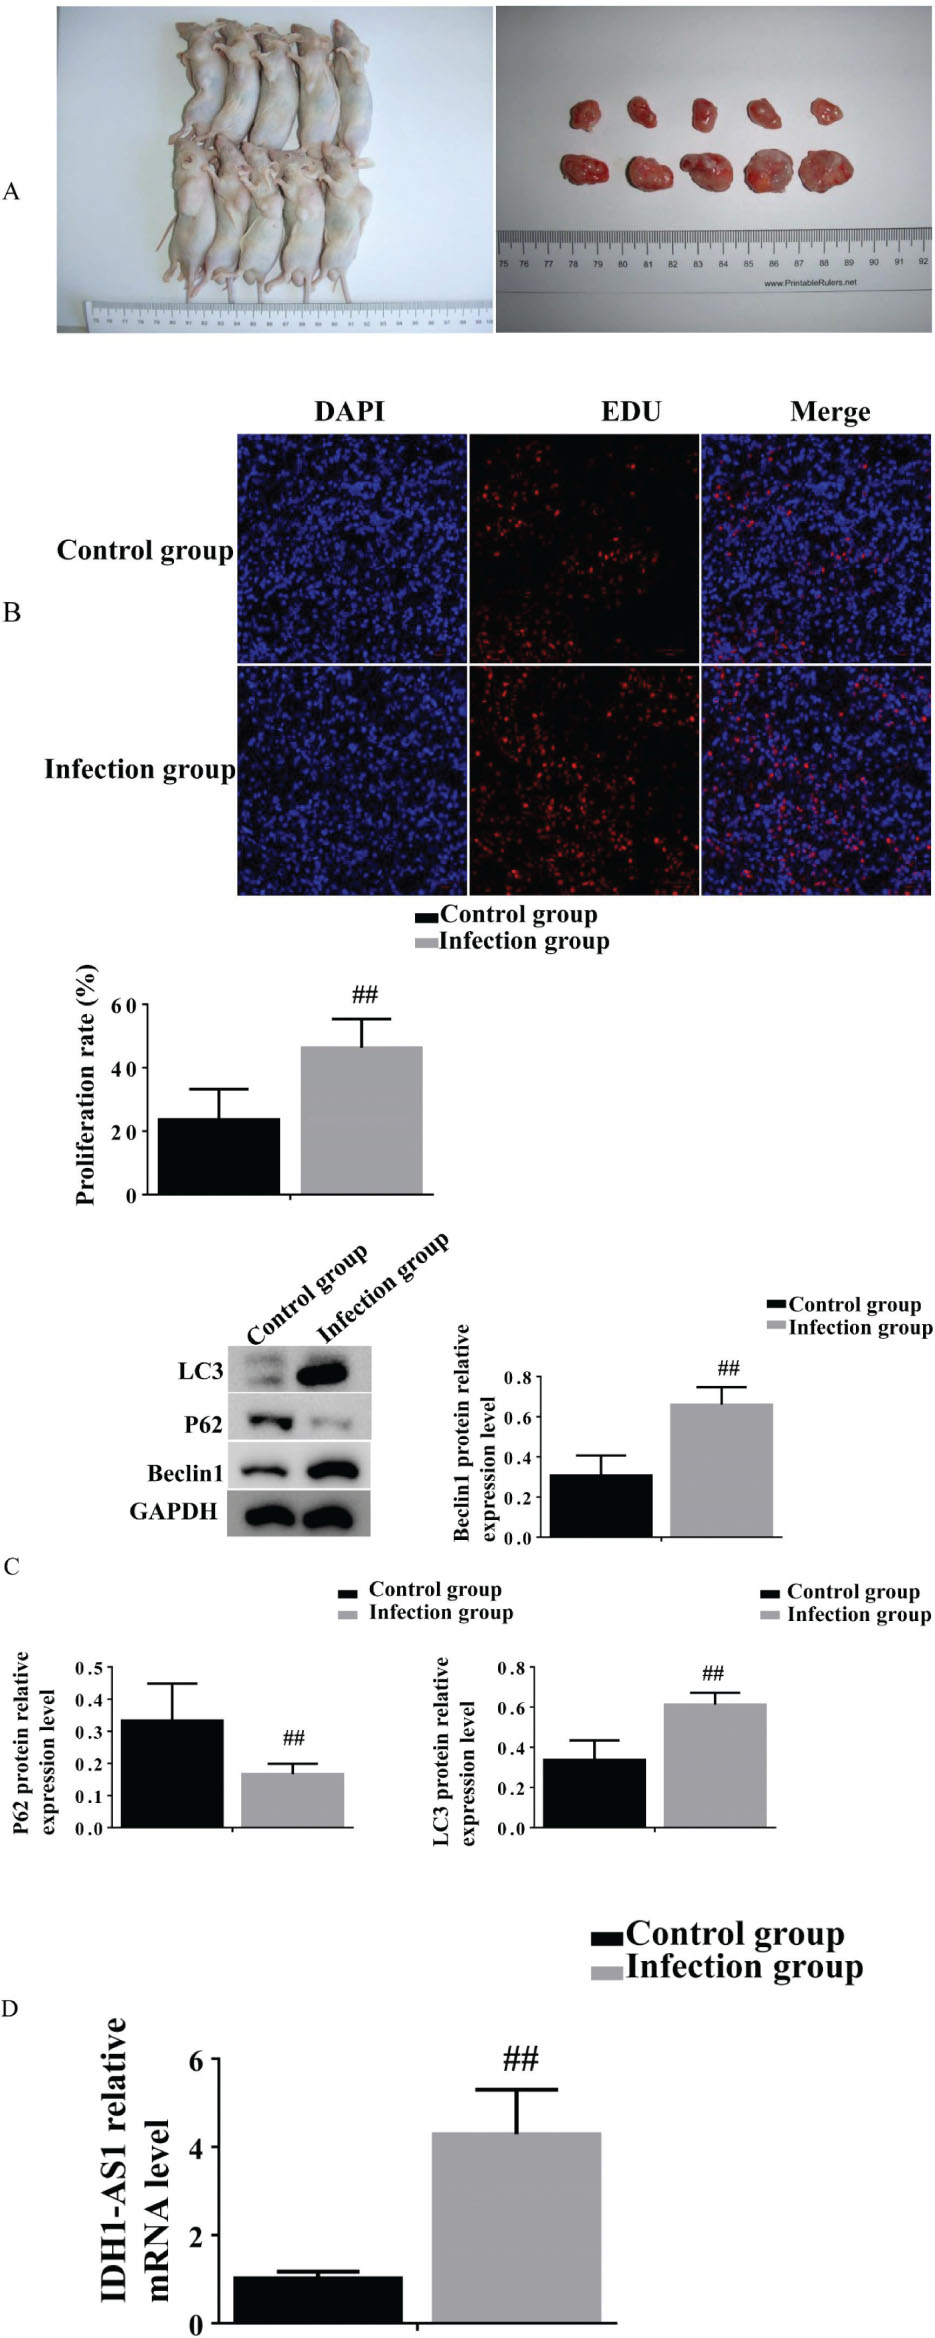
Fig 4.
FN infection promotes bladder cancer progression and autophagy in vivo. (A) Tumor growth assessment (n = 5 per group); (B) Cell proliferation analysis (EDU Assay); (C) Autophagy-related protein Beclin1, p62, and LC3 expression; (D) IDH1-AS1 gene expression analysis. ## Compared to the CG, P < 0.01. CG, control group; FN, Fusobacterium nucleatum.
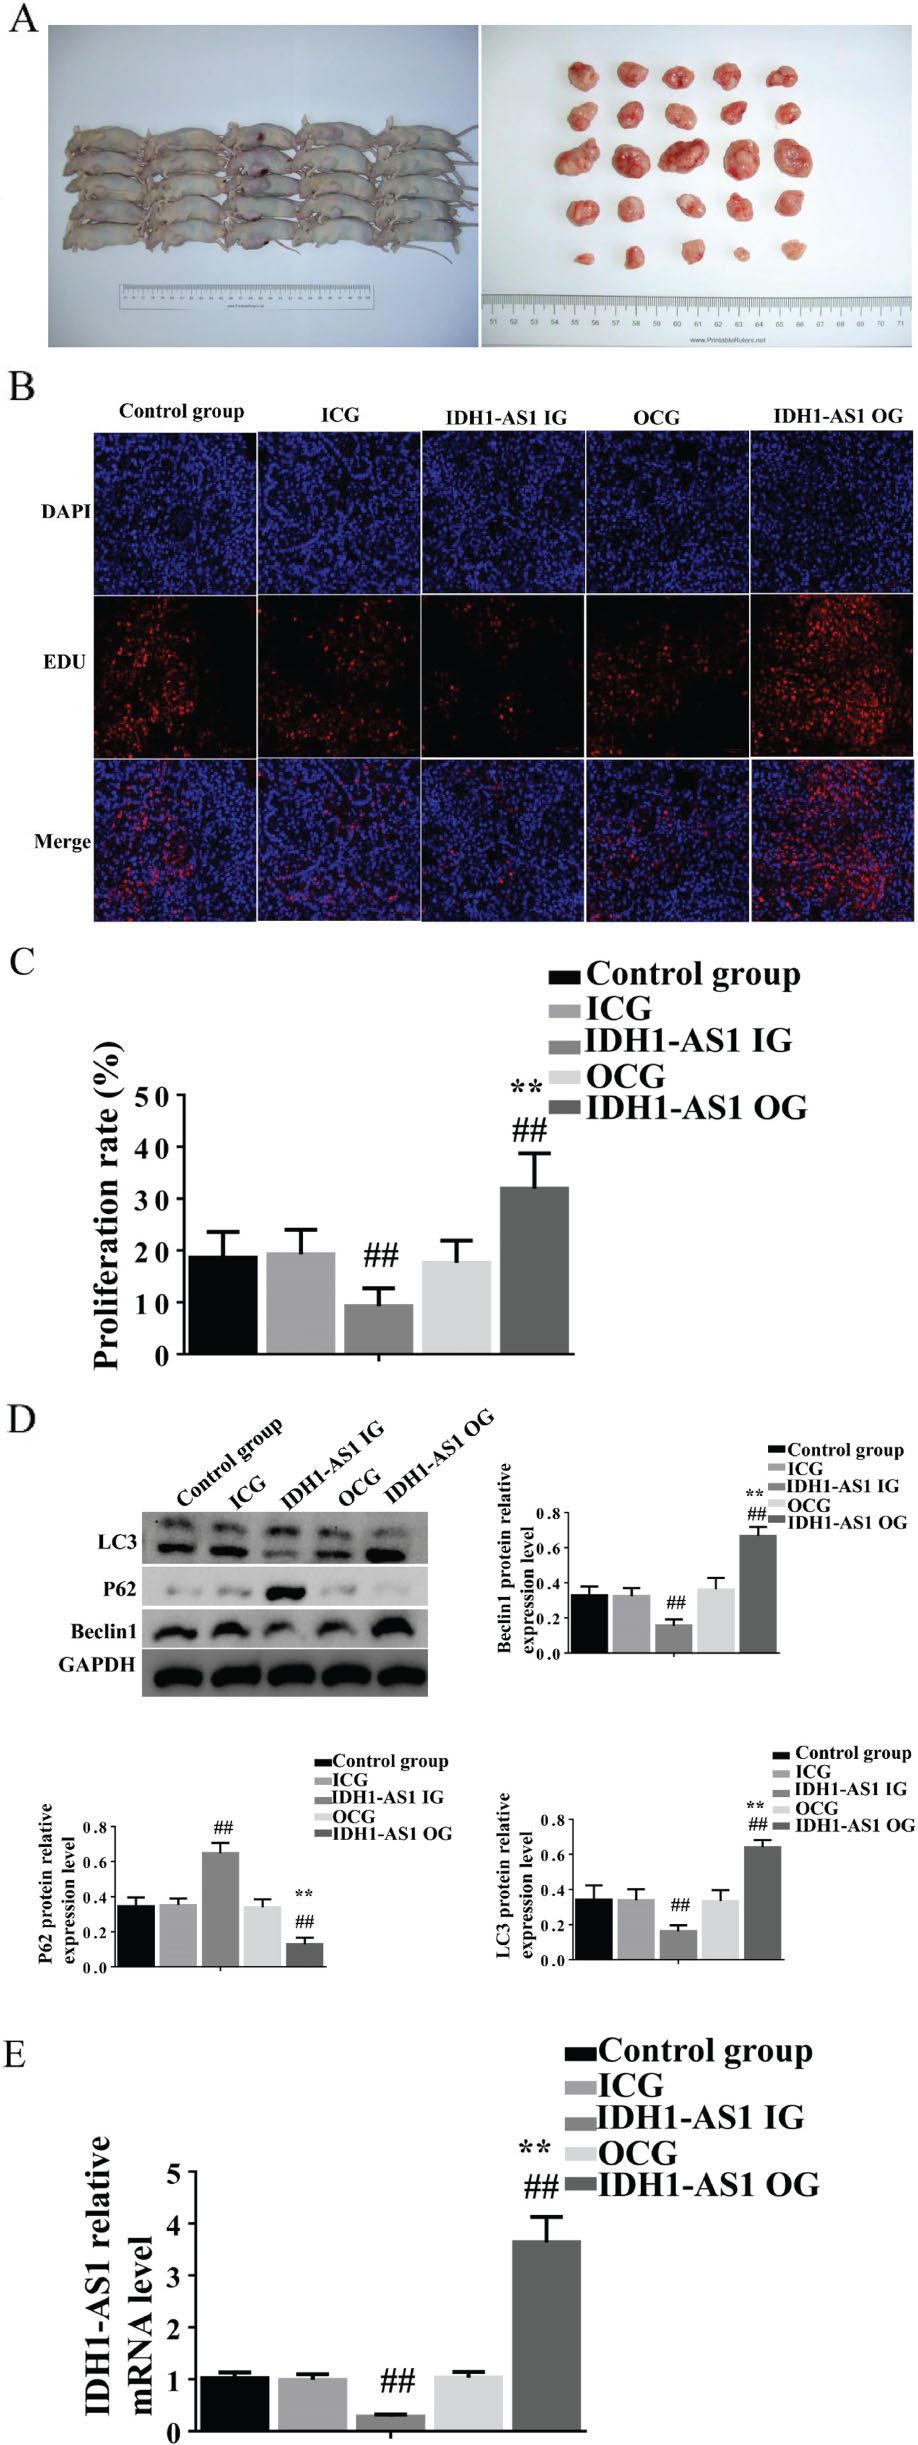
Fig 5.
Effects of IDH1-AS1 expression modulation on bladder cancer progression in nude mouse xenograft models. (A) Representative images of tumor xenografts and analysis of tumor volume and weight measurements (n = 5 per group); (B) Cell proliferation visualization (EDU fluorescence microscopy); (C) Cell proliferation quantification; (D) Autophagy-related protein Beclin1, p62, and LC3 expression analysis; and (E) IDH1-AS1 gene expression analysis. ##Compared to the CG, P < 0.01. **Compared to the IDH1-AS1 IG group, P < 0.01. CG, control group; ICG, inhibitor control group; OCG, overexpression control group.