
Fig 1.
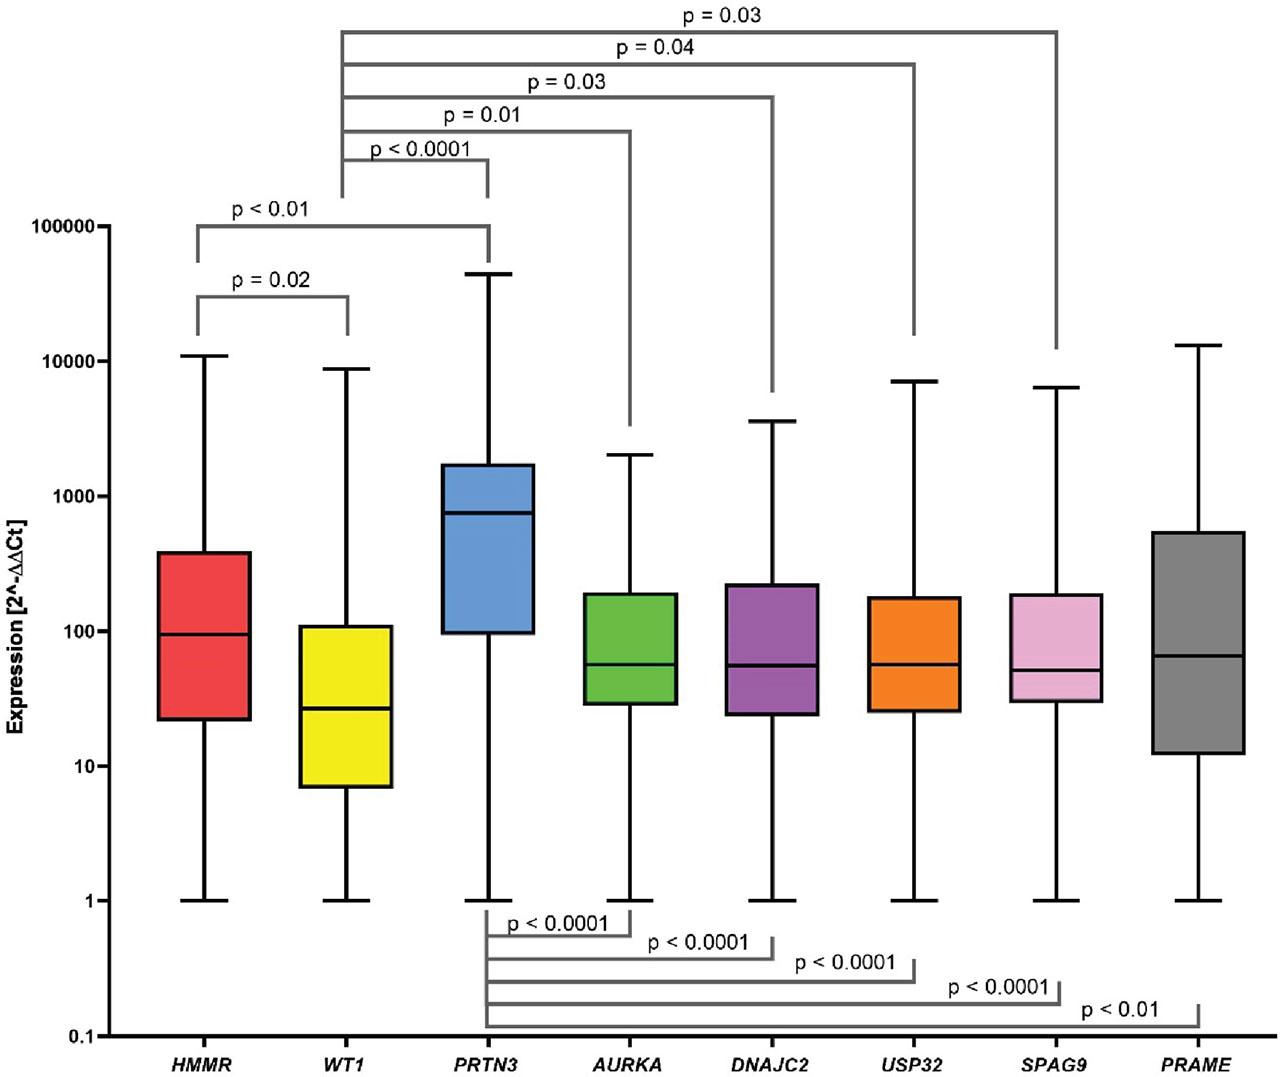
Fig 2.
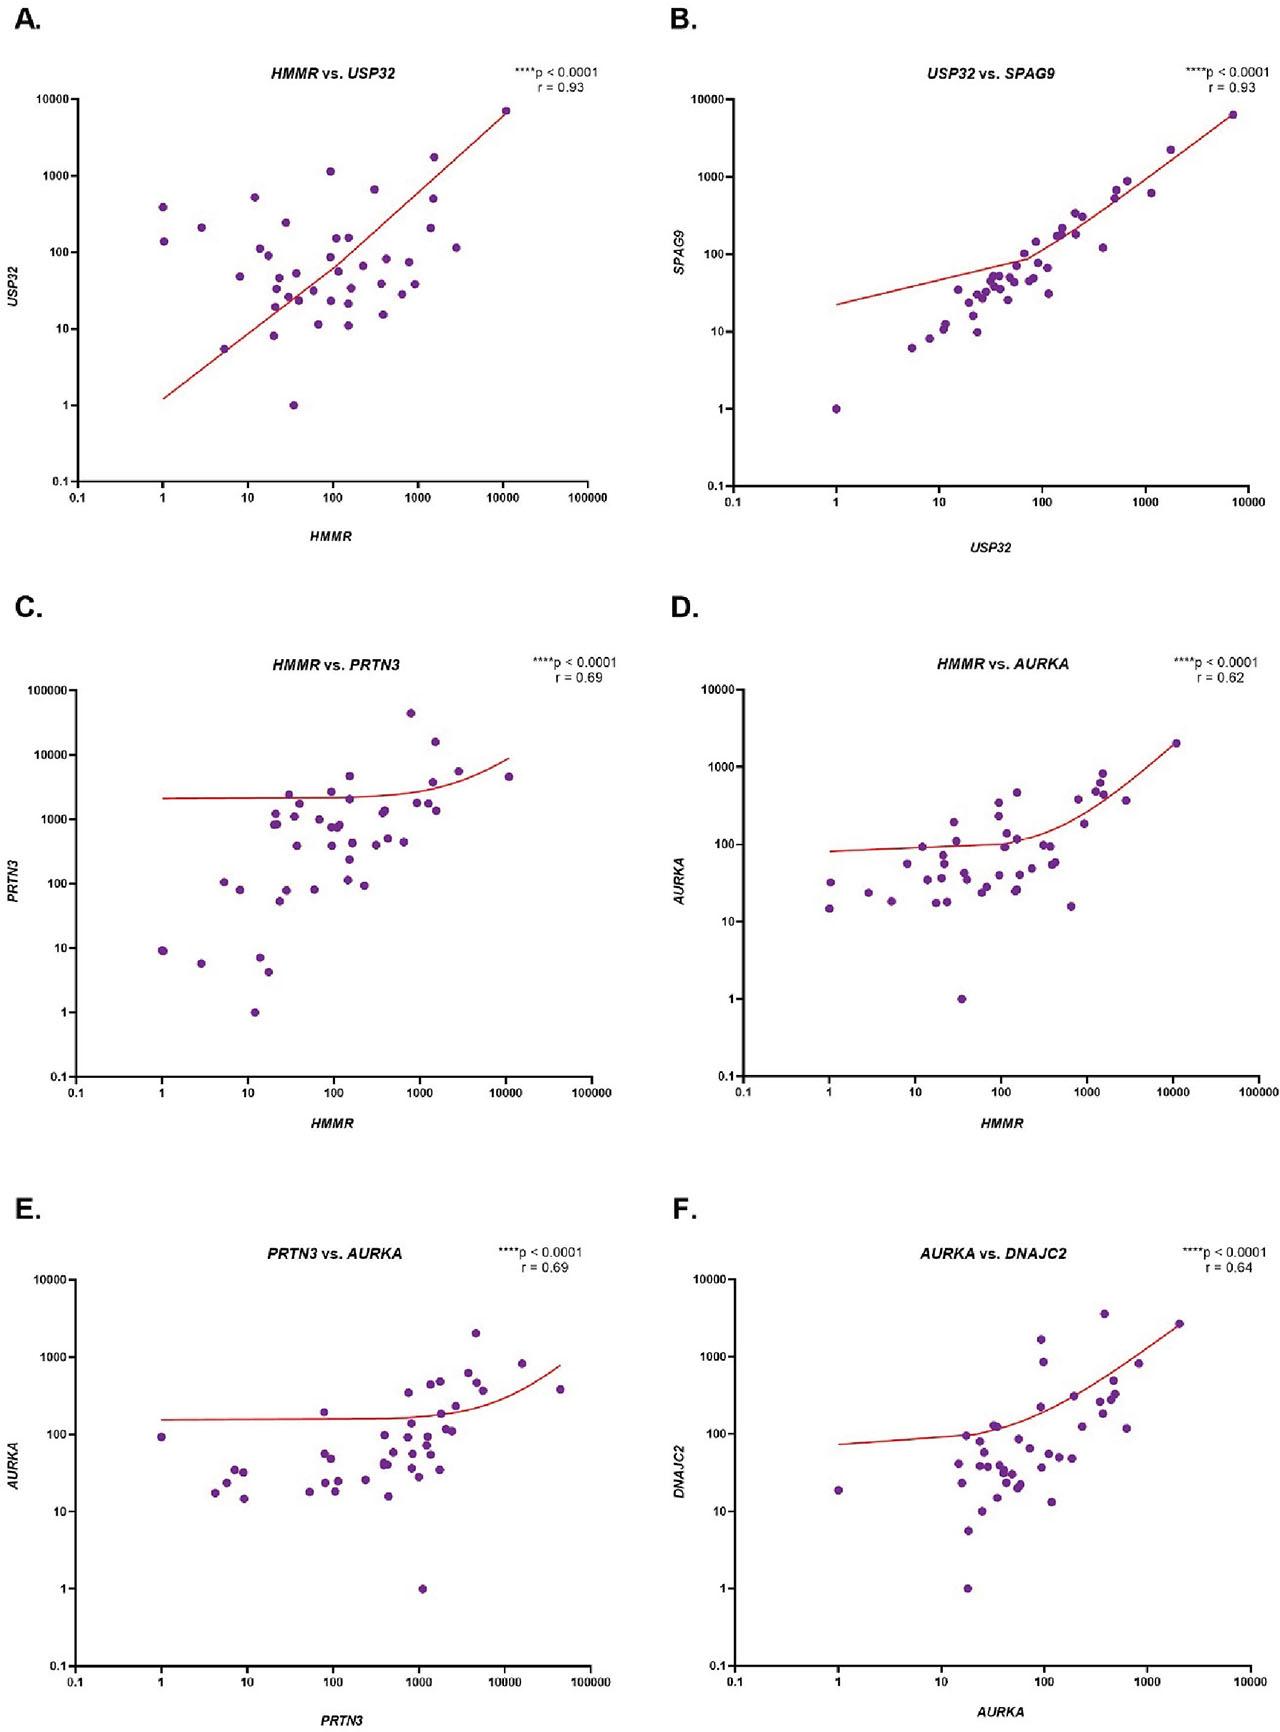
Fig 3.
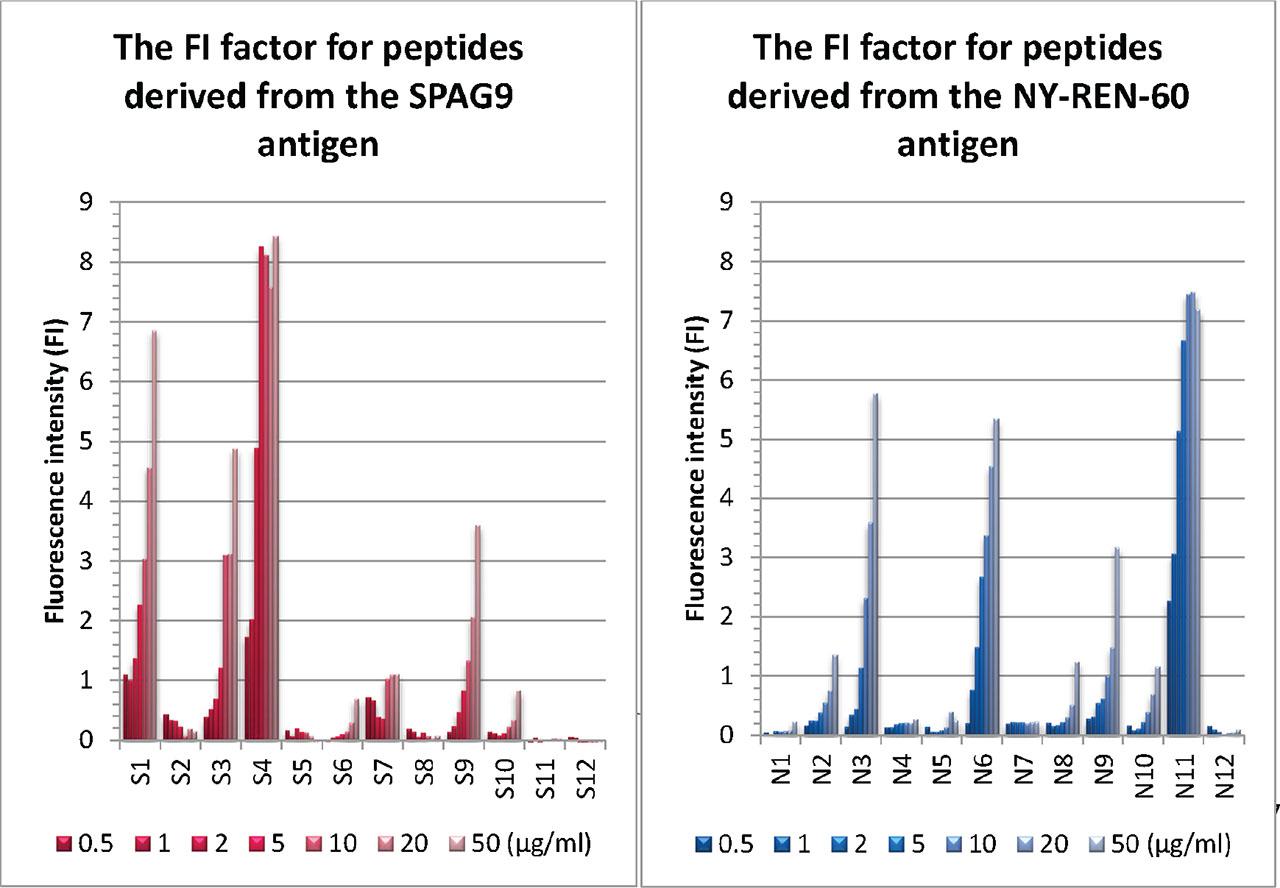
Fig 4.
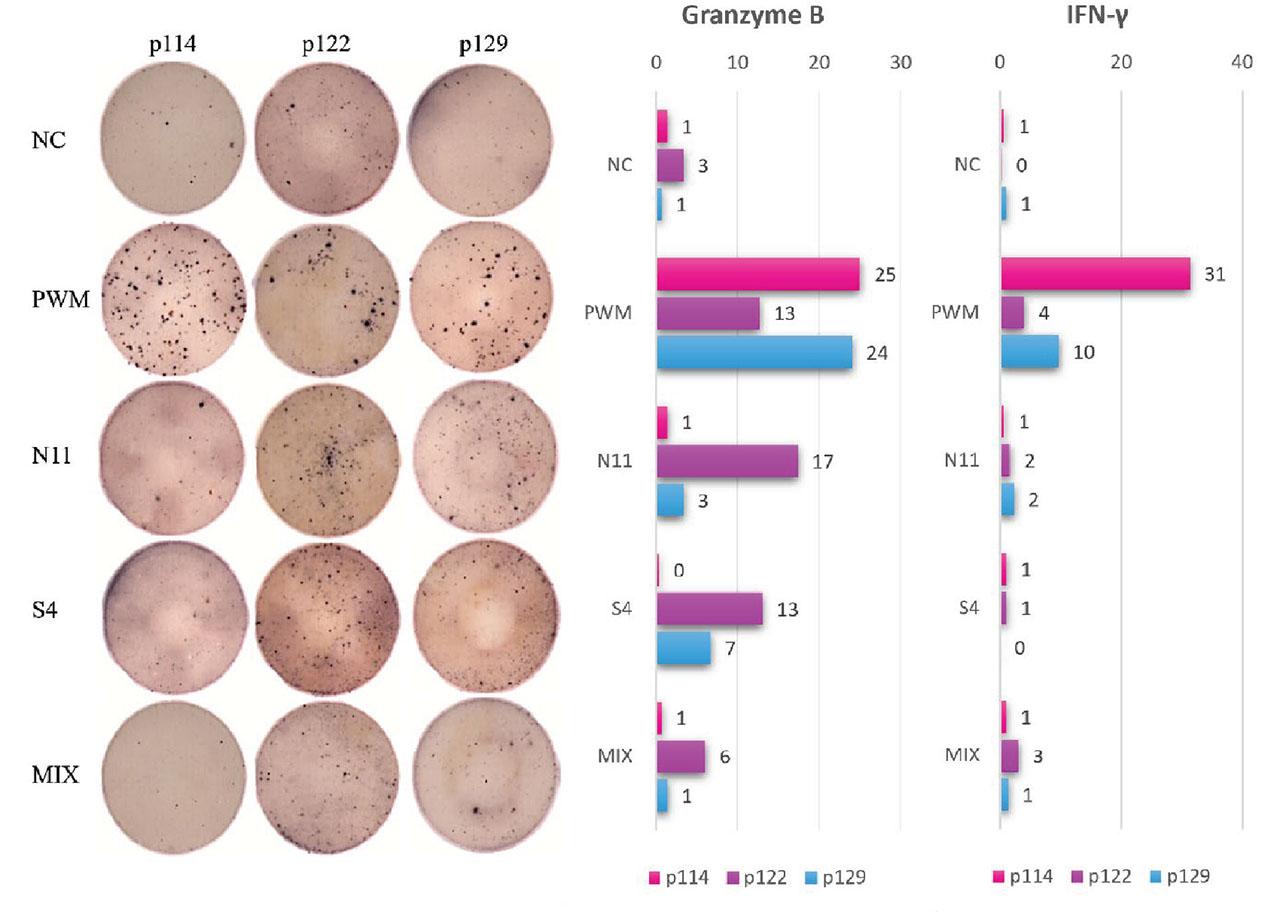
Fig 5.
Fig 1.
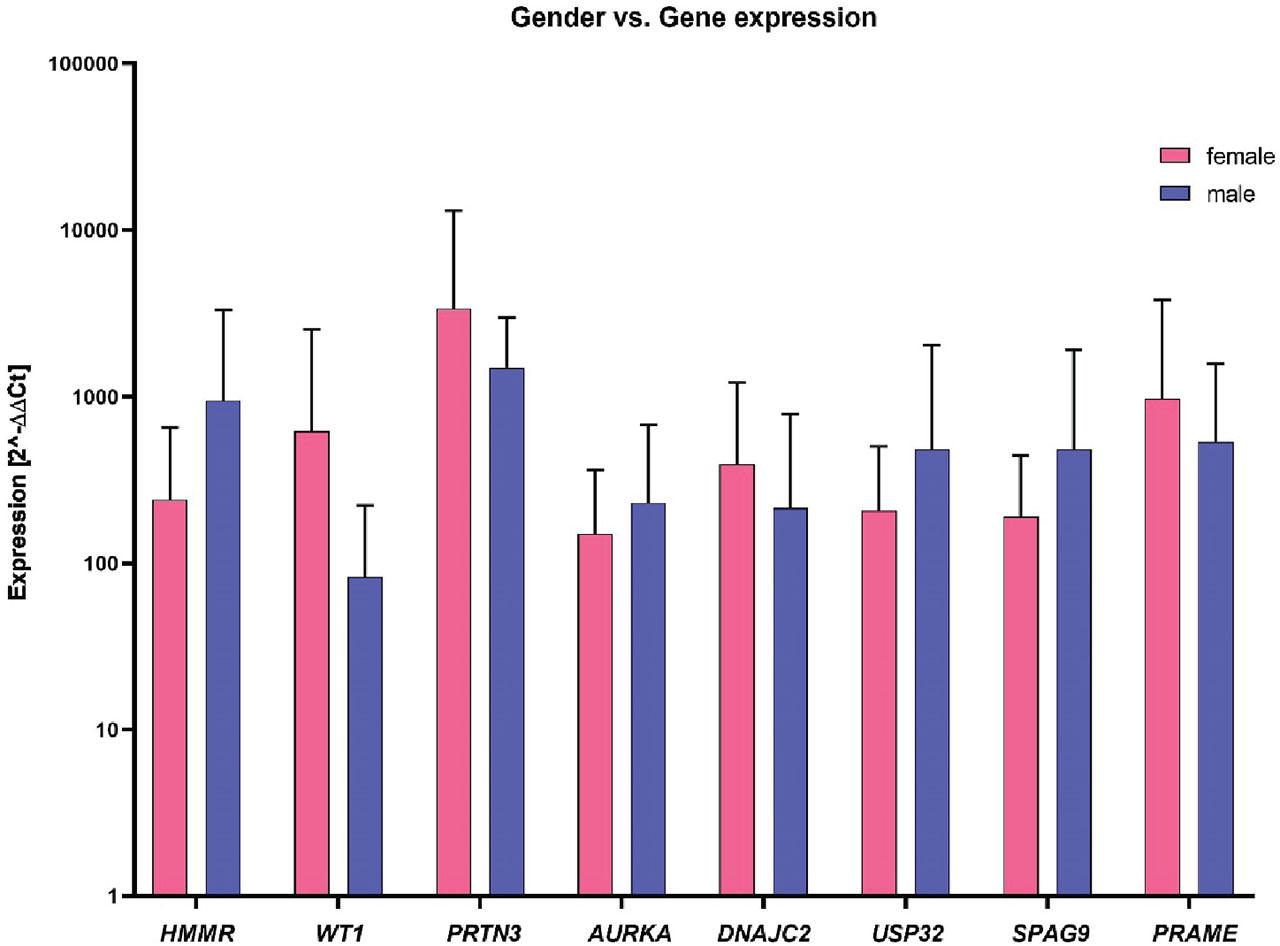
Fig 2.
Univariate Summary
| Univariate Model | Hazard Ratio (95% CI) | P-value |
| CD4_plus_CD25_plus_FoxP3_plus.txt | 0.89 (0.77 – 1.01) | 0.077 |
| CD56dim16_plus_PD1_plus.txt | 1.06 (1.01 – 1.11) | 0.024 |
| CD8_plus_PD1_plus.txt | 1.03 (1.02 – 1.05) | < 0.001 |
| iNKT_plus_CD161_plus.txt | 0.32 (0.11 – 0.94) | 0.039 |
| Model Comparison_Metrics | ||
| Model | AIC | Concordance |
| CD8_plus_PD1_plus.txt | 467.8898 | 0.6512 |
| iNKT_plus_CD161_plus.txt | 477.1068 | 0.5927 |
| CD56dim16_plus_PD1_plus.txt | 478.4037 | 0.5312 |
| CD4_plus_CD25_plus_FoxP3_plus.txt | 479.6236 | 0.5984 |
Sequences of peptides used in the peptide mix in the MLPC
| Peptide | Peptide sequence |
|---|---|
| RHAMM-R3165–173 | ILSLELMKL |
| WT1126–134 | RMFPNAPYL |
| PRAME300–309 | ALYVDSLFFL |
| MPP11437–445 | STLCQVEPV |
| Aur-A207–215 | YLILEYAPL |
| BCR-ABL922–930 | GFKQSSKAL |
| PR3-PR1169–177 | VLQELNVTV |
SPAG9 and NY-REN-60 derived T cell epitope peptides predicted by computer algorithms SYFPEITHI, IEDB, and NetCTL
| Peptide | Peptide sequence | Peptide position | SYFPEITHI ranking | IEDB ranking | NetCTL ranking |
|---|---|---|---|---|---|
| S1 | SLLGGITVV | 837 | 32 | 0.4 | 1.27 |
| S2 | ALADGTLAI | 1016 | 29 | 0.7 | 1.42 |
| S3 | AIIESTPEL | 343 | 29 | 1.6 | 1.30 |
| S4 | ELMPLVVAV | 49 | 28 | 0.4 | 1.03 |
| S5 | VMSERVSGL | 19 | 26 | 1.6 | 1.21 |
| S6 | RLMELQEAV | 521 | 25 | 0.3 | 1.20 |
| S7 | SLFEELSSA | 381 | 25 | 1.0 | 1.19 |
| S8 | KLKDSILSI | 998 | 26 | 2.3 | 1.34 |
| S9 | VLQGELEAV | 447 | 28 | 1.7 | 1.02 |
| S10 | AVLENLDSV | 56 | 26 | 1.8 | 1.07 |
| S11 | LILENTQLL | 413 | 26 | 3.0 | 1.08 |
| S12 | DLIAKVDEL | 433 | 28 | 5.6 | - |
| N1 | WLLSGGVYV | 162 | 26 | 0.4 | 1.26 |
| N2 | SLFGMPLIV | 1099 | 26 | 0.5 | 1.23 |
| N3 | FMNSSIQCV | 744 | 24 | 0.4 | 1.49 |
| N4 | SLSEGLFNA | 231 | 24 | 0.5 | 1.26 |
| N5 | FLVPRDPAL | 1311 | 25 | 0.9 | 1.33 |
| N6 | LLFQVCHIV | 355 | 24 | 0.43 | 1.23 |
| N7 | LLAFLLDGL | 829 | 29 | 1.3 | 1.08 |
| N8 | GLHEDLNRV | 836 | 28 | 1.3 | 1.10 |
| N9 | LLDDEDHKL | 679 | 26 | 2.0 | 1.60 |
| N10 | NLIVGLVLL | 79 | 30 | 1.6 | 0.93 |
| N11 | FLCAFEIPV | 991 | 22 | 0.1 | 1.37 |
| N12 | MMRTELYFL | 1083 | 23 | 0.9 | 1.24 |
Model_Comparison
| Model | AIC | Concordance |
| cox_model_summary_stepwise_model | 430.0106 | 0.7923 |
| cox_model_summary_model_01 | 433.9947 | 0.7621 |
| cox_model_summary_model_02 | 436.375 | 0.7352 |
| cox_model_summary_final_model | 440.9907 | 0.7478 |
| cox_model_summary_full_model | 446.2834 | 0.817 |
| cox_model_summary_model_03 | 448.5368 | 0.6547 |
| cox_model_summary_final_model | ||
| Characteristic | Hazard Ratio (95% CI) | P-value |
| iNKT_plus_CD161_plus | 0.24 (0.08 – 0.73) | 0.013 |
| CD4_plus_CD25_plus_FoxP3_plus | 0.87 (0.75 – 1.00) | 0.049 |
| CD8_plus_PD1_plus | 1.04 (1.02 – 1.05) | < 0.001 |
| cox_model_summary_full_model | ||
| Characteristic | Hazard Ratio (95% CI) | P-value |
| DC | 0.83 (5.50 – 1.27) | 0.394 |
| cDC | 4.85 (3.38 – 69.52) | 0.245 |
| pDC | 0.25 (4.71 – 13.67) | 0.5 |
| cDC_PD1_plus | 0.96 (9.18 – 1.00) | 0.076 |
| pDC_PD1_plus | 1.04 (9.95 – 1.08) | 0.086 |
| CD56dimCD16_plus | 1.05 (9.69 – 1.13) | 0.254 |
| CD56brightCD16_minus | 0.58 (1.69 – 2.00) | 0.391 |
| CD56brightCD16_plus | 0.96 (4.83 – 1.89) | 0.895 |
| iNKT | 2.71 (6.05 – 121.03) | 0.608 |
| iNKT_plus_CD161_plus | 0.01 (4.82 – 2.14) | 0.093 |
| NKT | 1.04 (9.69 – 1.12) | 0.265 |
| CD56dim16_plus_PD1_plus | 1.15 (1.05 – 1.26) | 0.004 |
| CD56bright16_minus_PD1_plus | 0.96 (8.51 – 1.09) | 0.526 |
| iNKT_plus_PD1_plus | 0.98 (9.65 – 1.00) | 0.138 |
| NKT_PD1_plus | 0.97 (9.31 – 1.01) | 0.102 |
| CD4_plus | 1.04 (1.00 – 1.09) | 0.045 |
| CD4_plus_PD1_plus | 1.03 (9.84 – 1.08) | 0.208 |
| CD8_plus | 1.08 (1.01 – 1.14) | 0.013 |
| CD8_plus_PD1_plus | 1.05 (1.02 – 1.07) | < 0.001 |
| CD19_plus | 1.10 (1.03 – 1.18) | 0.006 |
| CD19_plus_PD1_plus | 1.01 (9.85 – 1.03) | 0.446 |
| CD4_plus_CD25_plus_FoxP3_plus | 0.75 (6.27 – 0.90) | 0.002 |
| cox_model_summary_model_01 | ||
| Characteristic | Hazard Ratio (95% CI) | P-value |
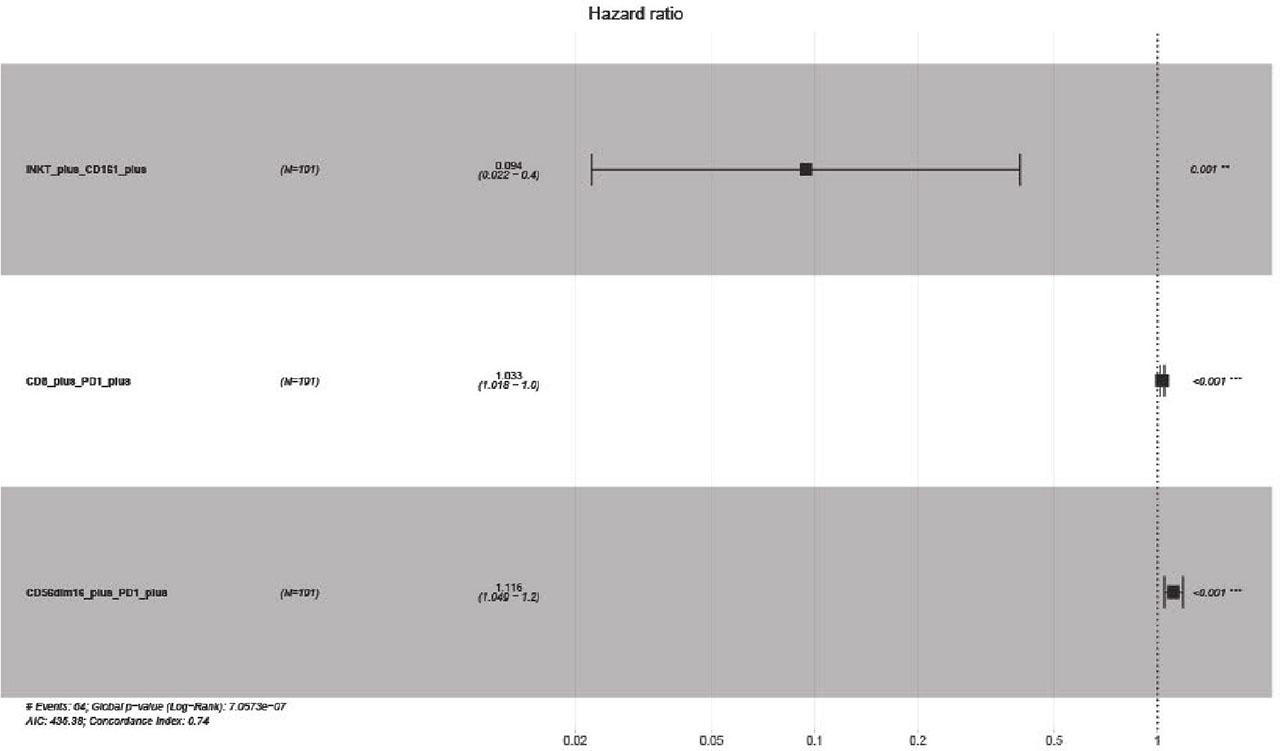
| iNKT_plus_CD161_plus | 0.10 (0.03 – 0.40) | 0.001 |
| CD4_plus_CD25_plus_FoxP3_plus | 0.86 (0.75 – 1.00) | 0.05 |
| CD8_plus_PD1_plus | 1.03 (1.02 – 1.05) | < 0.001 |
| CD56dim16_plus_PD1_plus | 1.11 (1.05 – 1.18) | < 0.001 |
| cox_model_summary_model_02 | ||
| Characteristic | Hazard Ratio (95% CI) | P-value |
| iNKT_plus_CD161_plus | 0.09 (0.02 – 0.40) | 0.001 |
| CD8_plus_PD1_plus | 1.03 (1.02 – 1.05) | < 0.001 |
| CD56dim16_plus_PD1_plus | 1.12 (1.05 – 1.19) | < 0.001 |
| cox_model_summary_model_03 | ||
| Characteristic | Hazard Ratio (95% CI) | P-value |
| CD8_plus_PD1_plus | 1.03 (1.02 – 1.05) | < 0.001 |
| CD56dim16_plus_PD1_plus | 1.05 (0.99 – 1.10) | 0.089 |
| cox_model_summary_stepwise_model | ||
| Characteristic | Hazard Ratio (95% CI) | P-value |
| cDC_PD1_plus | 0.96 (0.92 – 1.00) | 0.044 |
| pDC_PD1_plus | 1.04 (1.00 – 1.08) | 0.061 |
| iNKT_plus_CD161_plus | 0.08 (0.02 – 0.34) | < 0.001 |
| CD56dim16_plus_PD1_plus | 1.08 (1.02 – 1.15) | 0.013 |
| CD4_plus | 1.03 (1.00 – 1.06) | 0.035 |
| CD8_plus | 1.06 (1.02 – 1.11) | 0.003 |
| CD8_plus_PD1_plus | 1.04 (1.02 – 1.06) | < 0.001 |
| CD19_plus | 1.07 (1.01 – 1.12) | 0.012 |
| CD4_plus_CD25_plus_FoxP3_plus | 0.79 (0.67 – 0.93) | 0.004 |
Univariate and multivariate Cox proportional hazards analysis of immune cell populations for recurrence risk
| Variable | Univariate analysis | Multivariate analysis | ||
|---|---|---|---|---|
| HR (95% CI) | p-value | HR (95% CI) | p-value | |
| iNKT+CD161+ | 0.32 (0.11–0.94) | 0.039 | 0.09 (0.02–0.40) | 0.001 |
| CD8+PD1+ | 1.03 (1.02–1.05) | <0.001 | 1.03 (1.02–1.05) | <0.001 |
| CD56dimCD16+PD1+ | 1.06 (1.01–1.11) | 0.024 | 1.12 (1.05–1.19) | <0.001 |
Correlation between patients age and expression of the analyzed genes_
| Analyzed gene | HMMR | WT1 | PRTN3 | AURKA | DNAJC2 | USP32 | SPAG9 | PRAME |
| r | 0.1019 | −0.0712 | −0.0888 | −0.0792 | 0.1098 | 0.2229 | 0.0955 | −0.0251 |
| p | 0.5206 | 0.6625 | 0.5760 | 0.6179 | 0.4888 | 0.1668 | 0.5527 | 0.8812 |