Immune dysfunction and immunosurveillance in chronic myeloid leukemia (CML) have long been an unmet need for clarification, especially in the context of treatment-free remission (TFR) achieved only by a subset of patients (Mahon et al. 2010; Ross et al. 2013; Mori et al. 2015; Nicolini et al. 2018; Saussele et al. 2018). Historical evidence from the era before the introduction of tyrosine kinase inhibitors (TKI), including the curative potential of allogeneic stem cell transplantation (alloSCT), has indicated that CML is a disease susceptible to immune-mediated control (van Rhee et al. 1994; Kolb et al. 1995; Collins et al. 1997; Sehn et al. 1999; Guglielmi et al. 2002; Huff et al. 2006; Maurer and Antin 2024). Beyond their direct effects on BCR::ABL1 tyrosine kinase, TKI are now also recognized for their immunomodulatory properties (Tanaka et al. 2020; Vigón et al. 2020). At diagnosis, CML patients demonstrate an impaired immune response, involving natural killer (NK) cells, dendritic cells (DC), and cytotoxic T lymphocytes (CTL), manifested by a reduction in their number and function (Braga et al. 2024). Furthermore, CTL directed against CML cells exhibit high expression of PD1 (programmed death receptor 1), which, upon binding to PD1 ligand (PDL1) expressed on CML cells, leads to inhibition of the cell-killing capacity of these cells and, consequently, disease progression (Mumprecht et al. 2009). Patients diagnosed with CML also have a high percentage of regulatory T lymphocytes (Treg), which are suppressor immune cells that promote T cell dysfunction, thus contributing to tumor cell escape from immune surveillance (Giallongo et al. 2014; Hughes et al. 2017; Najima et al. 2018). Immunological parameters improve during TKI therapy. In patients treated with TKI, an expansion of CD8+ CTL and NK cells is observed, which is associated with a better response to treatment (Mustjoki et al. 2009; Chang et al. 2019; Kreutzman et al. 2019). Moreover, interferon-α (IFN-α) treatment has been observed to stimulate the immune system, and combination therapies of imatinib and IFN-α improve treatment outcomes (Ross et al. 2013; Saussele et al. 2018). This immunomodulatory effect may influence the achievement of deep molecular response (DMR) and, therefore, the possibility of achieving TFR despite fluctuations in BCR::ABL1 levels. Studies suggest that DMR is associated with an increased percentage of cytotoxic cells and a decreased number of suppressor cells, suggesting the involvement of immunocompetent cells in immune surveillance, which is important for achieving long-term remission without treatment (Hughes et al. 2017; Ilander et al. 2017; Cayssials et al. 2019; Irani et al. 2020; Fujioka et al. 2021; Kong et al. 2021; Kwaśnik and Giannopoulos 2021). Patients achieving durable TFR are characterized by elevated numbers and cytotoxic activity of NK cells (CD56dimCD16+, increased interferon-γ (IFN-γ) production, and expression of activating receptors), as well as the presence of antigen-specific CD8+ clones (e.g. anti-PR1), and innate CD8+ T cells (Rea et al. 2017; Cayssials et al. 2019; Kong et al. 2021; Decroos et al. 2024; Garcia et al. 2024; Huuhtanen et al. 2024). In turn, increased PD1 expression on T lymphocytes is associated with unfavorable TFR outcomes (Hughes et al. 2017; Decroos et al. 2024; Garcia et al. 2024; Kwaśnik et al. 2024). These findings highlight the potential of immune surveillance mechanisms in maintaining TFR.
Immune characterization in CML is relevant to new immunotherapies that target enhancing the patient’s immune system through leukemia-associated antigen (LAA) vaccines that hold promise for CD8+ cytotoxic T cell responses and increased CTL expansion, or combination therapies that include IFN-α or immune checkpoints as a response enhancer to improve TFR rates (Liu et al. 2024).
In this study, we analyzed the expression of characterized tumor-associated gens in CML patients at diagnosis (n = 43). Additionally, we conducted a comprehensive evaluation of the immune system in patients with sustained TFR (n = 78) and investigated effector immune responses in a subset of post-imatinib patients (n = 3).
Tumor antigen expression was assessed in peripheral blood samples collected at diagnosis from 43 patients with newly diagnosed CML, as part of routine diagnostic procedures at collaborating centers. Clinical data were unavailable due to anonymization of samples at the time of referral. The study group included 22 women (51%) and 21 men (49%) with a median age of 66 years (age range: 30–92 years).
A group of 78 patients with CML who achieved a DMR of at least MR4.0 were included in the imatinib discontinuation trial and analyzed for maintenance of TFR. Samples were collected at particular time points after imatinib withdrawal: at the moment of discontinuation and 3 months, 6 months, 9 months, and 12 months of TFR. Four patients could obtain a sample at a longer time interval after treatment discontinuation. Of the study participants, 58% (45/78) were women and 42% (33/78) were men, with a median age of 64 years (age range, 25–87 years).
Additionally, three CML patients (two men aged 76 years and 44 years, and one woman aged 56 years) at the time of imatinib discontinuation underwent functional tests using the Enzyme- Linked ImmunoSpot (ELISpot) assay. At the moment of treatment discontinuation, all patients were in DMR. In patient p114, the quantity of BCR::ABL1 transcript was detected at 0.0014, corresponding to an MR4.5 response, while no transcript was detected in patients p122 and p129, classifying the molecular response at MR5.0. The amount of BCR::ABL1 transcript was assessed by droplet digital PCR (ddPCR). One of the three analyzed patients experienced a molecular recurrence, defined as loss of major molecular response (MMR) already at 3 months after imatinib withdrawal, while the other two patients remained in remission. The length of imatinib treatment before discontinuation was 54 months in patient no. 114, 66 months in patient no. 122 and 73.5 months in patient no. 129. The duration of DMR before imatinib discontinuation was 46 months in patient p114, 57 months in patient p122, and 55 months in patient p129, respectively.
The study received approval from the Ethics Committee of the Medical University of Lublin (approval number KE-0254/174/2017) and was conducted in accordance with the Declaration of Helsinki. Written informed consent was obtained from all participants.
Peripheral blood mononuclear cells (PBMCs) were isolated with density gradient centrifugation using Biocoll (Biochrom, Berlin, Germany). The viability of the cells, anticipated to be above 95%, was assessed using trypan blue staining (Sigma Aldrich, Saint Louis, MO, USA). Cells were cryopreserved in medium consisting of RPMI 1640 (Biochrom), fetal bovine serum (FBS, Biochrom), and dimethyl sulfoxide (DMSO, Sigma Aldrich) in a 7:2:1 ratio, respectively.
RNA was isolated using the QIAamp RNA Blood Mini Kit (Qiagen) according to the manufacturer’s protocol. The concentration and purity of the extracted RNA samples were assessed using a BioSpec-nano spectrophotometer (Shimadzu, Kyoto, Japan). The RNA samples were stored at −80°C for further analysis.
The reverse transcription reaction was performed using the QuantiTect Reverse Transcription Kit (Qiagen), following the manufacturer’s instructions. For each sample, 1 μg of RNA was reverse-transcribed to 20 μL of cDNA.
To evaluate the HMMR (encode RHAMM, hyaluronan-mediated motility receptor), WT1 (WT1, Wilm’s tumor 1), PRTN3 (PR3, proteinase 3), AURKA (AURKA, aurora kinase A), DNAJC2 (MPP11, M-phase phosphoprotein 11 protein), USP32 (NY-REN-60, renal cell carcinoma associated antigen 60), SPAG9 (SPAG9, sperm-associated antigen 9), and PRAME (PRAME, preferentially expressed antigen in melanoma) mRNA expression levels, qPCR was performed using the TaqMan Real-Time PCR analysis kit (Applied Biosystem (Thermo Fisher Scientific, Waltham, MA, USA) according to the manufacturer’s instructions and the 7500 Fast Dx Real-Time PCR Instrument (Applied Biosystems). As a reference gene, the constitutive gene GAPDH (glyceraldehyde–3–phosphate dehydrogenase) was used. For each reaction, 1 μL of the cDNA sample was used as a template for qPCR analysis. Additionally, a negative control (NC) was performed, in which 1 μL of distilled water was added. Gene expression levels were expressed as ΔCt values, calculated as the difference between the ΔCt of the target gene and the ΔCt of the GAPDH reference gene.
The ddPCR test was performed according to the described procedure (Kjaer et al. 2019). Molecular recurrence is confirmed loss of MMR, assessed on two occasions, 1 month apart.
Flow cytometric analysis was performed on PBMC collected at the time of treatment discontinuation (0 month) and during the TFR trial at subsequent time points: 3 months, 6 months, and 12 months. One million PBMC were incubated for 20 min at room temperature (RT) in the dark with fluorochrome-labeled monoclonal antibodies (mAb) (all from BD Biosciences, San Jose, CA, USA).
Immunophenotypic analysis included B cells (CD19+) and T cells (CD3+): CD8+ T cells (including the CD8+PD1+ subpopulation), and CD4+ T cells (including the Treg subpopulation, and the CD4+PD1+ subpopulation), using the following mAb: anti-CD3-BV510, anti-CD4-PerCP, anti-CD8-FITC, anti-CD19-APC-Cy7, anti-CD25-PE-Cy7, and anti-CD127-BV421. Treg were identified using the Human FOXP3 Fix/Perm Buffer Set (Becton Dickinson, San Jose, CA, USA) and intracellular staining with anti-FOXP3-PE for 30 min at RT, according to the manufacturer’s protocol. A minimum of 100,000 stained cells per sample was acquired.
NK and natural killer T (NKT) cell populations were analyzed using the following mAb: anti-CD45-BV510, anti-CD14-APC-H7, anti-CD3-PerCP, anti-CD56-PE-Cy7, anti-CD16-BV421, anti-iNKT-FITC, and anti-CD161-PE. A minimum of 100,000 stained cells per sample was acquired.
Conventional DC and plasmacytoid DC were assessed using the following mAb panel: anti-CD3, CD14, CD19, CD20, CD56-FITC (antibody cocktail), anti-HLA-DR-BV510, anti-CD123-PE-Cy7, anti-BDCA-1-PE, anti-BDCA-BV421. A minimum of 300,000 events were collected per sample.
Anti-PD1-APC was used to evaluate PD1 expression on B, T, NK, and DC cell subsets.
Anti-HLA serotype A*0201-FITC was used to identify HLA-A2 positive patients.
Before analysis, cells were washed twice with PBS or stain buffer (for Treg staining). Fluorescence minus one (FMO) controls were used to define gating thresholds for PD1 and FOXP3 expression. All samples were acquired using a FACSLyric flow cytometer (Becton Dickinson) and analyzed with FACS Suite software (version 1.5, Becton Dickinson).
The binding affinity of MHC class I-restricted epitopes derived from SPAG9 and NY-REN-60 to HLA serotype A*0201 molecules was calculated using three independent computer prediction algorithms: Synthetic Peptide Homologous to T-cell Epitopes and its Interactions (SYFPEITHI) (Rammensee et al. 1999), the Immune Epitope Database (IEDB) (Vita et al. 2019), and NetCTL algorithm (version 1.2; Technical University of Denmark) (Larsen et al. 2007). In the SYFPEITHI and NetCTL algorithms, the number of assigned points is proportional to the binding affinity of the peptide to the HLA-A*0201 molecule, while for the IEDB algorithm, it is inversely proportional.
Twelve peptides from SPAG9 and twelve peptides from NY-REN-60, selected based on their highest-ranking positions predicted by the algorithms, were selected (Table 1).
SPAG9 and NY-REN-60 derived T cell epitope peptides predicted by computer algorithms SYFPEITHI, IEDB, and NetCTL
| Peptide | Peptide sequence | Peptide position | SYFPEITHI ranking | IEDB ranking | NetCTL ranking |
|---|---|---|---|---|---|
| S1 | SLLGGITVV | 837 | 32 | 0.4 | 1.27 |
| S2 | ALADGTLAI | 1016 | 29 | 0.7 | 1.42 |
| S3 | AIIESTPEL | 343 | 29 | 1.6 | 1.30 |
| S4 | ELMPLVVAV | 49 | 28 | 0.4 | 1.03 |
| S5 | VMSERVSGL | 19 | 26 | 1.6 | 1.21 |
| S6 | RLMELQEAV | 521 | 25 | 0.3 | 1.20 |
| S7 | SLFEELSSA | 381 | 25 | 1.0 | 1.19 |
| S8 | KLKDSILSI | 998 | 26 | 2.3 | 1.34 |
| S9 | VLQGELEAV | 447 | 28 | 1.7 | 1.02 |
| S10 | AVLENLDSV | 56 | 26 | 1.8 | 1.07 |
| S11 | LILENTQLL | 413 | 26 | 3.0 | 1.08 |
| S12 | DLIAKVDEL | 433 | 28 | 5.6 | - |
| N1 | WLLSGGVYV | 162 | 26 | 0.4 | 1.26 |
| N2 | SLFGMPLIV | 1099 | 26 | 0.5 | 1.23 |
| N3 | FMNSSIQCV | 744 | 24 | 0.4 | 1.49 |
| N4 | SLSEGLFNA | 231 | 24 | 0.5 | 1.26 |
| N5 | FLVPRDPAL | 1311 | 25 | 0.9 | 1.33 |
| N6 | LLFQVCHIV | 355 | 24 | 0.43 | 1.23 |
| N7 | LLAFLLDGL | 829 | 29 | 1.3 | 1.08 |
| N8 | GLHEDLNRV | 836 | 28 | 1.3 | 1.10 |
| N9 | LLDDEDHKL | 679 | 26 | 2.0 | 1.60 |
| N10 | NLIVGLVLL | 79 | 30 | 1.6 | 0.93 |
| N11 | FLCAFEIPV | 991 | 22 | 0.1 | 1.37 |
| N12 | MMRTELYFL | 1083 | 23 | 0.9 | 1.24 |
IEDB, immune epitope database; SYFPEITHI, Synthetic Peptide Homologous to T-cell Epitopes and its Interactions.
All peptides were synthesized by JPT Peptide Technologies (Berlin, Germany). The purity of the peptides was at least 95%, as determined by high-performance liquid chromatography (HPLC). All peptides were diluted in DMSO and PCR-grade clean water under sterile conditions.
The T2 peptide-binding assay was performed to evaluate the ability of in silico-predicted peptides to bind the HLA-A*0201 molecule in vitro. The T2 cell line was obtained from the DSMZ-German Collection of Microorganisms and Cell Cultures GmbH (Braunschweig, Germany) and cultured in RPMI 1640 medium (Biochrom) supplemented with 10% FBS (Biochrom) and 1% antibiotics (Penicilin-Streptomycin-Neomycin Solution Stabilized, Sigma Aldrich).
T2 cells (4 × 10⁶/one peptide) were pulsed with a series of seven concentrations of peptides (range 0.5–50 μg/mL) or with 1 μL of DMSO as a NC, supplemented with 5 μg/mL beta-2 microglobulin (Sigma Aldrich) and incubated for 18 h in 5% CO2 at 37°C. Afterwards, cells were washed and incubated with fluorochrome-labeled monoclonal antibody anti-HLA-A2 FITC for 15 min at RT in the dark, then washed twice with PBS. Cells were analyzed using a FACSLyric (Becton Dickinson) and FACS Suite software (version 1.5, Becton Dickinson). The fluorescence intensity (FI) factor was calculated as the ratio of the mean fluorescence intensity (MFI) of HLA-A*0201 on T2 cells with peptide to the MFI of HLA-A*0201 on T2 cells without peptide, using the formula FI = MFI (T2 with peptide)/MFI (T2 without peptide) (Gross et al. 2004).
Mixed lymphocyte peptide culture (MLPC) was used to determine the immunogenicity of synthesized peptides in an in vitro model of the immune response.
CD8+ cells from HLA-A*0201-positive CML patients were separated using CD8 magnetic microbeads (Miltenyi Biotec, Bergisch Gladbach, Germany) and MS magnetic-activated cell sorting (MACS) columns (Miltenyi Biotec) according to the manufacturer’s instructions. CD8- cells, representing antigen-presenting cells (APC), were irradiated with 25 Gy and incubated for 2 h with 20 μg/mL of the respective peptide derived from (I) NY-REN-60 (N11, FLCAFEIPV), and (II) SPAG9 (S4, ELMPLVVAV), (III) a mixture of peptides derived from RHAMM-R3165–173, WT1126–134, PRAME300–309, MPP11437–445, Aur-A207–215, BCR-ABL922–930, and PR3-PR1169–177 (10 μg/mL of each peptide), (IV) without any peptide as a NC. The sequences of the peptides used in the peptide mixture are shown in Table 2. Afterwards, CD8− cells were mixed with CD8+ cells in a 4:1 ratio and incubated in CTL Test Medium (CTL, Cleveland, OH, USA), supplemented with 10% FBS and 1% antibiotics in 5% CO2 at 37°C. After an overnight incubation, the cells were stimulated with 2.5 ng/mL human interleukin (IL)-2 (Sigma Aldrich) and 20 ng/mL recombinant human IL-7 (Sigma Aldrich). Cells were restimulated with IL-2, and IL-7 was added every 3 days.
Sequences of peptides used in the peptide mix in the MLPC
| Peptide | Peptide sequence |
|---|---|
| RHAMM-R3165–173 | ILSLELMKL |
| WT1126–134 | RMFPNAPYL |
| PRAME300–309 | ALYVDSLFFL |
| MPP11437–445 | STLCQVEPV |
| Aur-A207–215 | YLILEYAPL |
| BCR-ABL922–930 | GFKQSSKAL |
| PR3-PR1169–177 | VLQELNVTV |
MLPC, mixed lymphocyte peptide culture.
After 7 days, the cells were restimulated by freshly irradiated CD8− cells incubated with the respective peptides in the same order and concentrations as described above, and half of the medium was changed. After 14 days, specific IFN-γ and granzyme B release from CD8+ cells was assessed in an ELISpot assay (Diaclone, Besançon, France).
Assessment of specific IFN-γ and granzyme B release was performed using Human IFN-γ/Granzyme B Dual ELISpot according to the manufacturer’s protocol (Diaclone).
First, 96-well polyvinylidene fluoride (PVDF) bottomed plates were treated with 35% ethanol and coated with anti-IFN-γ and anti-granzyme B capture antibodies. After overnight incubation at 4°C, the plates were washed with PBS. Afterwards, the blocking buffer, consisting of liquid milk and PBS in a 1:1 ratio, was added to each well in triplicate and incubated for 2 h at RT. Simultaneously, T2 cells were pulsed for 2 h at 37°C with respective peptides derived from (I) NY-REN-60 (N11, FLCAFEIPV) and (II) SPAG-9 (S4, ELMPLVVAV), or (III) mixture of peptides: RHAMM-R3165–173, WT1126–134, PRAME300–309, MPP11437–445, Aur-A207–215, BCR-ABL922–930, and PR3-PR1169–177, (IV) without any peptide as a NC (in the same order as CD8-cells were pulsed), or (V) with the non-specific positive control, Pokeweed Mitogen (PWM, Sigma Aldrich). Plates were washed with PBS, then CD8+ T cells (1 × 10⁴) and T2 cells (4 × 10⁴) were added to each well in triplicate and incubated for 15–20 h in 5% CO2 at 37°C. After incubation, plates were washed with 0.05% Tween-PBS Solution (Tween 20, Bio-Rad, Hercules, CA, USA). Next, the detection antibodies were added to each well and incubated for 1.5 h at RT. The plates were then washed with 0.05% Tween PBS Solution, after which streptavidin-alkaline phosphatase (AP) and anti-FITC anti-Horseradish Peroxidase (HRP) conjugates were added to each well and incubated for 1 h at RT. The plates were then washed with 0.05% Tween-PBS Solution, then 3-amino-9-ethylcarbazole (AEC) and BCIP/NBT (5-bromo-4-chloro-3-indolyl phosphate/nitroblue tetrazolium) buffers were added to each well to visualize the presence of colored spots. Cells producing IFN-γ appeared as red or brownish spots, while those producing granzyme B appeared as blue or purple spots. Results were evaluated using an ImmunoSpot ELISPOT reader (CTL, Shaker Heights, OH, USA).
Statistical analysis and data visualization were performed using R software, version 4.1.3 (R Foundation for Statistical Computing, Vienna, Austria) and GraphPad Prism 8 software (GraphPad Software, San Diego, CA, USA). A p-value <0.05 was considered statistically significant. Where applicable, p-values were adjusted for multiple comparisons using the Benjamini-Hochberg procedure to maintain a false discovery rate of 5% (Benjamini and Hochberg 1995). Confidence intervals (CI) were calculated at the 95% level. For comparisons of continuous or ordinal variables between two independent patient subgroups, the Mann–Whitney U test was utilized. For comparisons involving more than two independent subgroups, the Kruskal–Wallis test was applied. The survival analysis included data from 69 patients. To investigate the association between immune cell populations and recurrence risk, a Cox proportional hazards model was developed using the survival package in R. This approach was chosen to model time-to-recurrence, with outcomes and model predictions considered at specific follow-up intervals (0 month, 3 months, 6 months, 9 months, and 12 months). The mathematical formulation of the Cox proportional hazards model is expressed as:
For the development of the multivariable Cox model, predictors were selected using a bidirectional stepwise procedure guided by the Akaike information criterion (AIC). The AIC informed the selection process by balancing the model’s log-likelihood against the number of included parameters, thereby penalizing excessive complexity. The objective of this iterative procedure was to derive a parsimonious model with optimal predictive utility while minimizing the risk of overfitting. The final model incorporated iNKT+CD161+, CD8+PD1+, and CD56dim16+PD1+ as predictors. The model’s performance was evaluated by examining hazard ratios (HRs) with their 95% CI, p-values for individual predictors, and the Concordance Index (C-index) for overall discriminative ability. The proportional hazards assumption, critical for the validity of the Cox model, was verified using Schoenfeld residual tests. Furthermore, Pearson correlation analysis among the selected predictors revealed weak correlations (|r| < 0.15), indicating minimal multicollinearity and suggesting that each variable contributed independent information. To assess the stability of the variable selection process and the robustness of the final model, bootstrap resampling (100 iterations) was employed. This validation step focused on the consistency of variable inclusion and the variability of the AIC, aiming to ensure the model’s generalizability and minimize the risk of overfitting. Forest plots, generated using the ggforest function within the survminer package in R, were utilized to visualize the HR and 95% CI for the predictors in the final model.
The study screened the expression of genes encoding the analyzed tumor antigens. Expression of the HMMR (Me = 94.51), PRTN3 (Me = 752.53), AURKA (Me = 56.11), and DNAJC2 (Me = 55.32) genes was demonstrated in all analyzed patients. SPAG9 gene expression (Me = 51.10) was shown in 97.67% (42/43) of patients, WT1 (Me = 26.79), and USP32 (Me = 55.99) gene expression was shown in 95.35% (41/43) of the CML patients, while PRAME gene expression (Me = 65.43) was shown in 90.70% (39/43) of the patients.
The results of the Kruskal–Wallis test showed statistically significant differences between the analyzed genes (p < 0.0001). The Mann–Whitney test showed statistically significantly higher gene expression of the following genes (Figure 1):
HMMR compared to WT1 (94.51 vs. 26.79; p = 0.02),
PRTN3 compared to HMMR (752.50 vs. 94.51; p < 0.01),
PRTN3 compared to WT1 (752.50 vs. 26.79; p < 0.0001),
AURKA compared to WT1 (56.11 vs. 26.79; p = 0.01),
DNAJC2 compared to WT1 (55.32 vs. 26.79; p = 0.03),
USP32 compared to WT1 (55.99 vs. 26.79; p = 0.04),
SPAG9 compared to WT1 (51.10 vs. 26.79; p = 0.03),
PRTN3 compared to AURKA (752.50 vs. 56.11; p < 0.0001),
PRTN3 compared to DNAJC2 (752.50 vs. 55.32; p < 0.0001),
PRTN3 compared to USP32 (752.50 vs. 55.99; p < 0.0001),
PRTN3 compared to SPAG9 (752.50 vs. 51.10; p < 0.0001),
PRTN3 compared to PRAME (752.50 vs. 65.43; p < 0.01).
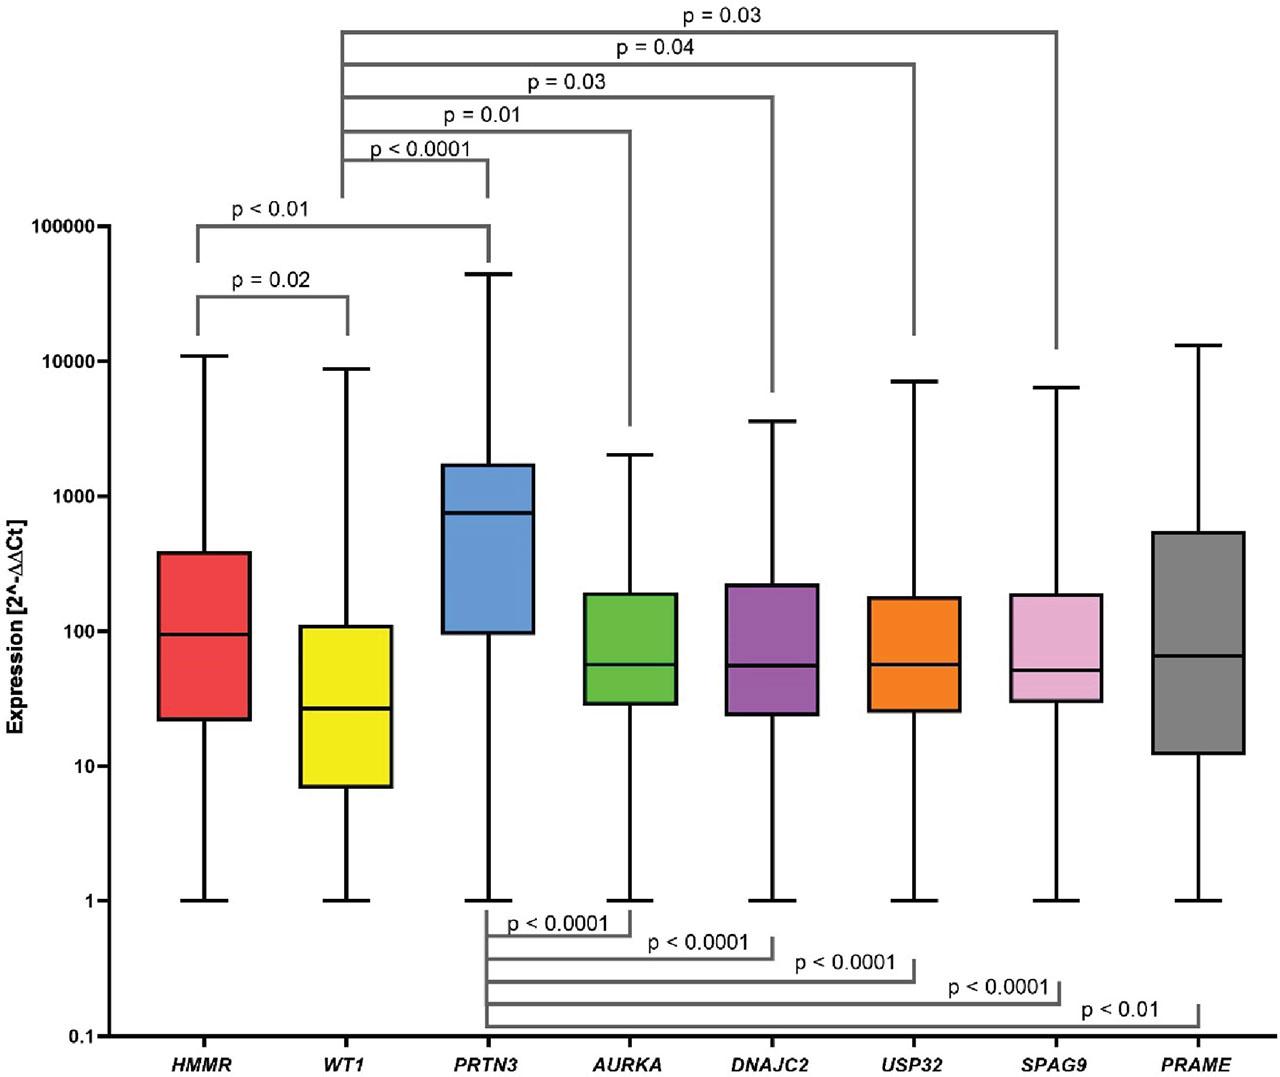
Screening of HMMR, WT1, PRTN3, AURKA, DNAJC2, USP32, SPAG9, and PRAME gene expression in CML patients. The data is presented in a box and a whisker plot, where the whiskers indicate the min-max value, and the box marks the median. We observed statistically significant higher gene expression of HMMR vs. WT1, AURKA vs. WT1, DNAJC2 vs. WT1, USP32 vs. WT1, SPAG9 vs. WT1, PRTN3 vs. HMMR, WT1, AURKA, DNAJC2, USP32, SPAG9, and PRAME. In the remaining pairs, no statistical significance was obtained. CML, chronic myeloid leukemia.
No statistically significant differences in expression were shown between the other pairs of genes.
Spearman correlation was used to assess the correlation of expression between the analyzed genes (Figure 2). Very strong positive correlations were shown between HMMR and USP32 (r = 0.93, p < 0.0001, Figure 2a), and USP32 and SPAG9 (r = 0.93; p < 0.0001, Figure 2b). Moreover, there were strong positive correlations between HMMR and PRTN3 (r = 0.69; p < 0.0001, Figure 2c), HMMR and AURKA (r = 0.62; p < 0.0001, Figure 2d), PRTN3 and AURKA (r = 0.69; p < 0.0001, Figure 2e), and AURKA and DNAJC2 (r = 0.64, p < 0.0001, Figure 2f). In addition, moderate positive correlations were observed between HMMR and WT1 (r = 0.44, p < 0.01, Figure 2g), AURKA and USP32 (r = 0.49, p = 0.001, Figure 2h), AURKA and SPAG9 (r = 0.55; p < 0.001, Figure 2i), DNAJC2 and USP32 (r = 0.54; p < 0.001, Figure 2j) and DNAJC2 and SPAG9 (r = 0.54; p < 0.001, Figure 2k). A weak positive correlation was also noted between WT1 and PRTN3 (r = 0.35; p = 0.03, Figure 2l). Among the remaining genes, correlations were not statistically significant.
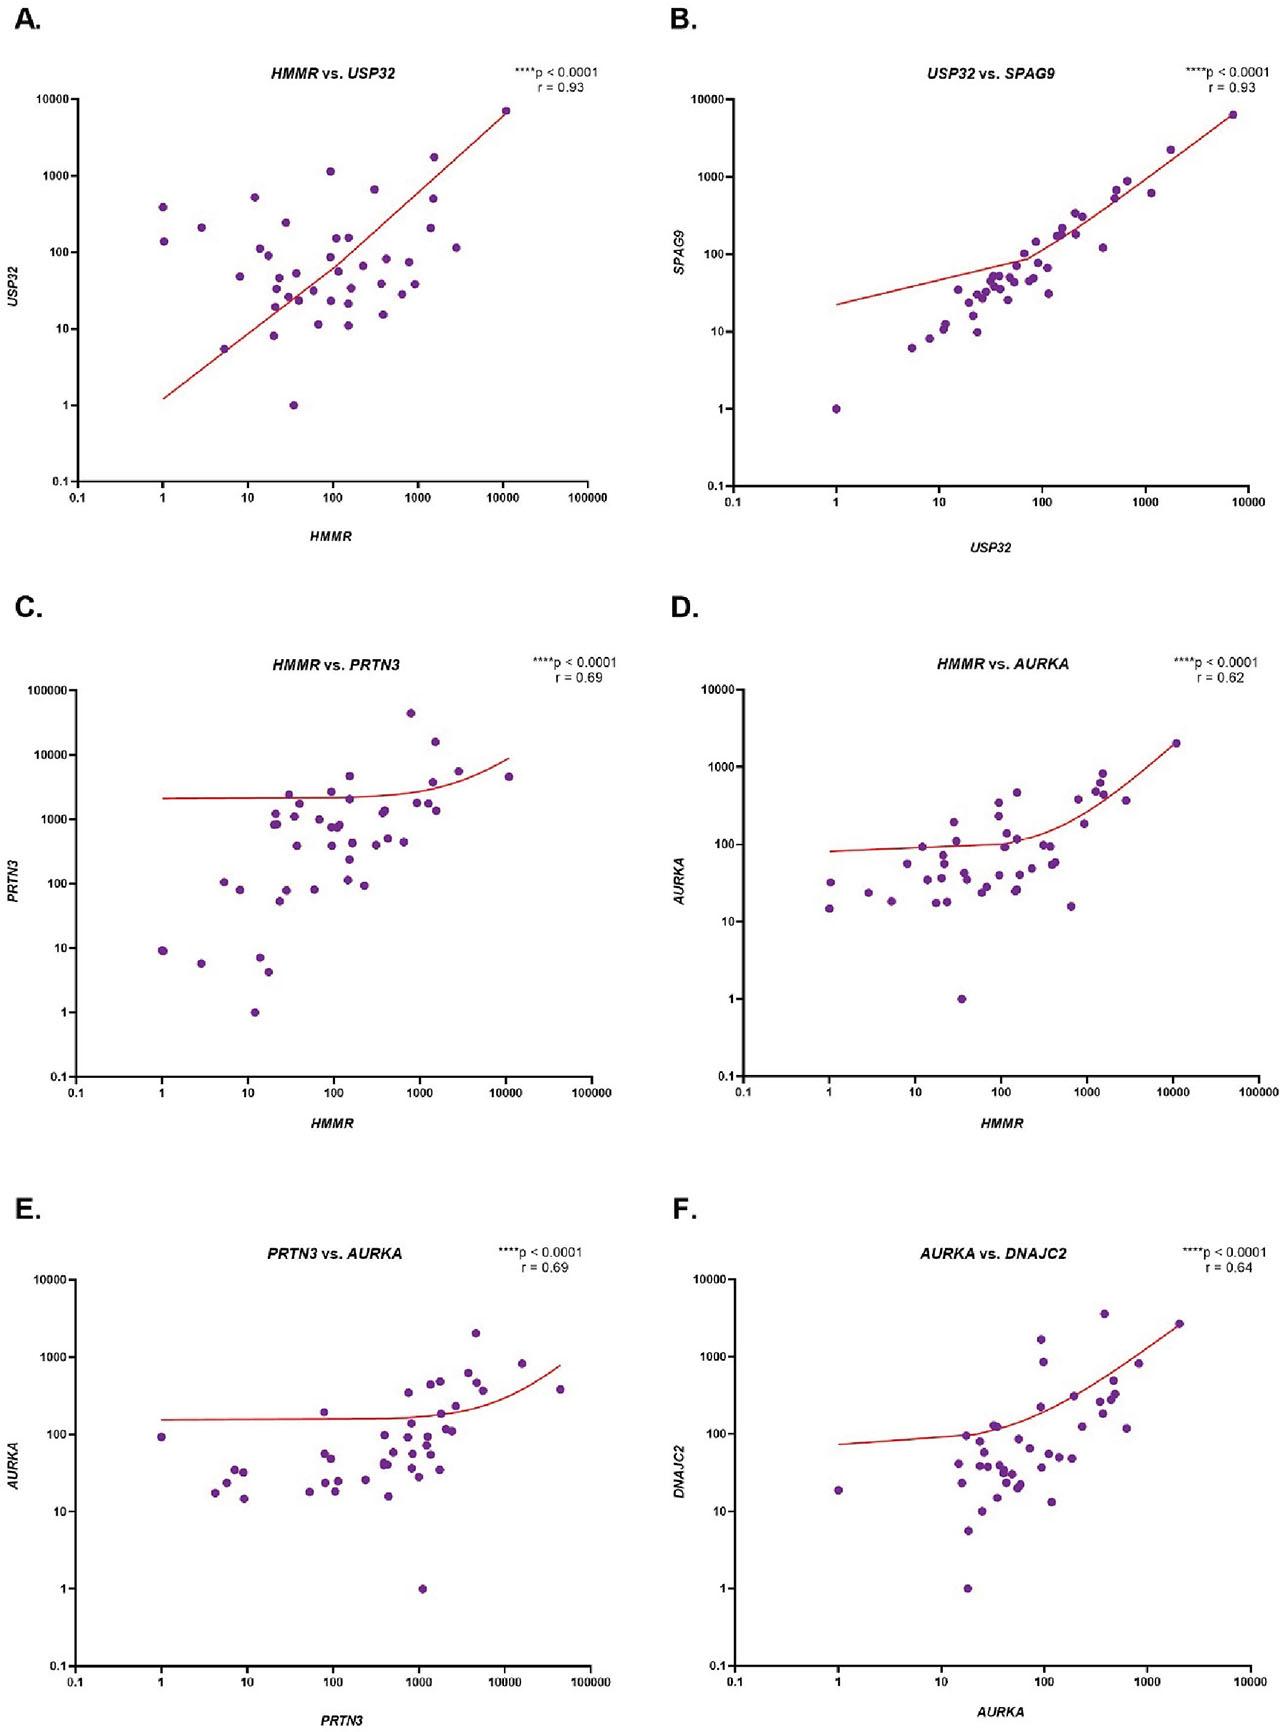
Evaluation of the correlation of HMMR, WT1, PRTN3, AURKA, DNAJC2, USP32, SPAG9 and PRAME gene expression in CML patients. The results are presented as the log10 value of 2−ΔΔCt with the regression line marked. The graph shows only statistically significant correlations between HMMR and USP32 (A), USP32 and SPAG9 (B), HMMR and PRTN3 (C), HMMR and AURKA (D), PRTN3 and AURKA (E), AURKA and DNAJC2 (F), HMMR and WT1 (G), AURKA and USP32 (H), AURKA and SPAG9 (I), DNAJC2 and USP32 (J), DNAJC2 and SPAG9 (K), WT1 and PRTN3 (L). CML, chronic myeloid leukemia.
An assessment of the correlation between the expression of the HMMR, WT1, PRTN3, AURKA, DNAJC2, USP32, SPAG9, and PRAME genes, and CML patients’ age and gender was performed. No statistically significant correlation was found between the expression of any of the analyzed genes and either age (Table 1 in Supplementary Materials) and gender (Figure 1 in Supplementary Materials).
Based on the obtained results, the peptide S4 was selected from the SPAG9 antigen, and the N11 peptide from the NY-REN-60 antigen, characterized by the highest intensity of receptor fluorescence compared to the NC (Figure 3). The ELISpot functional test was performed to assess whether the selected peptides trigger an immune response of T lymphocytes.
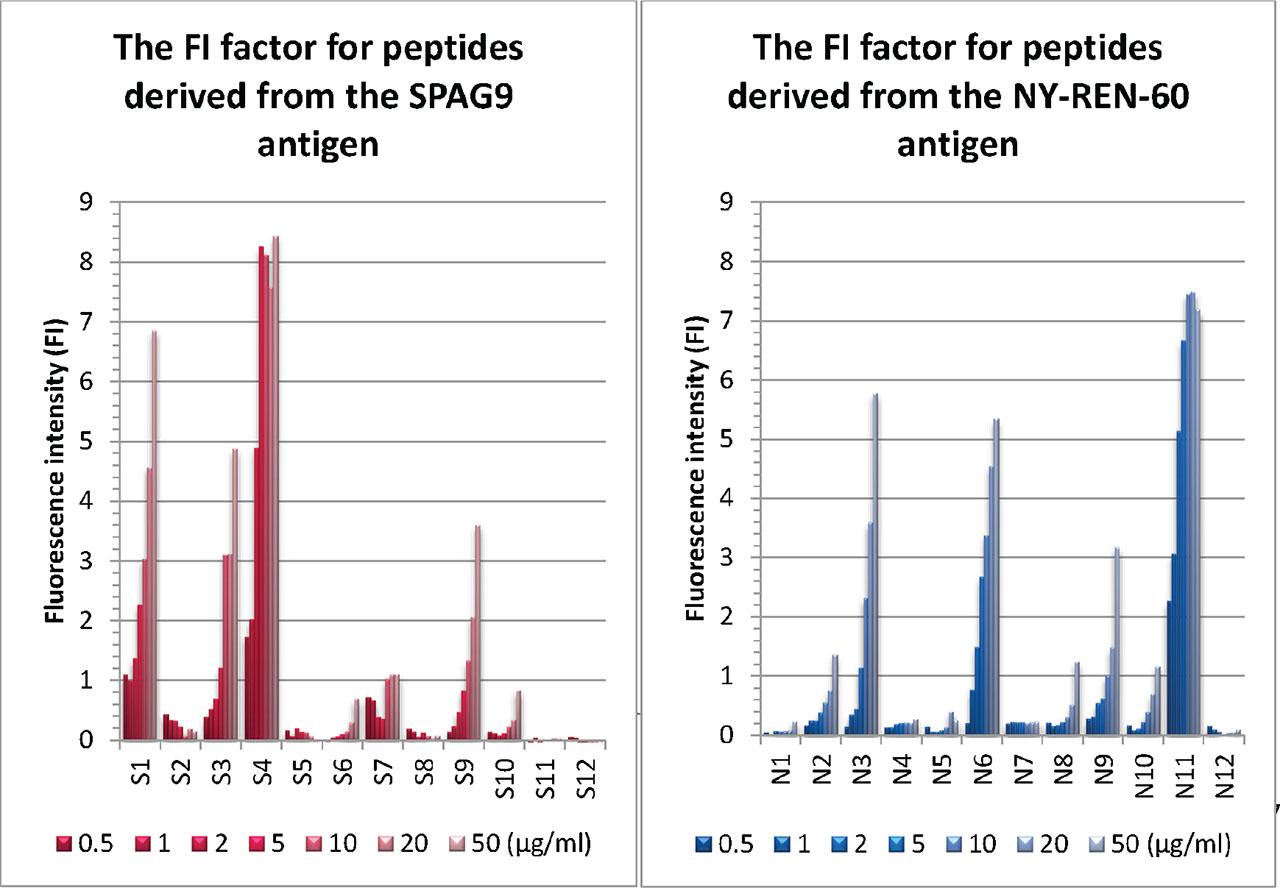
FI factor for peptides derived from SPAG9 and NY-REN-60 antigens in the T2 peptide-binding assay. The affinity of 12 newly synthesized peptides (from SPAG9: S1–S12; from NY-REN-60: N1-N11) to the HLA-A2 receptor was assessed by adding the peptides at specific concentrations: 0.5 μg/mL, 1 μg/mL, 2 μg/mL, 5 μg/mL, 10 μg/mL, 20 μg/mL, and 50 μg/mL to the T2 cell line using two replicates. The FI factor was calculated as the ratio of the MFI of HLA-A*0201 on T2 cells with peptide to the MFI of HLA-A*0201 on T2 cells without peptide, using the formula FI = MFI (T2 with peptide)/MFI (T2 without peptide). FI, Fluorescence intensity; MFI, mean fluorescence intensity.
We detected specific cytotoxic immune responses against S4 and N11 peptides derived from SPAG9 and NY-REN-60 antigens, respectively. Furthermore, a specific cytotoxic immune response, defined by granzyme B release, was observed in two out of three patients at the moment of imatinib discontinuation, which was more intense than the mixture of previously known immune-driven peptides with documented efficacy from RHAMM-R3, WT1, PRAME, MPP-11, Aur-A, BCR-ABL, and PR3-PR1 antigens. The granzyme B-mediated response suggests potent cytotoxic antitumor activity of immune cells. Interestingly, the patient in whom no lymphocyte activation was detected as a result of stimulation with peptides derived from tumor antigens had a disease recurrence already at 3 months after imatinib withdrawal, in contrast to the other two patients who remained in remission. In addition, a very weak immune response defined by IFN-γ release was detected, possibly due to the short duration of cell culture.
These results may indicate that SPAG9 and NY-REN-60 allow immune recovery to occur more rapidly during imatinib treatment than the standard peptide mixture known so far. Figure 4 shows the results of IFN-γ (red, brownish dots) and granzyme B (blue dots) release by T cells in response to peptide stimulation and a non-specific positive control (PWM). The response to tumor antigens tested as a peptide mix is very weak, which may be due to the lack of expression in these patients or due to imatinib-induced transient recalibration of the immune system, with cytotoxic mechanisms dominating. Since IFN-γ is a marker of Th1-type response and is usually released by helper T cells and some subpopulations of cytotoxic cells, its absence may result from preferential activation of CTL, which are more focused on direct destruction of tumor cells than on IFN-γ secretion. The poor response in terms of IFN-γ release may also be due to too low a concentration of the peptides used in the assay.
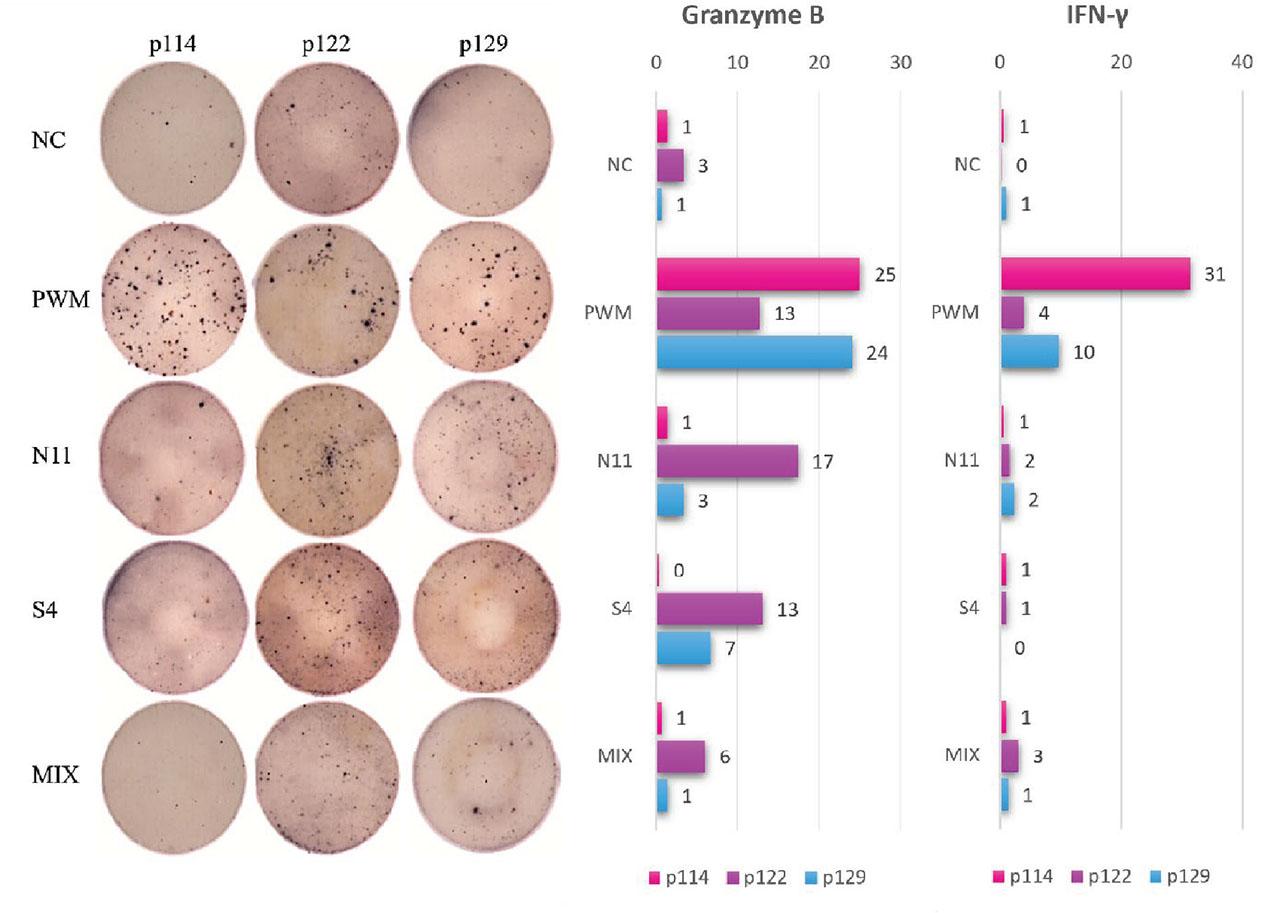
Results of specific IFN-γ (red, brownish dots) and granzyme B (blue dots) release in response to peptide derived from tumor-associated antigens stimuli. The ELISpot assay was performed after mixed lymphocyte-peptide culture. CD8+ cells were pulsed with CD8− cells stimulated by N11 peptide derived from NY-REN-60 antigen and S4 peptide derived from SPAG9 antigen, as well as the mixture of peptides: RHAMM-R3165–173, WT1126–134, PRAME300–309, MPP11437–445, Aur-A207–215, BCR-ABL922–930, and PR3-PR1169–177. NC was CD8+ CML cells cultured without any peptide; PWM as a non-specific control was added to NC cells on ELISpot plates. IFN-γ and granzyme B spots were obtained from 104 cytotoxic T cells per well and spot averages were calculated from triplets. CML, chronic myeloid leukemia; ELISpot, Enzyme-Linked ImmunoSpot; IFN-γ, interferon-γ; NC, negative control; PWM, pokeweed mitogen.
The stronger response was described in patient no. 122, and it was characterized by the presence of normal blood morphology, indicative of a healthy state. The p122 noted an increased frequency of DC and a reduced expression of PD1 on both DCs and NK cells compared to p114, characterized by a weak immune response. In addition to the weaker immune response, this patient also had lower levels of CD8+ T cells. The number of regulatory T cells in the relapsed patient (p114) was nearly three times higher than in the patient who remained in remission. This increase may suppress the immune response, promoting the survival of LSC and ultimately leading to disease relapse after treatment discontinuation. The impairment of the immune response in patient p114 may also be related to the depth of the molecular response, which reached the level of MR4.5, while in patients p122 and p129, the BCR::ABL1 transcript (MR5.0) was not detected at the time of imatinib discontinuation. Moreover, the duration of imatinib treatment and the duration of DMR before the TFR attempt, which was shorter in patient number 114 (54 months and 46 months, respectively) compared to patient number 122 (vs. 66 months and 57 months) and 129 (vs. 73.5 months and 55 months), may be important factors in the relapse of leukemia (Hughes and Ross 2016).
The Cox proportional hazards model with time intervals but without time-dependent covariates was used to evaluate the prognostic value of specific immune cell populations. The model was built using time-split data, where each observation corresponds to a specific time interval (start, stop). The validity of this approach was confirmed by the Schoenfeld residual test, which did not indicate a violation of the proportional hazards assumption (p > 0.05 for all covariates). Classical prognostic scores (Sokal, EUTOS, ELTS) were available for a subset of patients only and therefore, were not incorporated into the present Cox regression model. Given that all patients in this cohort had already achieved DMR at the time of TKI discontinuation, our analysis was designed to specifically focus on immune predictors of molecular recurrence. The final multivariate model, developed through a stepwise selection procedure, was specified as follows:
The results of both the univariate and final multivariate analyses are summarized in Table 3. The multivariate model identified three significant independent predictors of recurrence. A higher percentage of iNKT+CD161+ cells was strongly associated with a protective effect (HR = 0.09, p = 0.001), while higher levels of both CD8+PD1+ cells (HR = 1.03, p < 0.001) and CD56dimCD16+PD1+ cells (HR = 1.12, p < 0.001) were associated with an increased risk.
Univariate and multivariate Cox proportional hazards analysis of immune cell populations for recurrence risk
| Variable | Univariate analysis | Multivariate analysis | ||
|---|---|---|---|---|
| HR (95% CI) | p-value | HR (95% CI) | p-value | |
| iNKT+CD161+ | 0.32 (0.11–0.94) | 0.039 | 0.09 (0.02–0.40) | 0.001 |
| CD8+PD1+ | 1.03 (1.02–1.05) | <0.001 | 1.03 (1.02–1.05) | <0.001 |
| CD56dimCD16+PD1+ | 1.06 (1.01–1.11) | 0.024 | 1.12 (1.05–1.19) | <0.001 |
CI, confidence interval; HR, hazard ratio.
The table displays the results from both univariate and multivariate Cox proportional hazards models. HRs, 95% CI, and p-values are shown for the three predictors included in the final multivariate model. HR < 1 indicates a protective effect, while HR > 1 indicates an increased risk of recurrence.
The model, based on 189 observations (64 events), demonstrated good predictive accuracy (C-index = 0.735), with highly significant results in the likelihood ratio test, Wald test, and log-rank test (p < 10–⁶) (Figure 2 in Supplementary Materials).
To further assess the model’s clinical relevance, patients were stratified into high-risk and low-risk groups based on the linear predictor (risk score) derived from the Cox model. The median risk score was used as the threshold, classifying patients accordingly. Kaplan–Meier survival analysis showed a clear separation between the two groups, with the high-risk group exhibiting significantly worse recurrence-free survival (Figure 5). Conversely, patients in the low-risk group demonstrated longer recurrence-free intervals, reinforcing the protective role of iNKT+CD161+ and the potential negative impact of CD8+PD1+ and CD56dimCD16+PD1+. The observed differences were statistically significant (p < 0.05), confirming the model’s ability to effectively differentiate between risk categories.
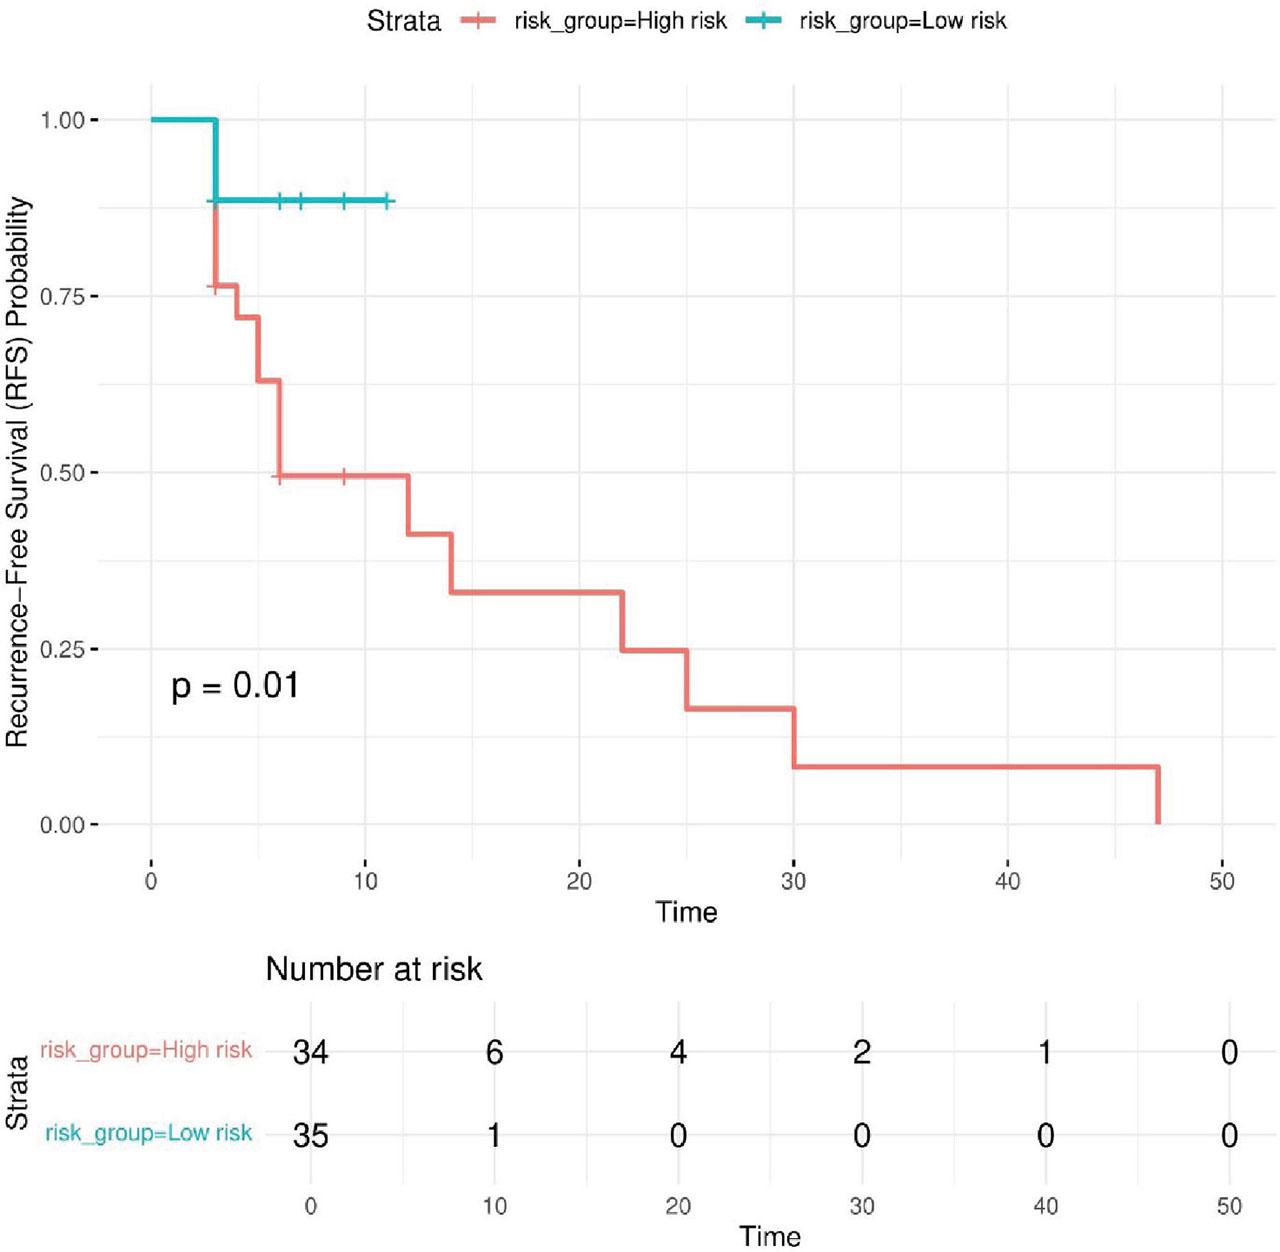
Kaplan–Meier survival curves for high-risk and low-risk patient groups. The Kaplan–Meier plot illustrates RFS in patients stratified into high-risk and low-risk groups based on the median risk score derived from the Cox proportional hazards model and appropriately colored. The survival curves show a clear separation between the two groups, with the high-risk group exhibiting significantly worse RFS, while the low-risk group demonstrates longer recurrence-free intervals. The p-value (p < 0.05) indicates that the difference between the groups is statistically significant, confirming the model’s ability to distinguish between different risk categories. RFS, recurrence-free survival.
To assess the stability and generalizability of the model, we performed non-parametric bootstrap validation with 100 resampling iterations. The bootstrap analysis yielded the following results: Original AIC = 436.375, indicating the model’s relative goodness-of-fit, Bias = 1.212, suggesting minimal overfitting, and Standard error = 43.152, reflecting variability in AIC across bootstrap samples. These results confirm that the model remains robust across different resampled datasets, with only minor variation in performance metrics. The low bias indicates that the model’s estimates are stable, and the observed variability in AIC suggests that the model retains predictive value despite potential dataset fluctuations. The full results of both univariate and multivariate Cox regression analyses are summarized in Tables 2 and 3 in Supplementary Materials, respectively.
These findings demonstrate that the Cox model effectively identifies immune markers associated with recurrence risk. The results suggest that iNKT+CD161+ may have a protective role, while CD8+PD1+ and CD56dimCD16+PD1+ cells are linked to an increased hazard, indicating their potential contribution to poorer outcomes. Bootstrap validation confirms the model’s robustness, showing minimal overfitting and consistent predictive performance. Overall, these results underscore the potential of immune profiling as a valuable tool for patient stratification and recurrence risk assessment in clinical practice.
Importantly, the identified associations are biologically plausible: higher frequencies of iNKT+CD161+ cells may contribute to effective immune surveillance and elimination of residual leukemic clones, whereas elevated CD8+PD1+ T cells and PD1+ NK cells are consistent with an exhausted phenotype associated with impaired cytotoxic function and a higher risk of molecular relapse.
The immune system is thought to be crucially implicated in the control of CML, but it is uncertain to what extent the endogenous immune response maintains control of CML during TKI therapy in the chronic phase or after discontinuation of TKI administration. This study aimed to investigate the expression of tumor genes to characterize CML patients at diagnosis. Besides, we followed the immune responses in 78 CML patients who discontinued imatinib therapy, additionally assessing effector mechanisms of CTL in three patients with DMR that could influence extended remission or relapse using the MLPC in an in vitro model of the immune response. Our results provide evidence of tumor antigen presentation in newly diagnosed CML patients and suggest that cytotoxic immune responses may be associated with long-term remission after discontinuation of TKI. However, we emphasize that our observations are associations, not establishing a causal relationship between immune activity and leukemia control.
Expression of the HMMR, WT1, PRTN3, AURKA, DNAJC2, USP32, SPAG9, and PRAME genes was detected in more than 90% of patient samples. Strong positive correlations existed between HMMR and USP32, and between USP32 and SPAG9, suggesting a potential co-regulatory process that would be associated with modulating leukemic cell survival and immune recognition. Interestingly, the strong expression and correlation between the USP32 gene, which encodes NY-REN-60, and SPAG9, which encodes SPAG9, may potentially reflect the anticancer vaccine value of such antigens, considering the particular immune response of CD8+ lymphocytes against in silico-designed peptides N11 of NY-REN-60 and S4 of SPAG9 that we identified in functional studies. While previous studies have documented the immunogenicity of these antigens in solid tumors (Greiner and Schmitt 2008; Kanojia et al. 2010; Šmahel 2011; Li et al. 2012, 2024; Hu et al. 2017; Pan et al. 2018; Dou et al. 2020; Xiu et al. 2023), their role in hematological malignancies, including CML, remains to be further elucidated.
The previous studies indicate that tumor antigen expression is implicated in immune-mediated regulation of leukemia (Clark and Christmas 2001; Clark et al. 2001; Rezvani et al. 2003; Giannopoulos et al. 2009). The identification of these antigens is valuable to provide a glimpse into antigenic targets that have the potential to be useful for future immunotherapeutic treatments in CML, based on peptide vaccines or antibody-drug conjugates, as well as for specific immunotherapies aimed at enhancing the graft-versus-leukemia effect after alloSCT (Greiner and Schmitt 2008). Initial clinical trials demonstrated that vaccination with BCR::ABL1 peptides could induce a leukemia-specific T cell response and transient reductions in BCR::ABL1 transcript levels (Cathcart et al. 2004; Bocchia et al. 2005; Rojas et al. 2007; Abruzzese et al. 2009). However, the depth and durability of molecular responses were limited, highlighting the challenges of early peptide-based vaccination approaches. Importantly, recent long-term data have reshaped this perspective. The two multicenter phase II trials with 10-year follow-up (Sicuranza et al. 2025) demonstrated that BCR::ABL1 (e14a2- and e13a2-derived peptides) peptide vaccination during TKI therapy is safe, devoid of off-target toxicity, and capable of sustaining TFR, suggesting that peptide-based immunotherapy in CML deserves renewed clinical consideration. WT1, another well-characterized LAA, was also shown in case reports to elicit peptide-specific cytotoxic T-cell responses in patients with myeloid malignancies, including CML, although clinical effects were modest and often transient (Narita et al. 2010; Oji et al. 2010; Takahashi 2015). However, vaccines directed against WT1 combined with PR1 or PRAME may further improve targeting of leukemic cells, increasing response rates (Rezvani et al. 2008; Yong et al. 2008). This suggests that multiantigen strategies may overcome the limitations of single-antigen vaccines by inducing sustained long-term antileukemic responses. More recently, studies highlight that WT1 peptide vaccination can elicit deep molecular remissions and lasting CTL responses that persisted 12 years after vaccination cessation (Suwabe et al. 2024). Furthermore, clinical trials using PR1 peptide vaccines have induced specific CTL responses that correlate with clinical responses, including in patients with CML (Qazilbash et al. 2017). These findings provide a translational bridge between our immune profiling results and future vaccine-based therapeutic strategies aimed at enhancing TFR. The synergistic effect of vaccination with conventional TKI therapy may further reduce residual disease and, in TKI-resistant patients, may improve treatment outcomes, but further studies on the relationship between vaccination and patients’ clinical responses are warranted. In contrast, a randomized phase II trial comparing the K562/GM-CSF cell-based vaccine with IFN-α used in combination with a TKI showed that vaccinated individuals had lower TFR rates than the IFN-α group, highlighting the potential benefit of IFN-α therapy in combination (Webster et al. 2021). However, the ENDURE CML-IX trial did not demonstrate an improvement in TFR rates after initiating IFN-α therapy after TKI treatment discontinuation (Burchert et al. 2022). The impact of maintaining IFN-α therapy on TFR when patients receive a combination of TKIs and IFNs before discontinuing TKI therapy may prove crucial. On the other hand, it is possible that enhancing the Th1 immune response alone may not be sufficient for long-term disease control. Studies of checkpoint immunotherapy have shown modest clinical benefit. Preclinical studies have shown that blocking the PD1/PDL1 interaction prolongs survival in a mouse model of CML (Mumprecht et al. 2009). However, in a phase 1b clinical trial, the combination of dasatinib with nivolumab failed to demonstrate significant clinical activity in patients with refractory or progressive CML (Martínez-López et al. 2021). A current phase II trial is underway, combining pembrolizumab (anti-PD1) with various TKIs (dasatinib, imatinib, nilotinib) in patients with persistent minimal residual disease (ClinicalTrials.gov: NCT03516279). These findings underscore the complexity of immune evasion in CML and suggest that enhancing immune recognition may not be sufficient to eliminate leukemic stem cells. Our findings add to the growing evidence that tumor antigen expression can modulate immune responses in leukemia, but further studies are required to establish their utility as targets for treatment. Functional studies showed peptide-specific cytotoxic T-cell responses against SPAG9 and NY-REN-60 antigens. The granzyme B release observed in two patients upon discontinuation of imatinib treatment suggests a functional cytotoxic response, potentially contributing to leukemia control. In contrast, the patient with relapse (p114) showed a lack of T-cell activation, which coincided with subsequent molecular relapse, suggesting that impaired immune responses may be associated with leukemia relapse. This patient’s immune profile, characterized by an increased percentage of Treg and elevated PD1 expression on DC and NK cells, reflects a depleted immune phenotype that potentially impairs leukemia surveillance. These observations are consistent with previous studies describing immune dysfunction in patients with relapsed CML (Rea et al. 2017; Fujioka et al. 2021; Kong et al. 2021).
Our Cox regression model identified significant immune markers for the risk of recurrence. The protective role of iNKT+CD161+ cells and the detrimental effect of CD8+PD1+ and CD56dimCD16+PD1+ cells suggest that some immune subsets may serve as predictive biomarkers for relapse (Patterson and Copland 2023). In this study, we emphasized for the first time the role of iNKT+CD161+ cells in TFR. The mechanism of action is linked to their cytotoxic activity and ability to modulate the anti-tumor response by activating other immune cells. Studies have indicated that there is a correlation between the functional capacity of iNKT and innate CD8+ T cells, suggesting their coordination in the anti-tumor immune response (Jacomet et al. 2017). iNKT+CD161+ indirectly activates CD8+ T cells and NK cells, whose elevated percentages have been established as functional predictive markers for effective TFR in CML (Hermans et al. 2003). Activation of iNKT+CD161+ leads to secretion of cytokines IFN-γ, enhancing the anti-tumor activity and activation of CD8+ T cells, and tumor necrosis factor α, triggering apoptosis of the remaining CML cells. Higher levels of activated CD8+ memory T lymphocytes are also observed in long-term remission patients, perhaps due to iNKT+CD161+ activity and part of long-term immunity against relapsed CML (Fujii et al. 2013; Barbarin et al. 2020). Studies have shown that CML patients in the chronic phase have functional impairments of iNKT cells (Rossignol et al. 2012). These impairments are normalized in patients in complete remission following TKI or IFN-α. Considering the reversible defect in iNKT cell function in patients responding to TKI therapy in CML patients, they may also be a prognostic factor in other cancers, such as multiple myeloma, in which an acquired dysfunction of these cells has been proven in the malignant growth of myeloma cells, which DC can overcome pulsed with the ligand alpha-galactosylceramide (α-GalCer) (Dhodapkar et al. 2003). In CML patients who achieved TFR without relapses within 12 months, surface expression of PD1 on iNKT cells was decreased compared with patients with relapses and even compared with healthy controls, indicating reduced exhaustion and increased functionality (Decroos et al. 2024). This suggests that iNKT cell function may be involved in disease control, and their ability to directly lyse tumor cells and induce DC maturation further supports their role in TFR (Bassiri et al. 2014). Strategies that enhance iNKT cell function, such as IFN-α, checkpoint inhibitors, or agonists like α-GalCer, may improve TFR rates. Furthermore, modulation of CD1d expression represents a novel target for restoring iNKT cell function (Basbous et al. 2016).In this study, we also observed an association between PD1 expression on CD8+ lymphocytes and NK cells with a cytotoxic CD56dimCD16+ immunophenotype and molecular recurrence of CML. This is consistent with our previous observations as well as other investigations describing the exhausted phenotype of cytotoxic cells as an unfavorable prognostic factor for CML patients (Hughes et al. 2017; Decroos et al. 2024; Kwaśnik et al. 2024). Taken together, these results suggest a model in which durable TFR depends on a balance between protective innate-like immunity and avoidance of exhaustion among cytotoxic effector cells. iNKT+CD161+ cells may play a crucial role in sustaining TFR via their innate cytotoxicity and capacity to orchestrate anti-leukemic responses, while the association of CD8+PD1+ T cells with relapse aligns with established evidence of immune exhaustion, which impairs effective antigen-specific responses. Similarly, the correlation between PD1+ NK cells and recurrence underscores a compromised innate immunity, corroborated by studies highlighting NK-cell dysfunction as a barrier to successful TFR. Future immunotherapeutic strategies should aim to enhance innate cell function while preventing T- and NK-cell exhaustion, with the ultimate goal of improving long-term molecular remission and TFR success.
It should be noted that molecular analyses of tumor-associated gene expression were performed in a separate cohort of 43 newly diagnosed patients, whereas cytomometric analyses and BCR::ABL1 kinetics were conducted in an independent cohort of 78 patients who discontinued TKI therapy. Due to the distinct nature of these patient groups, direct correlations between gene expression profiles and immunophenotypic or molecular remission data could not be performed. Nevertheless, both approaches provide complementary insights and offer complementary perspectives on CML biology: gene expression profiling at diagnosis highlights potentially immunogenic targets in CML, while immune profiling at TKI discontinuation identifies cellular predictors associated with sustained TFR. In a subset of three patients, additional functional assays were performed to explore cytotoxic activity against selected tumor peptides screened and newly synthesized ones derived from SPAG9 and NEWREN60. The goal of these exploratory analyses was to gain preliminary insight into the functioning of immune cells, which will allow us to understand the cellular mechanisms that could potentially sustain TFR.
Overall, our study highlights immune correlates associated with the maintenance of TFR and underscores the need for further research to clarify the mechanistic role of immune surveillance in CML. These findings underscore the need for larger studies to validate the predictive value of immune markers and explore therapeutic strategies that could enhance immune surveillance. Future research efforts should seek to validate the characterized immune markers in larger patient groups with assessment of cause-and-effect relationships and explore the efficacy of combination therapies, such as checkpoint inhibitors or LAA vaccines, in enhancing immune surveillance in CML. The incorporation of immune profiling into the clinic has the potential to transform patient management, enhancing outcomes and increasing the population of patients that can be offered successful TKI discontinuation (Irani et al. 2020; Fassoni et al. 2025).