
Fig 1.
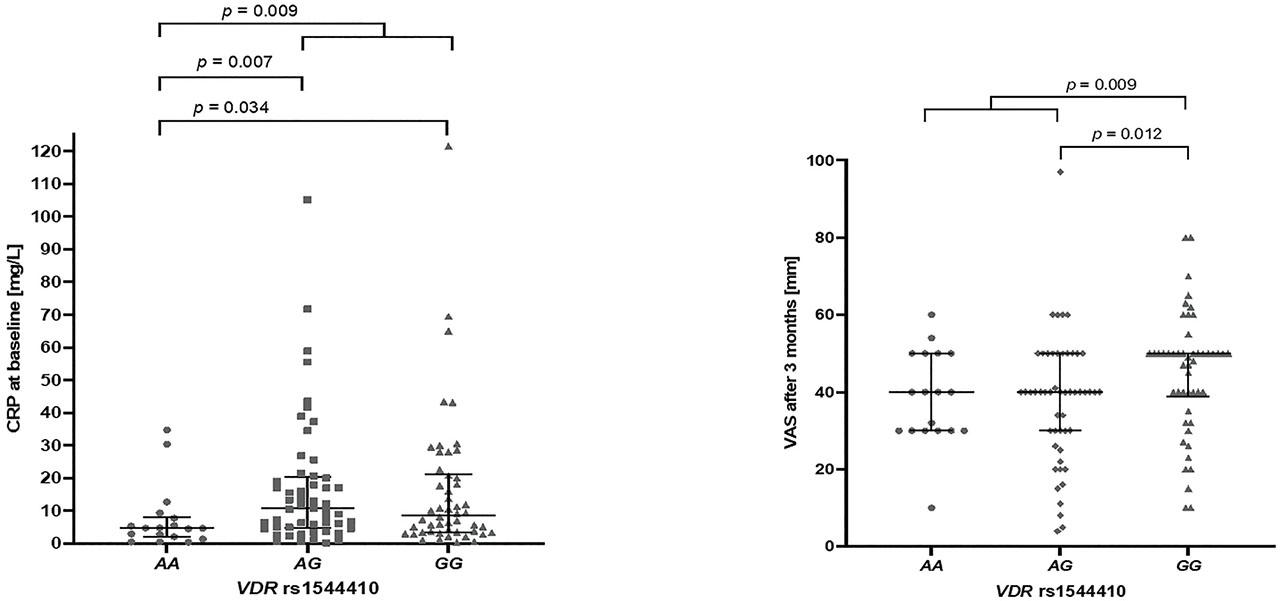
Fig 2.
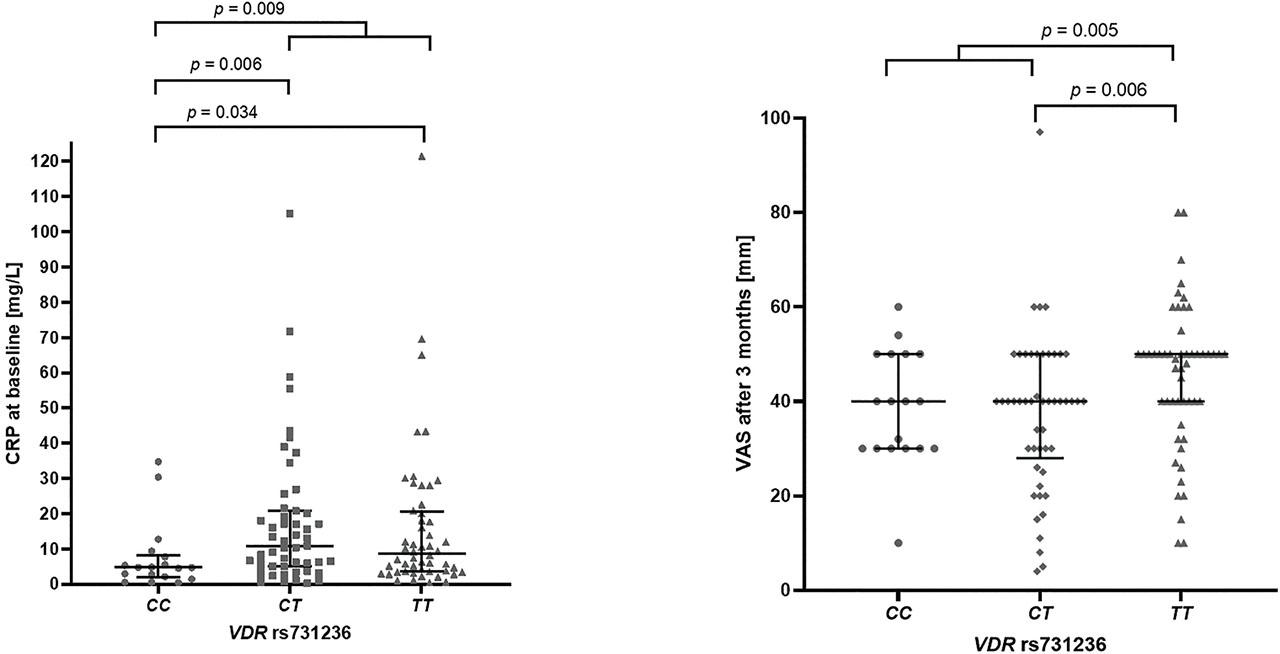
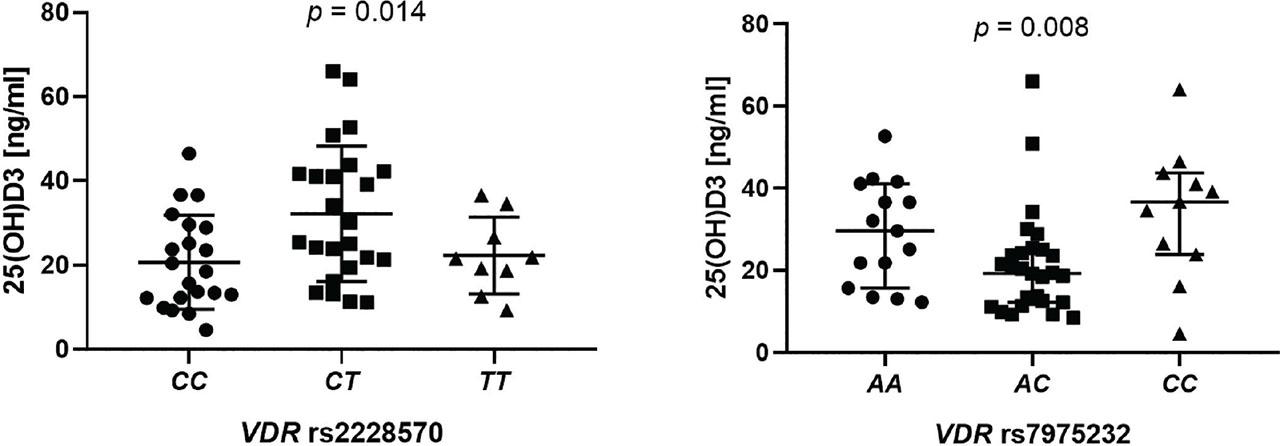
Fig 3.
Characteristics of patients’ subgroup
| Calcium (mg/dL) | Alkaline phosphatase (U/L) | Vitamin D3 (ng/mL) | TSH (ulU/mL) | |
|---|---|---|---|---|
| N | 56 | 64 | 54 | 64 |
| Minimum | 8.9 | 36 | 4.64 | 0.271 |
| Median | 9.7 | 74.5 | 23.67 | 1.201 |
| Maximum | 10.7 | 350 | 66 | 4.331 |
| IQR | 0.5 | 33.25 | 23.14 | 0.744 |
Characteristics of the RA patients included in the study
| Number of patients | 121 |
|---|---|
| Age mean in years (±SD) | 52.2 (13.3) |
| Disease duration mean in years (±SD) | 13.6 (9.31) |
| Disease onset mean in years (±SD) | 38.6 (14.0) |
| Sex F/M (%) | 96/25 (79.3) |
| BMI mean (±SD) | 25.7 (4.69) |
| RF-positive patients (%) | 86.7 |
| Anti-CCP positive patients (%) | 82.4 |
| Anti-TNF drugs: | N (%) |
| Adalimumab | 41 (33.9) |
| Etanercept | 48 (39.7) |
| Certolizumab pegol | 19 (15.7) |
| Golimumab | 9 (7.44) |
| Infliximab | 4 (3.31) |
| Concomitant treatment at the start of biologic treatment | (%) |
| NSAIDs | 73.2 |
| MTX | 83.6 |
| Corticosteroids | 82.1 |
| Disease activity: | |
| DAS28 before treatment, mean (±SD) | 6.14 (0.713) |
| DAS28 after 6 months of treatment, mean (±SD) | 2.63 (0.939) |
Relationships between VDR rs7975232 genetic variants and vitamin D levels in RA patients
| VDR rs7975232 | 25(OH)D3 conc. (ng/mL) | |
|---|---|---|
| Median (IQR) | AA | 29.6 (25.34) |
| AC + CC | 21.54 (21.2) | |
| AA + AC | 21.54 (17.02) | |
| CC | 36.68 (19.87) | |
| AA + CC | 33.33 (20.81) | |
| AC | 19.32 (12.56) | |
| Mann–Whitney test p-values | AA vs. AC + CC | 0.1703 |
| AA + AC vs. CC | 0.029 | |
| AA + CC vs. AC | 0.003 | |
| AA vs. AC | 0.021 | |
| AC vs. CC | 0.009 | |
| AA vs. CC | 0.324 |
VDR genotype and minor allele frequencies of RA patients and control group
| Genotypes | MAF | χ2 | χ2 p-value | ||||||||||
|---|---|---|---|---|---|---|---|---|---|---|---|---|---|
| SNP | RA | Controls | RA | Controls | RA | Controls | RA | Controls | 1000 genomes project–CEU | RA | Controls | RA | Controls |
| rs1544410 | AA | AG | GG | 0.368 | 0.434 | 0.470 | 0.408 | 2.146 | 0.523 | 0.143 | |||
| 18 | 27 | 53 | 52 | 50 | 43 | ||||||||
| rs2228570 | CC | CT | TT | 0.438 | 0.422 | 0.429 | 0.006 | 0.417 | 0.937 | 0.518 | |||
| 38 | 39 | 60 | 63 | 23 | 20 | ||||||||
| rs731236 | CC | CT | TT | 0.360 | 0.409 | 0.400 | 0.869 | 2.920 | 0.351 | 0.087 | |||
| 18 | 15 | 51 | 65 | 52 | 36 | ||||||||
| rs7975232 | AA | AC | CC | 0.483 | 0.496 | 0.404 | 0.068 | 1.692 | 0.794 | 0.193 | |||
| 33 | 26 | 59 | 65 | 29 | 25 | ||||||||
Relationships between VDR rs2228570 genetic variants and vitamin D levels in RA patients
| VDR rs2228570 | 25(OH)D3 conc. (ng/mL) | |
|---|---|---|
| Mean (±SD) | CC | 20.69 ± 11.12 |
| CT | 32.22 ± 16.06 | |
| TT | 22.33 ± 9.077 | |
| Median (IQR) | CC | 18.47 (16.98) |
| CT + TT | 25.08 (22.07) | |
| CC + CT | 23.88 (24.48) | |
| TT | 21.54 (14.92) | |
| p-values | CC vs. CT + TT | 0.028† |
| CC + CT vs. TT | 0.508† | |
| CC + TT vs. CT | 0.004‡ | |
| CC vs. CT | 0.009‡ | |
| CT vs. TT | 0.093‡ | |
| CC vs. TT | 0.701‡ |