
Table 1.
Summary comparison of the cohorts
| Anti-BCMA N = 69 | Anti-CD19 N = 65 | p-value | |
|---|---|---|---|
| Age in years, median (range) | 68 (40–84) | 51.5 (29–89) | 0.915 |
| Gender, male/female, N | 36/33 | 30/35 | 0.495 |
| Lymphodepletion regimen, N (%) | 1 | ||
| Flu/CTX | 63 (91) | 59 (91) | |
| Bendamustine | 6 (9) | 6 (9) | |
| CRS grade, N (%) | <0.001 | ||
| 0 | 8 (12) | 27 (43) | |
| I | 18 (26) | 12 (18) | |
| II | 34 (49) | 12 (18) | |
| III | 9 (13) | 12 (18) | |
| IV | 0 (0) | 2 (3) | |
| EASIX score, median (range), N | |||
| EASIX-pre | 1.69 (0.2–65.5); 69 | 1.24 (0.13–887.16); 61 | 0.034 |
| EASIX-ld | 1.49 (0.2–63.5); 69 | 1.1 (0.12–625.42); 58 | 0.044 |
| EASIX-gap | 1.48 (0.19–103.66); 68 | 1.17 (0.15–171.4); 58 | 0.093 |
| EASIX-0 | 1.38 (0.28–123.43); 64 | 1.04 (0.23–94.92); 63 | 0.059 |
| s-EASIX score, mean (range), N | |||
| s-EASIX-pre | 2.05 (0.25–53.61); 69 | 1.28 (0.27–499.52); 61 | 0.032 |
| s-EASIX-ld | 1.87 (0.2–54.5); 69 | 1.3 (0.3–392.11); 58 | 0.029 |
| s-EASIX-gap | 1.89 (0.2–64.48); 68 | 1.34 (0.35–107.46); 58 | 0.086 |
| s-EASIX-0 | 1.82 (0.26–51.3); 64 | 1.15 (0.45–95.71); 63 | 0.054 |
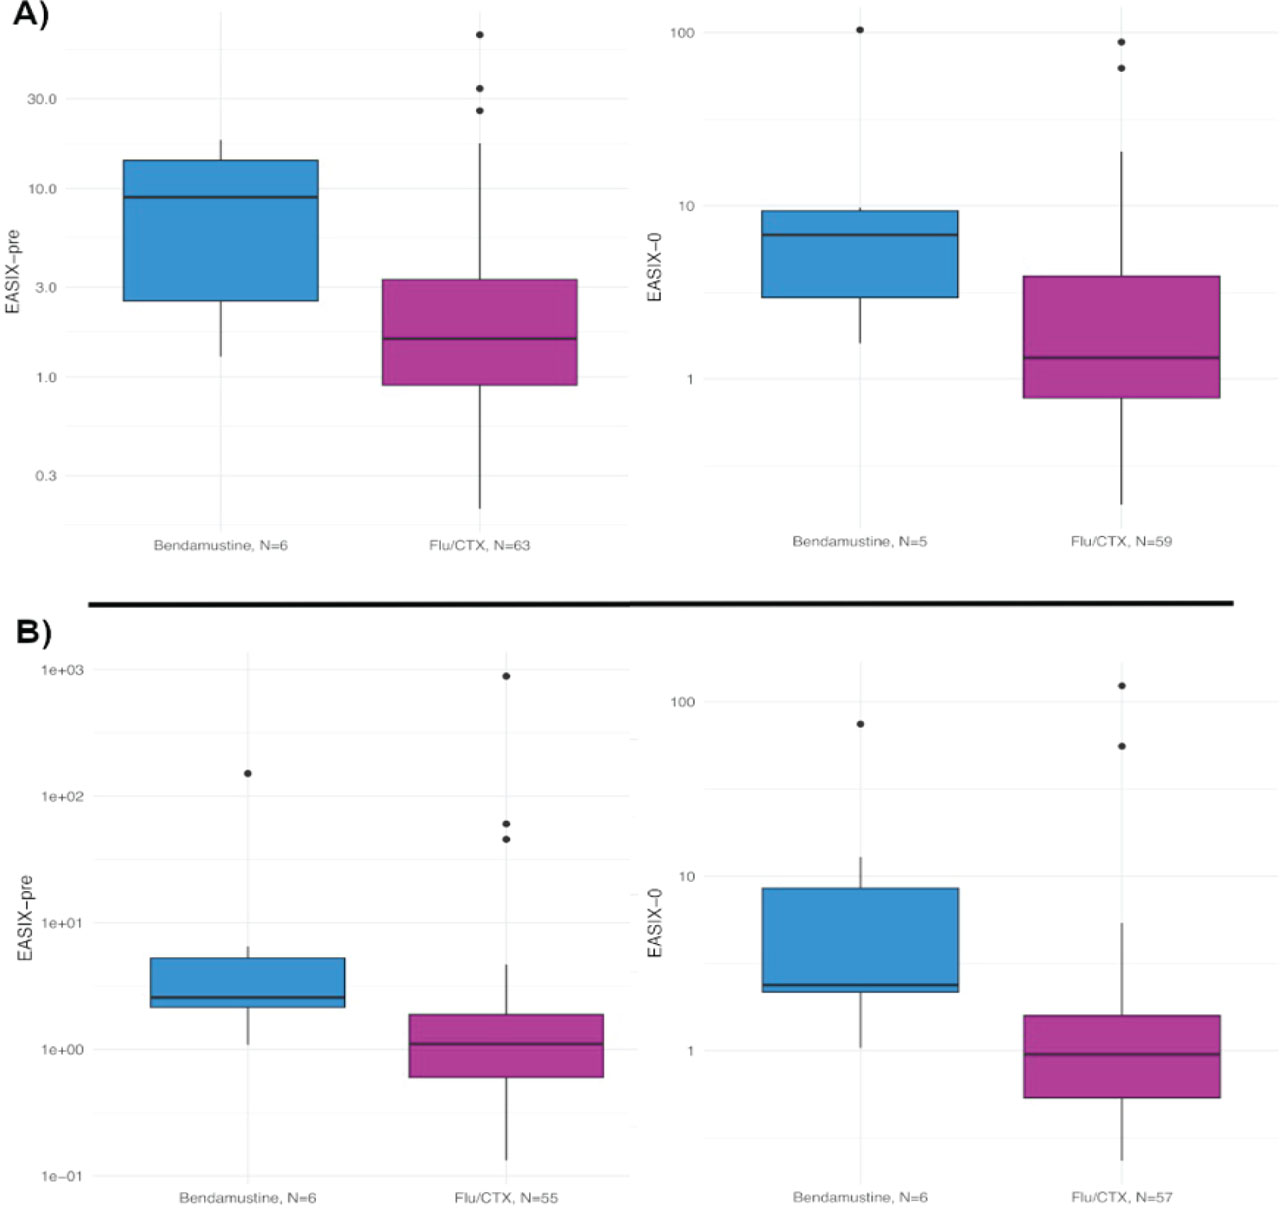
Fig 1.
EASIX scores and lymphodepleting therapy. Patients treated with bendamustine show significantly higher EASIX values compared to Flu/CTX-treated individuals – pre-lymphodepletion and day 0 results. (A) MM/AL amyloidosis cohort and (B) LBCL cohort. AL, amyloid light-chain; EASIX, Endothelial Activation and Stress Index; Flu/CTX, fludarabine/cyclophosphamide; LBCL, large B-cell lymphoma; MM, multiple myeloma.
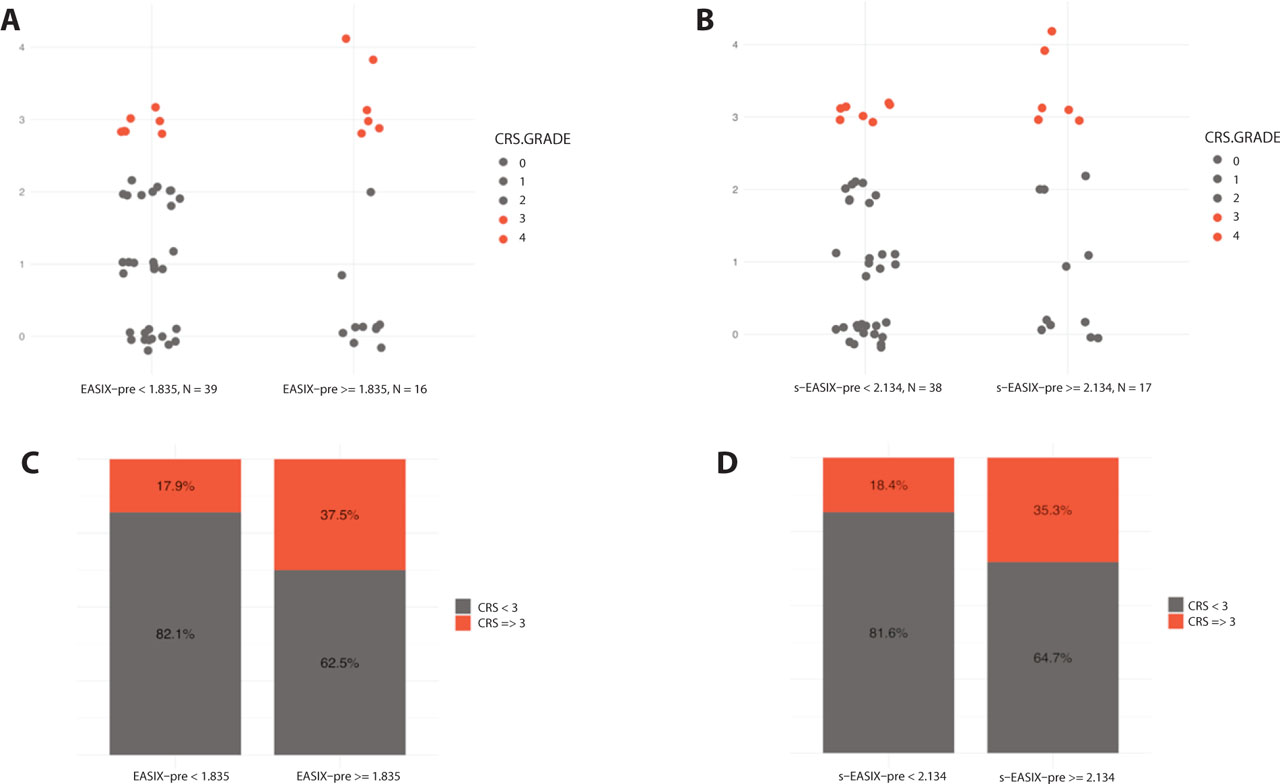
Fig 2.
Association between categorized EASIX-pre/s-EASIX-pre scores and CRS grade. (A) Jitter plot depicting the distribution of the individual CRS grade cases, divided into two groups based on EASIX-pre cutoff of 1.835. Patients with higher EASIX-pre scores (equal or above the cutoff) are more likely to experience CRS grade ≥3 (OR = 4.59, 95% CI: 1.13–21.84, p = 0.033). (B) Jitter plot depicting the distribution of the individual CRS grade cases, divided into two groups based on s-EASIX-pre cutoff of 2.134. Patients with higher s-EASIX-pre scores (equal or above the cutoff) are more likely to experience CRS grade ≥3 (OR = 4.13, 95% CI: 1.01–17.93, p = 0.01). (C) Bar chart depicting percentage of CRS grade ≥3 based on EASIX-pre cutoff of 1.835. (D) Bar chart depicting percentage of CRS grade ≥3 based on s-EASIX-pre cutoff of 2.134. CRS, cytokine release syndrome; EASIX, Endothelial Activation and Stress Index; s-EASIX, simplified EASIX.