
Fig 1.
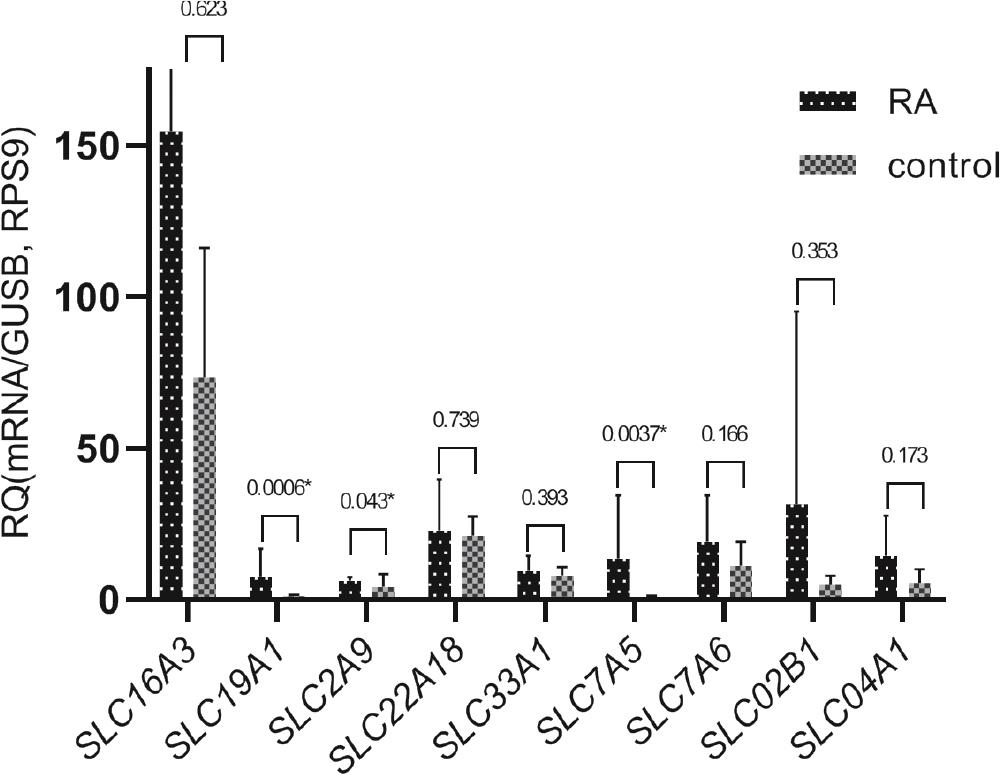
Fig 2.
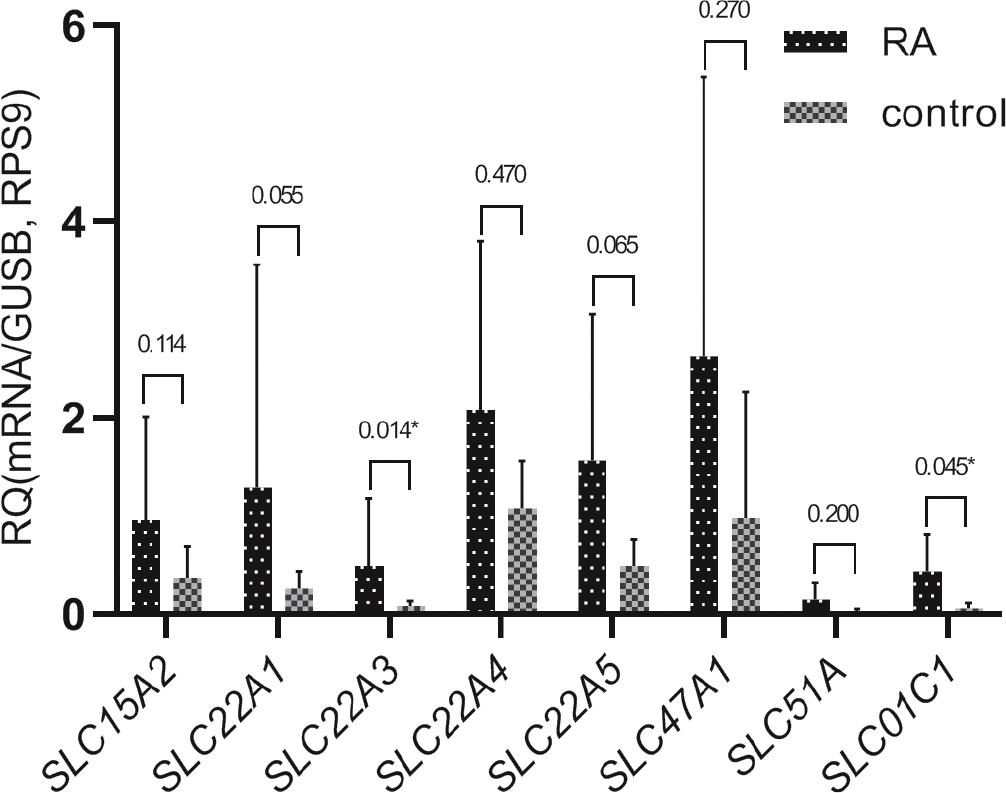
Fig 3.
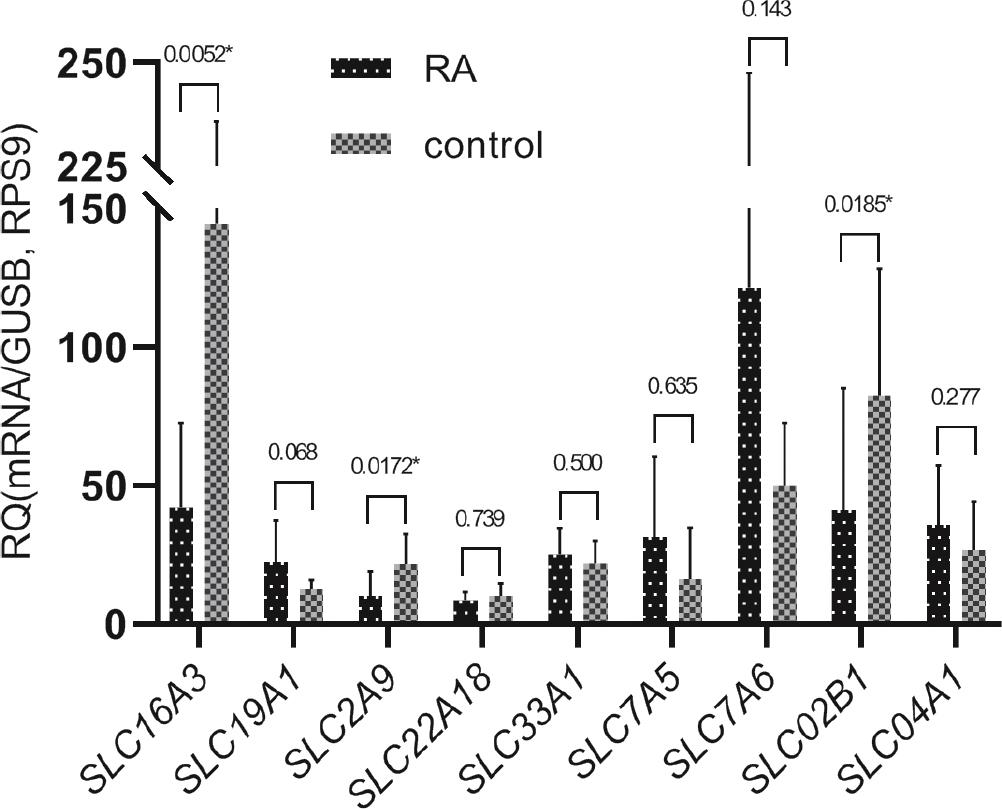
Fig 4.
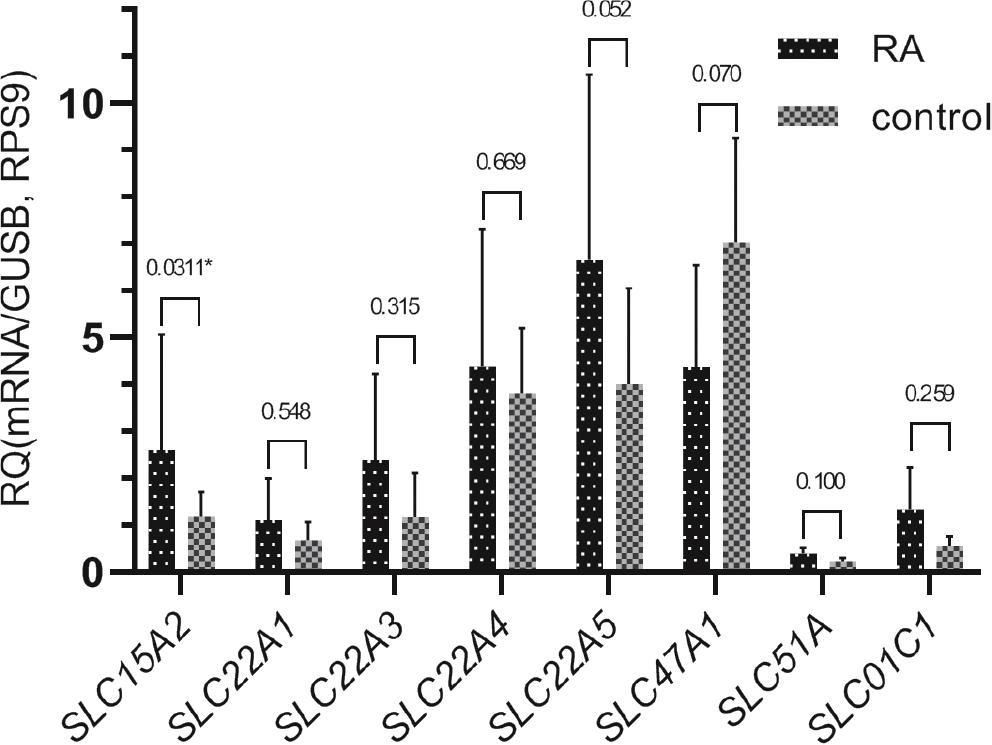
Fig 5.
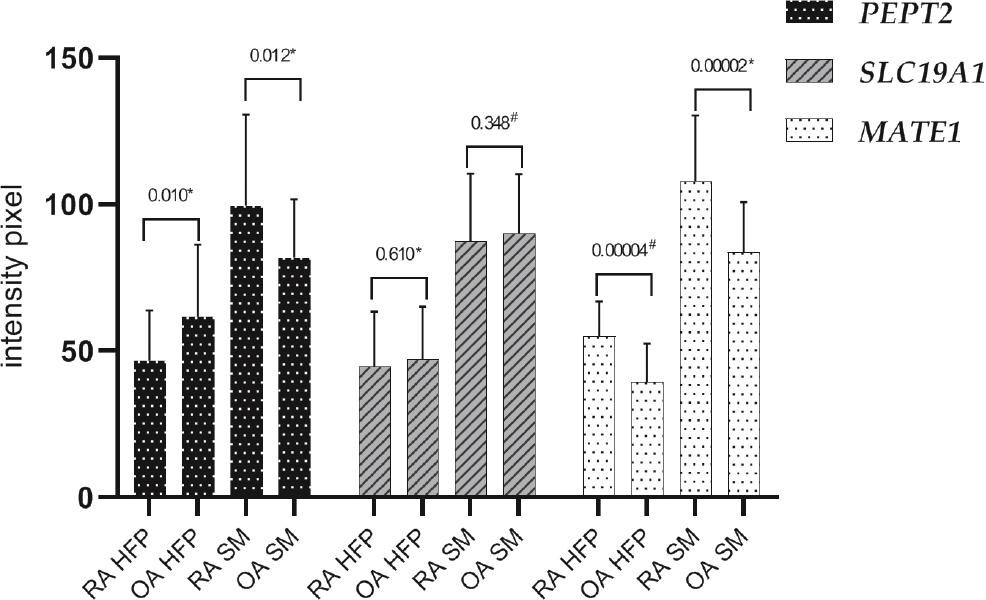
Fig 6.
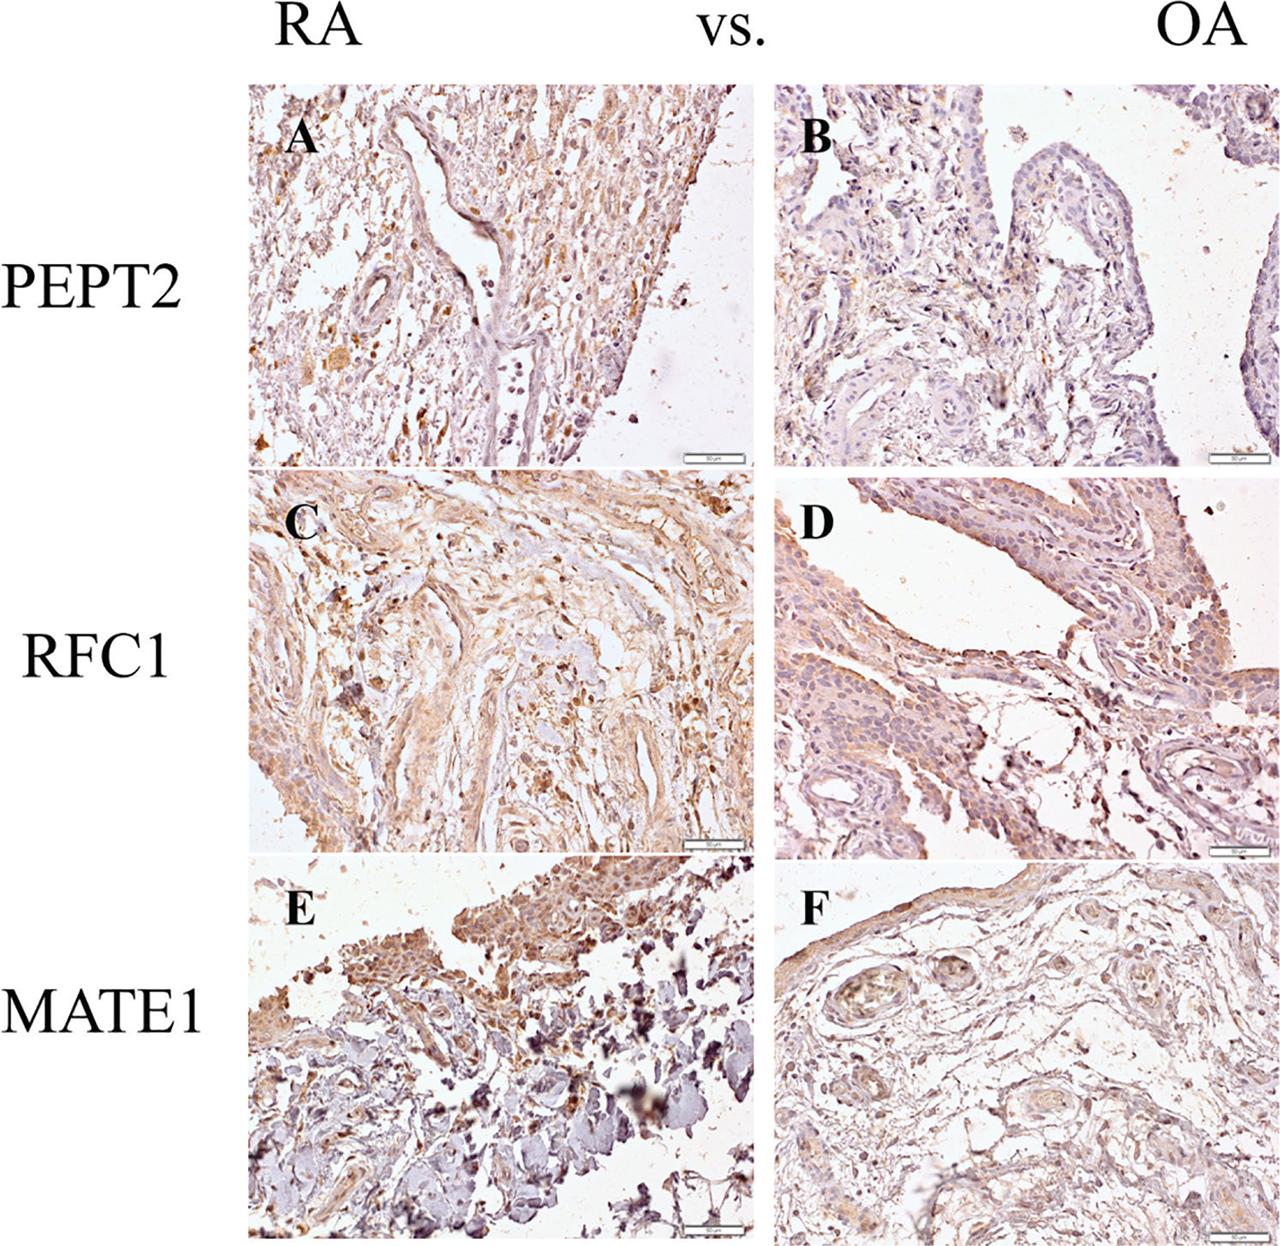
Fig 7.
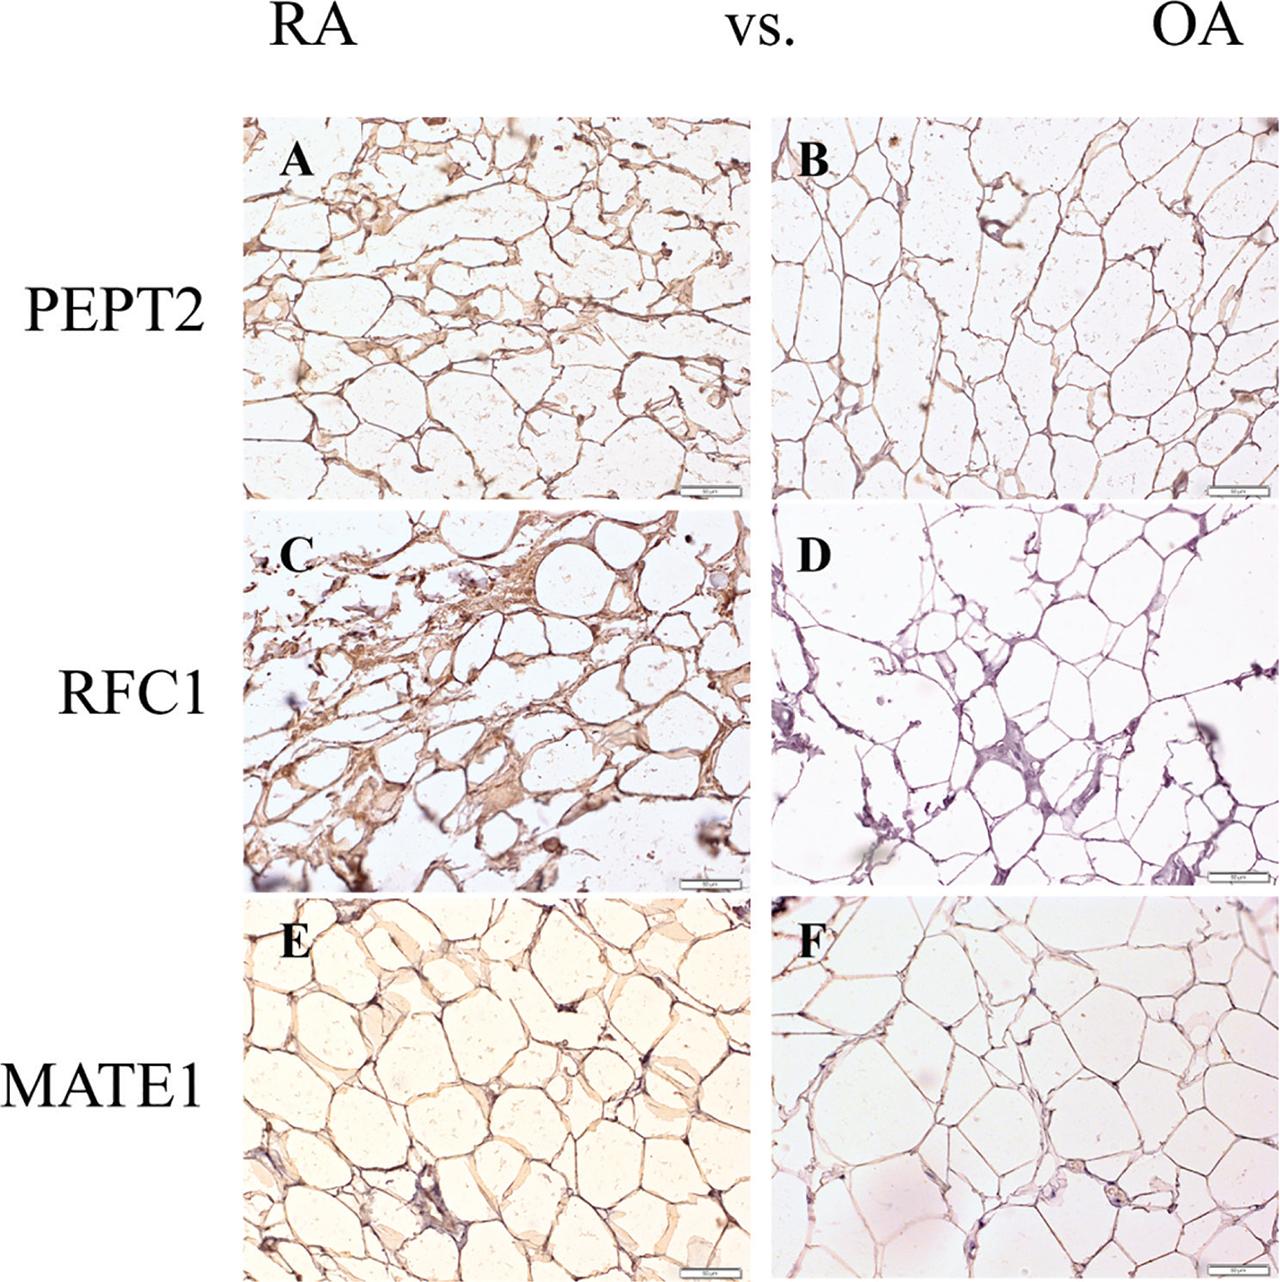
Fig 8.
IRS values for transportation proteins expression in SM samples in RA and OA patients
| Protein | RA | OA | ||||||
|---|---|---|---|---|---|---|---|---|
| Median | Average | Min. | Max. | Median | Average | Min. | Max | |
| PEPT2 | 8 | 8.13 | 4 | 12 | 6 | 5.25 | 0 | 9 |
| RFC1 | 8 | 7.93 | 4 | 12 | 6 | 5.63 | 1 | 12 |
| MATE1 | 6 | 6.43 | 2 | 9 | 6 | 5.85 | 0 | 12 |
SLC transporters expression in SM and HFP
| SM (mean ± SD) | HFP (mean ± SD) | p-value* | ||
|---|---|---|---|---|
| SLC0C1 | ∆∆CT | 0.437 ± 0.37 | 1.332 ± 0.90 | 0.088 |
| SLC02B1 | 31.462 ± 63.66 | 41.233 ± 43.92 | 0.070 | |
| SLC04A1 | 14.388 ± 13.31 | 35.838 ± 21.45 | 0.036 | |
| SLC2A9 | 6.197 ± 1.22 | 10.295 ± 8.95 | 0.895 | |
| SLC7A5 | 13.45 ± 20.90 | 31.441 ± 28.92 | 0.239 | |
| SLC7A6 | 18.971 ± 15.31 | 121.553 ± 125.98 | 0.0005 | |
| SLC15A2 | 0.963 ± 1.05 | 2.6 ± 2.47 | 0.039 | |
| SLC16A3 | 154.528 ± 206.39 | 42.223 ± 30.48 | 0.041 | |
| SLC19A1 | 7.35 ± 9.30 | 22.44 ± 15.00 | 0.006 | |
| SLC22A1 | 1.289 ± 2.28 | 1.101 ± 0.89 | 0.307 | |
| SLC22A3 | 0.491 ± 0.69 | 2.386 ± 1.84 | 0.010 | |
| SLC22A4 | 2.081 ± 1.72 | 4.371 ± 2.93 | 0.064 | |
| SLC22A5 | 1.569 ± 1.49 | 6.656 ± 3.96 | 0.0008 | |
| SLC22A18 | 22.775 ± 16.89 | 8.694 ± 2.87 | 0.005 | |
| SLC33A1 | 9.382 ± 5.01 | 25.173 ± 9.62 | 0.0008 | |
| SLC47A1 | 2.632 ± 2.84 | 4.3612 ± 2.18 | 0.225 | |
| SLC51A | 0.146 ± 0.17 | 0.397 ± 0.12 | 0.275 |
Correlation between the expression of SLC transporters in SM and clinical parameters
| CRP | WBC | Age (years) | Disease duration | DAS28 | ||
|---|---|---|---|---|---|---|
| SLC15A2 | R | −0.267 | 0.517 | −0.385 | 0.017 | −0.217 |
| p-value | 0.488 | 0.154 | 0.306 | 0.965 | 0.576 | |
| SLC22A18 | R | 0.188 | −0.200 | 0.261 | −0.118 | 0.176 |
| p-value | 0.603 | 0.580 | 0.466 | 0.746 | 0.627 | |
| SLC16A3 | R | 0.006 | −0.091 | −0.176 | 0.285 | −0.018 |
| p-value | 0.987 | 0.803 | 0.626 | 0.425 | 0.960 | |
| SLC33A1 | R | 0.261 | −0.382 | 0.122 | 0.415 | 0.188 |
| p-value | 0.467 | 0.276 | 0.738 | 0.233 | 0.603 | |
| SLC19A1 | R | −0.357 | 0.548 | 0.190 | 0.400 | −0.333 |
| p-value | 0.385 | 0.160 | 0.651 | 0.326 | 0.420 | |
| SLC47A1 | R | −0.321 | 0.214 | −0.500 | 0.436 | −0.250 |
| p-value | 0.482 | 0.645 | 0.253 | 0.328 | 0.589 | |
| SLC2A9 | R | −0.783 | 0.100 | −0.393 | −0.339 | −0.767 |
| p-value | 0.013 | 0.798 | 0.295 | 0.372 | 0.016 | |
| SLC51A | R | 1.000 | 0.500 | −0.500 | −0.866 | 1.000 |
| p-value | − | 0.667 | 0.667 | 0.333 | − | |
| SLC22A1 | R | −0.238 | 0.595 | −0.132 | 0.146 | −0.238 |
| p-value | 0.570 | 0.120 | 0.756 | 0.729 | 0.570 | |
| SLC22A3 | R | −0.464 | 0.429 | 0.214 | 0.436 | −0.429 |
| p-value | 0.294 | 0.337 | 0.645 | 0.328 | 0.337 | |
| SLC7A5 | R | −0.050 | 0.333 | −0.519 | 0.373 | −0.033 |
| p-value | 0.898 | 0.381 | 0.152 | 0.323 | 0.932 | |
| SLC22A4 | R | 0.036 | 0.036 | −0.286 | 0.764 | 0.036 |
| p-value | 0.939 | 0.939 | 0.535 | 0.046 | 0.939 | |
| SLC7A6 | R | 0.200 | 0.455 | 0.195 | 0.415 | 0.212 |
| p-value | 0.580 | 0.187 | 0.590 | 0.233 | 0.556 | |
| SLC22A5 | R | −0.350 | −0.033 | 0.259 | 0.602 | −0.333 |
| p-value | 0.356 | 0.932 | 0.500 | 0.086 | 0.381 | |
| SLC01C1 | R | −0.700 | −0.200 | 0.600 | 0.500 | −0.700 |
| p-value | 0.188 | 0.747 | 0.285 | 0.391 | 0.188 | |
| SLC02B1 | R | −0.491 | 0.503 | 0.255 | 0.223 | −0.503 |
| p-value | 0.150 | 0.138 | 0.476 | 0.536 | 0.138 | |
| SLC04A1 | R | 0.143 | 0.095 | −0.048 | 0.424 | 0.024 |
| p-value | 0.736 | 0.823 | 0.911 | 0.295 | 0.955 |
Correlation between the expression of SLC transporters in Hoffa’s pad and clinical parameters
| CRP | WBC | Age (years) | Disease duration | DAS28 | ||
|---|---|---|---|---|---|---|
| SLC15A2 | r | 0.256 | 0.250 | −0.357 | 0.382 | 0.255 |
| p-value | 0.579 | 0.589 | 0.432 | 0.398 | 0.582 | |
| SLC22A18 | r | −0.106 | −0.261 | 0.292 | 0.344 | 0.085 |
| p-value | 0.770 | 0.467 | 0.413 | 0.331 | 0.815 | |
| SLC16A3 | r | 0.400 | 0.552 | −0.195 | 0.368 | 0.530 |
| p-value | 0.252 | 0.098 | 0.590 | 0.295 | 0.115 | |
| SLC33A1 | r | −0.052 | 0.017 | 0.393 | 0.703 | 0.286 |
| p-value | 0.894 | 0.966 | 0.295 | 0.034 | 0.456 | |
| SLC19A1 | r | −0.355 | −0.024 | 0.357 | 0.194 | 0.217 |
| p-value | 0.388 | 0.955 | 0.385 | 0.645 | 0.606 | |
| SLC47A1 | r | 0.473 | 0.821 | −0.643 | 0.273 | 0.691 |
| p-value | 0.284 | 0.023 | 0.119 | 0.554 | 0.086 | |
| SLC2A9 | r | −0.279 | −0.283 | 0.117 | −0.177 | 0.185 |
| p-value | 0.468 | 0.460 | 0.765 | 0.648 | 0.634 | |
| SLC51A | r | 0.500 | 1.000 | −0.500 | 0.866 | 1.000 |
| p-value | 0.667 | − | 0.667 | 0.333 | − | |
| SLC22A1 | r | −0.866 | −0.500 | 0.500 | −0.866 | −0.866 |
| p-value | 0.333 | 0.667 | 0.667 | 0.333 | 0.333 | |
| SLC22A3 | r | −0.540 | −0.667 | 0.733 | 0.203 | −0.445 |
| p-value | 0.134 | 0.050 | 0.025 | 0.601 | 0.230 | |
| SLC7A5 | r | 0.516 | 0.486 | 0.200 | 0.088 | 0.530 |
| p-value | 0.295 | 0.329 | 0.704 | 0.868 | 0.280 | |
| SLC22A4 | r | −0.185 | −0.357 | 0.821 | 0.327 | −0.182 |
| p-value | 0.691 | 0.432 | 0.023 | 0.474 | 0.696 | |
| SLC7A6 | r | −0.256 | −0.188 | 0.213 | 0.491 | 0.110 |
| p-value | 0.475 | 0.603 | 0.555 | 0.150 | 0.763 | |
| SLC22A5 | r | −0.669 | −0.224 | 0.018 | −0.153 | −0.189 |
| p-value | 0.034 | 0.533 | 0.960 | 0.672 | 0.601 | |
| SLC01C1 | r | −0.906 | −0.250 | 0.393 | 0.255 | −0.436 |
| p-value | 0.005 | 0.589 | 0.383 | 0.582 | 0.328 | |
| SLC02B1 | r | −0.344 | −0.030 | −0.188 | 0.436 | −0.268 |
| p-value | 0.331 | 0.934 | 0.602 | 0.208 | 0.454 | |
| SLC04A1 | r | 0.732 | 0.143 | −0.119 | −0.590 | 0.395 |
| p-value | 0.039 | 0.736 | 0.779 | 0.123 | 0.333 |
Antibodies used in the IHC procedure and the IRS evaluation
| Antibody | Host | Manufacturer | Rate of dilution | Time of incubation/temperature |
|---|---|---|---|---|
| Anti-PEPT2 (SLC15A2) | Rabbit | Abcam, Cambridge, United Kingdom | 1:75 | 1 h/RT |
| Anti-RFC1 (SLC19A1) | Mouse | Santa Cruz Biotechnology Inc., Dallas, TX, USA | 1:100 | 1 h/RT |
| Anti-MATE1 (SLC47A1) | Rabbit | Sigma Prestige, Merck, Darmstadt, Germany | 1:200 | 1 h/RT |
TaqMan gene expression assays
| SLC transporters | Housekeeping genes | ||
|---|---|---|---|
| Gene symbol | TaqMan assay ID | Gene symbol | TaqMan assay ID |
| SLC01A2 | Hs00366488_m1 | GUSB | Hs99999908_m1 |
| SLC01B1 | Hs00272374_m1 | RPS9 | Hs02339424_g1 |
| SLC01B3 | Hs00351987_m1 | ||
| SLC01C1 | Hs00213714_m1 | ||
| SLC02B1 | Hs01030353_m1 | ||
| SLC04A1 | Hs00983988_m1 | ||
| SLC04C1 | Hs00698884_m1 | ||
| SLC10A1 | Hs00161820_m1 | ||
| SLC10A2 | Hs01001557_m1 | ||
| SLC15A1 | Hs00192639_m1 | ||
| SLC15A2 | Hs01113665_m1 | ||
| SLC16A3 | Hs00358829_m1 | ||
| SLC19A1 | Hs00953344_m1 | ||
| SLC22A1 | Hs00427552_m1 | ||
| SLC22A11 | Hs00945829_m1 | ||
| SLC22A12 | Hs00375985_m1 | ||
| SLC22A18 | Hs00180039_m1 | ||
| SLC22A2 | Hs01010726_m1 | ||
| SLC22A3 | Hs00222691_m1 | ||
| SLC22A4 | Hs01548718_m1 | ||
| SLC22A5 | Hs00929869_m1 | ||
| SLC22A6 | Hs00537914_m1 | ||
| SLC22A7 | Hs00198527_m1 | ||
| SLC22A8 | Hs00188599_m1 | ||
| SLC22A9 | Hs00375768_m1 | ||
| SLC28A1 | Hs00984403_m1 | ||
| SLC28A2 | Hs00188407_m1 | ||
| SLC2A9 | Hs00417125_m1 | ||
| SLC33A1 | Hs00270469_m1 | ||
| SLC47A1 | Hs00217320_m1 | ||
| SLC47A2 | Hs00945650_m1 | ||
| SLC51A | Hs00380895_m1 | ||
| SLC51B | Hs01057182_m1 | ||
| SLC7A5 | Hs01001183_m1 | ||
| SLC7A6 | Hs00187727_m1 | ||
IRS values for transportation proteins expression in HFP in RA and OA patients
| Protein | RA | OA | ||||||
|---|---|---|---|---|---|---|---|---|
| Median | Average | Min. | Max. | Median | Average | Min. | Max. | |
| PEPT2 | 8 | 9.47 | 4 | 12 | 8 | 7.17 | 2 | 12 |
| RFC1 | 12 | 9.06 | 1 | 12 | 4 | 4.93 | 0 | 12 |
| MATE1 | 8 | 7.47 | 2 | 12 | 8 | 6.5 | 1 | 12 |